Multivariate and A/B test analytics
This article explains how to view the results of a multivariate or A/B test. If you haven’t set up your test yet, refer to Create multivariate and A/B tests for steps.
After your campaign has launched, you can check how each variant is performing by selecting your campaign from the Campaigns section of the dashboard.
Analytics by optimization option
Your analytics view varies depending on whether you selected an optimization during your initial setup.
No optimization
If you selected No optimization when setting up your campaign, your analytics view will stay the same. The Campaign Analytics page of your campaign will show the performance of your variants against your control group, if you included one.
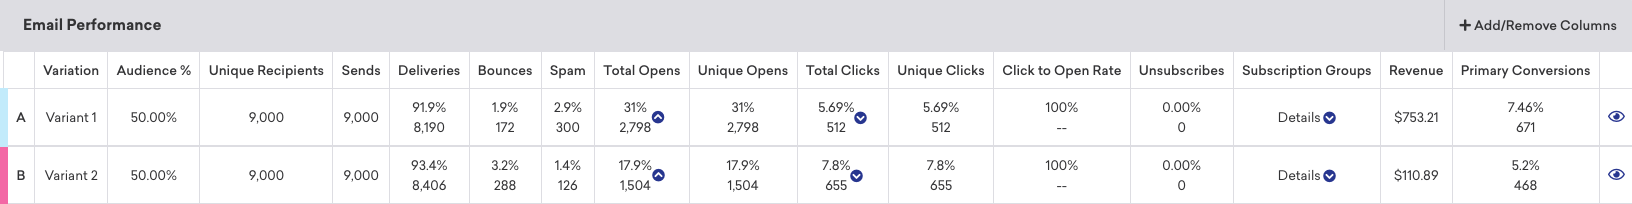
For more details, refer to the Campaign Analytics article for your messaging channel.
BrazeAI™ variant selection (push only)
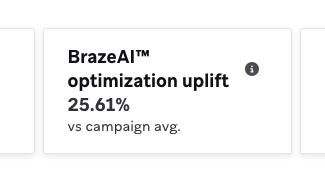
If you use BrazeAI™ variant selection, depending on whether it is a single send or recurring campaign, once the experiment window (or first period for recurring) has passed, you see the uplift, if any, on the home page of the campaign. You also see further details similar to Winning Variant if you run a single send campaign.
For more details on how we report uplift on BrazeAI™ Variant Selection, see Variant selection.
Winning Variant
If you selected Winning Variant for your optimization when setting up your campaign, you have access to an additional tab of your campaign analytics called A/B Test Result. After the Winning Variant is sent to the remaining users in your test, this tab shows the results of that send.
The A/B Test Result is divided into two tabs: Initial Test and Winning Variant.
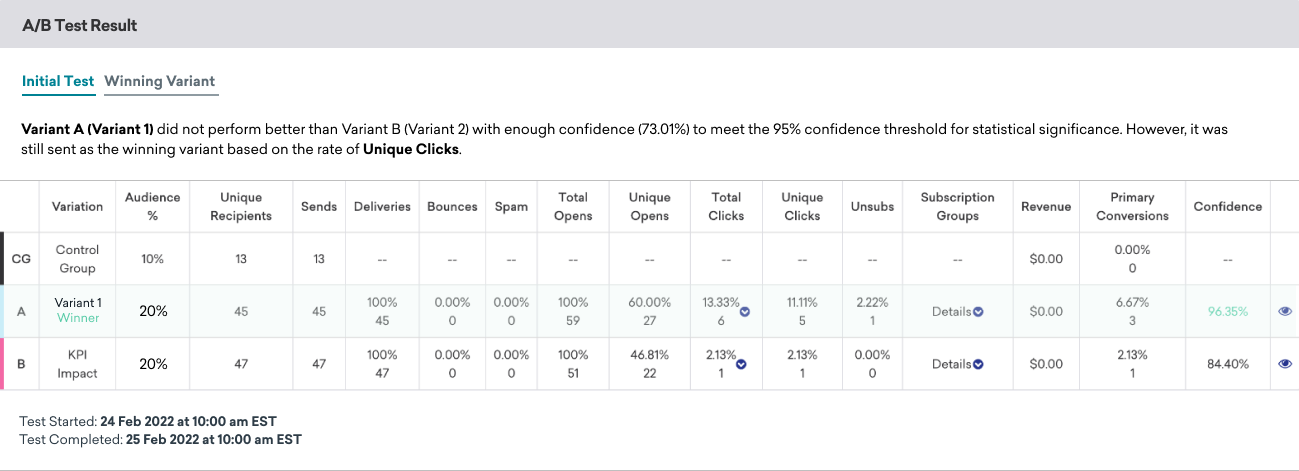
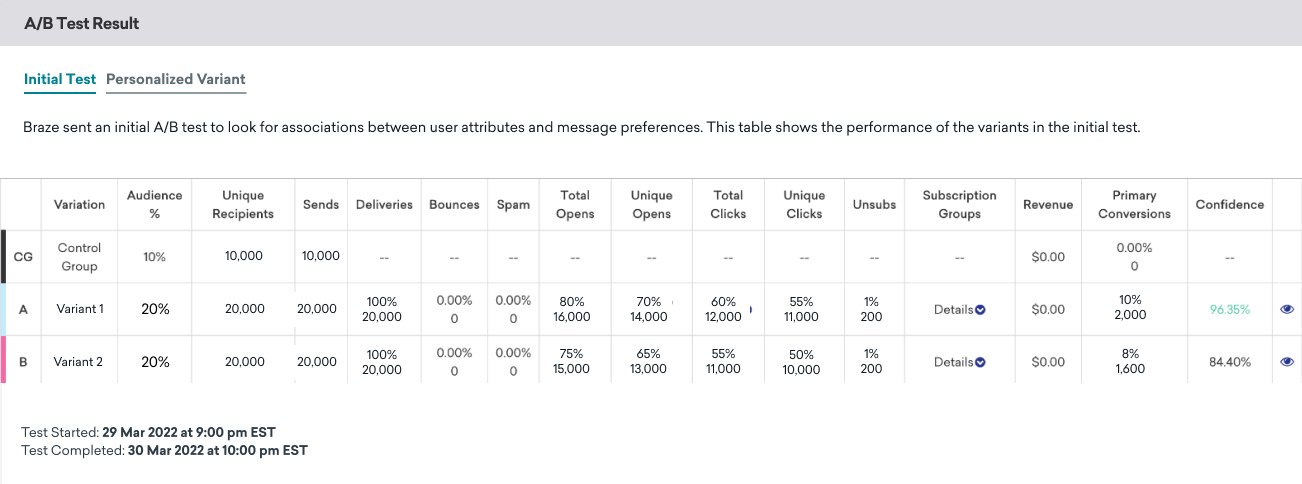
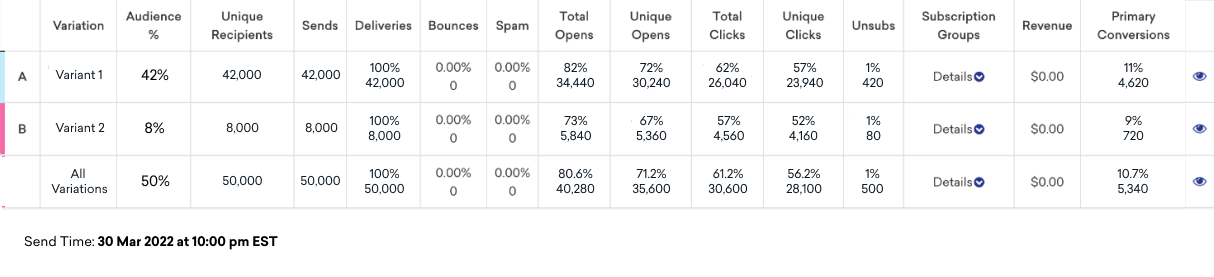
The Initial Test tab shows the metrics for each variant from the initial A/B test sent to a portion of your target segment. You can see a summary of how all the variants performed and whether or not there was a winner during the test.
If one variant outperformed all the others with better than 95% confidence, Braze marks that variant with a “Winner” label.
If no variant beats all the others with 95% confidence and you chose to send the best performing variant anyway, the best performing variant will still be sent out and indicated with the label “Winner”.
How the winning variant is selected
Braze tests all the variants against each other with Pearson’s chi-squared tests. This measures whether or not one variant statistically outperforms all others at a significance level of p < 0.05, or what we refer to as 95% significance. If so, the Winning Variant is indicated with the “Winner” label.
This is a separate test from the confidence score, which only describes the performance of a variant compared to the control with a numeric value between 0 and 100%.
A variant can do better than the control group, but the chi-squared testing checks if one variant is better than all of the rest. Follow-up tests may yield more details.
The Winning Variant tab shows the results of the second send, where each remaining user was sent the best performing variant from the initial test. Your Audience % will add up to the percentage of the target segment you reserved for the Winning Variant group.
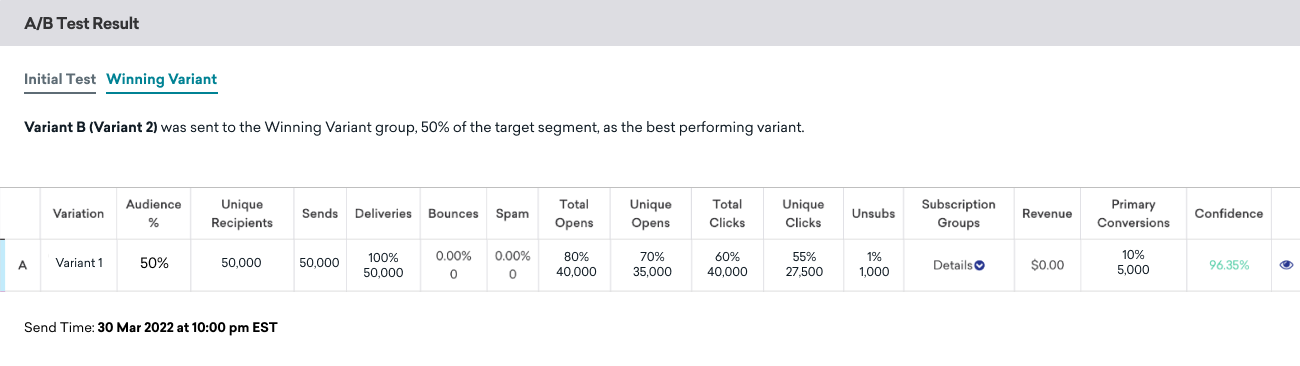
If you want to see the performance of the Winning Variant throughout the campaign, including the A/B test sends, check the Campaign Analytics page.
Personalized Variant
If you selected Personalized Variant for your optimization when setting up your campaign, the A/B Test Result is divided into two tabs: Initial Test and Personalized Variant.
The Initial Test tab shows the metrics for each variant from the initial A/B test sent to a portion of your target segment.
By default, the test looks for associations between each user’s custom events and their message variant preferences. This analysis detects whether custom events increase or decrease likelihood of responding to a particular message variant. These relationships are then used to determine which users get which message variant in the final send.
The relationships between custom events and message preferences are displayed in the table on the Initial Send tab.
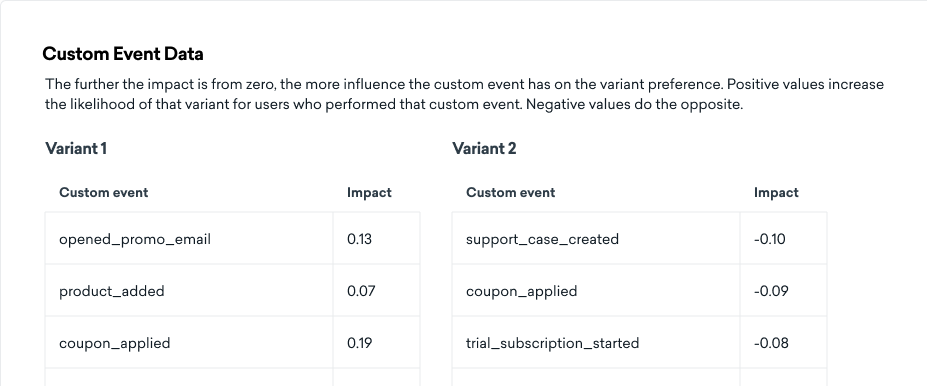
If the test can’t find a meaningful relationship between custom events and path preferences, the test falls back to a session-based analysis method, and no custom event data tables are shown.
Fallback analysis method
Session-based analysis method
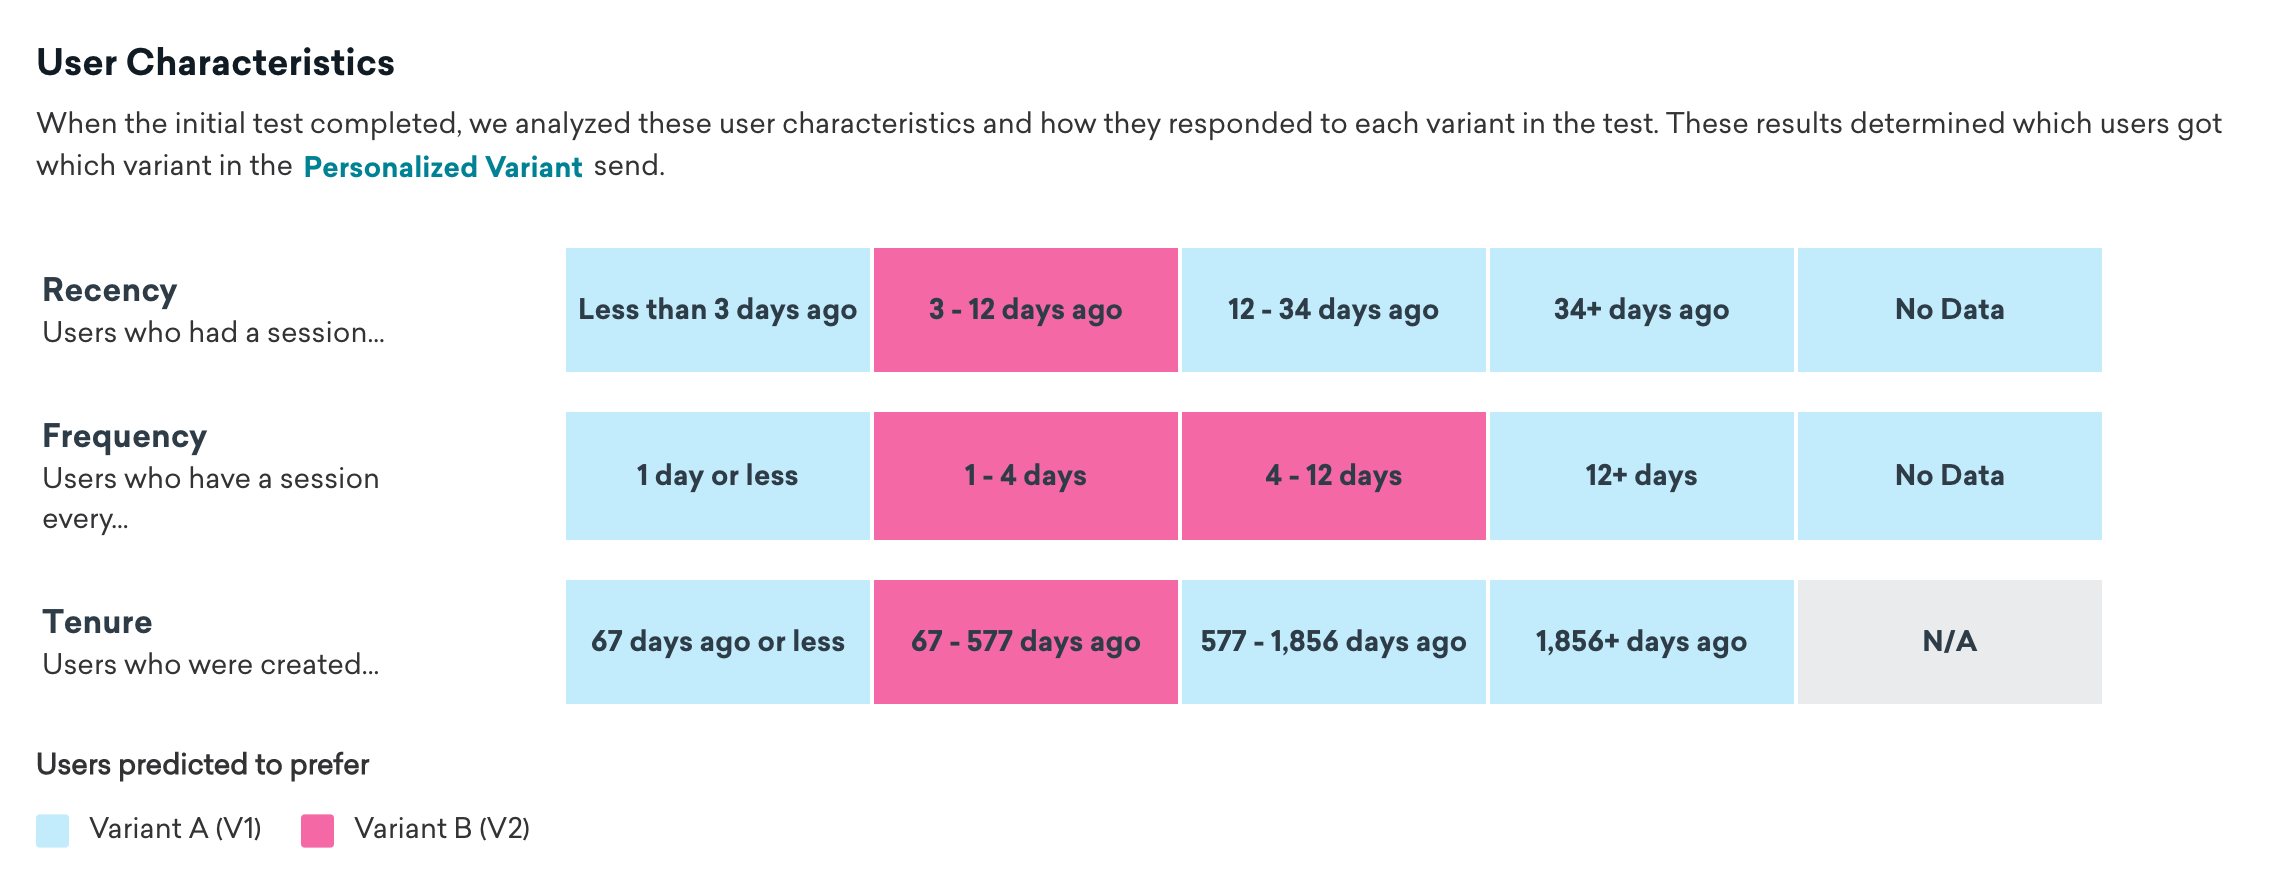
If the fallback method is used to determine Personalized Variants, the Initial Test tab shows a breakdown of users’ preferred variants based on a combination of certain characteristics.
These characteristics are:
- Recency: When they last had a session
- Frequency: How often they have sessions
- Tenure: How long they have been a user
For example, the test may find that most users prefer Variant A, but users who had a session about 3-12 days ago, have between 1-12 days between sessions, and were created in the last 67-577 days tend to prefer Variant B. Therefore, users in that subpopulation received Variant B in the second send, while the rest received Variant A.
How Personalized Variants are selected
With this method, an individual user’s recommended message is the sum of the effects of their specific recency, frequency, and tenure. Recency, frequency, and tenure are split into buckets, as illustrated in the User Characteristics table. The time range of each bucket is determined by the data for users in each individual campaign and will change from campaign to campaign.
Each bucket can have a different contribution or “push” toward each message variant. The strength of the push for each bucket is determined from user responses in the initial send using logistic regression. This table only summarizes the results by displaying which variant users in each bucket tended to engage with. Any individual user’s actual Personalized Variant depends on the sum of the effects of the three buckets they’re in—one for each characteristic.
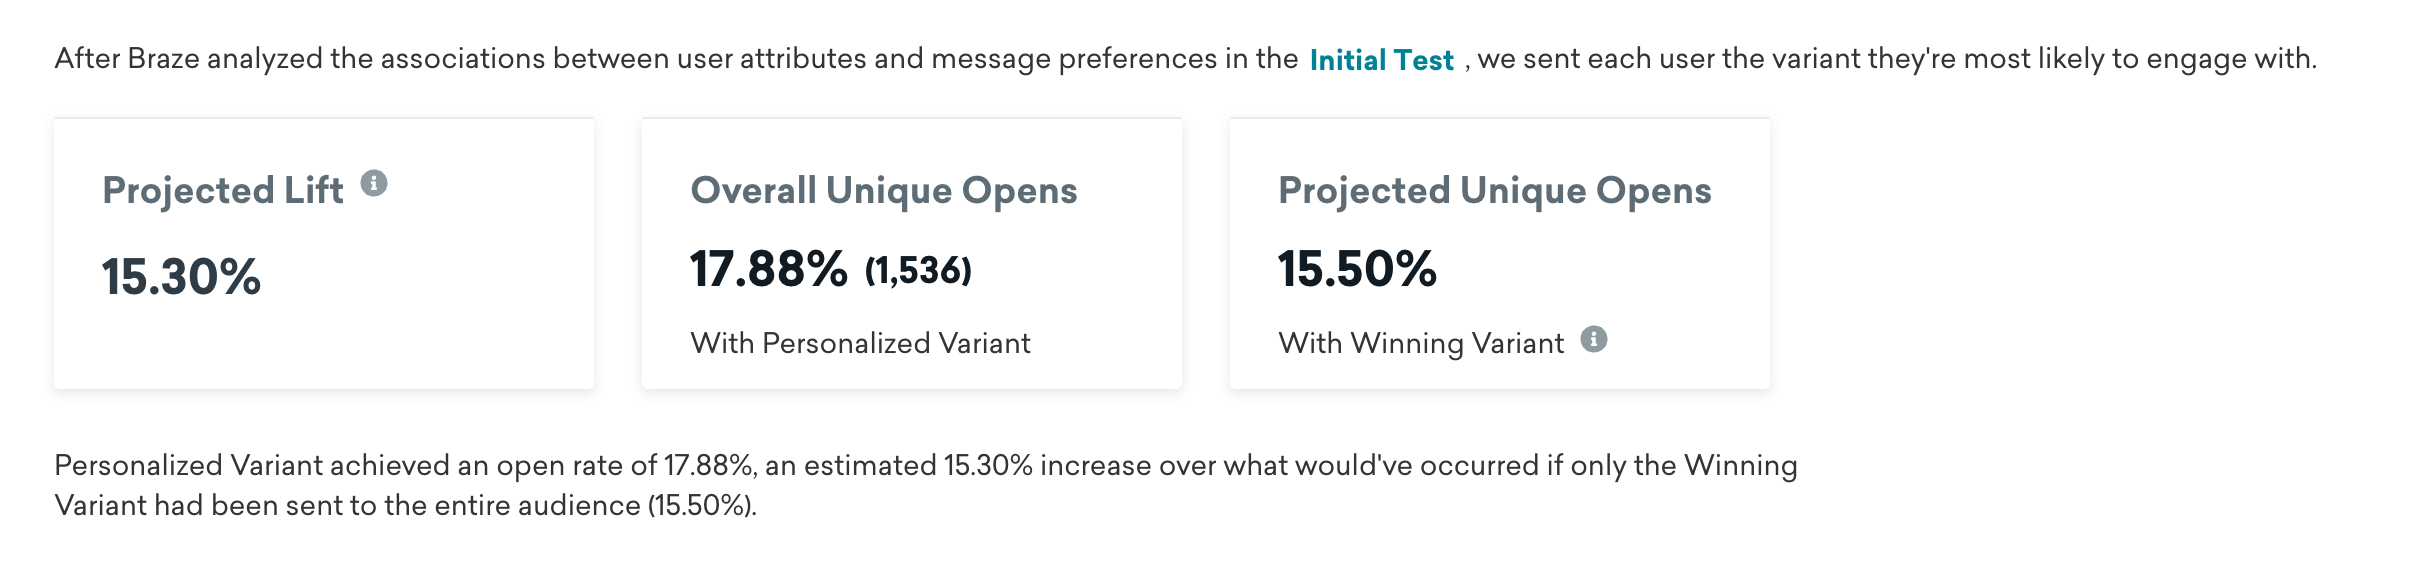
The Personalized Variant tab shows the results of the second send, where each remaining user was sent the variant they were most likely to engage with.
The three cards on this page show your projected lift, overall results, and the projected results if you sent just the Winning Variant instead. Even if there’s no lift, which can sometimes happen, the result is the same as sending only the Winning Variant (a traditional A/B test).
- Projected lift: The improvement in your selected optimization metric for this send due to using Personalized Variants instead of a standard A/B test (if the remaining users only received the Winning Variant).
- Overall results: The results of the second send based on your chosen optimization metric (Unique Opens, Unique Clicks, or Primary Conversion Event).
- Projected results: The projected results of the second send based on your chosen optimization metric if you had sent just the Winning Variant instead.
The table on this page shows the metrics for each variant from the Personalized Variant send. Your Audience % adds up to the percentage of the target segment you reserved for the Personalized Variant group.
Understanding confidence
Confidence is the statistical measure of how certain we are that a difference in data, like conversion rates, is real and not just due to random chance.

Don’t see confidence in your results? Confidence will only appear if you have a control group.
An important part of your results is the confidence of your results. For example, what if the Control Group had a 20% conversion rate and Variant A had a 25% conversion rate? This seems to indicate that sending Variant A is more effective than sending no message. Having a confidence of 95% means that the difference between the two conversion rates is likely due to an actual difference in users’ responses and that there is only a 5% likelihood that the difference has occurred by chance.
Braze compares each variant’s conversion rate against the control’s conversion rate with a statistical procedure called a Z Test. A result of 95% or greater confidence, as in the preceding example, indicates that the difference is statistically meaningful. This is true anywhere you see a confidence metric in the Braze dashboard that describes the difference between two messages or user populations.
In general, a confidence of at least 95% is necessary to show that your results are reflective of users’ actual preferences, and not due to chance. In rigorous scientific tests, 95% confidence (or otherwise commonly referred to as the “p” value being less than 0.05) is the common benchmark used to determine statistical significance. If you continually fail to achieve 95% confidence, try increasing your sample size or decreasing the number of variants.
Confidence reflects how likely it is that an observed difference between variant and control conversion rates is real rather than due to random chance. It is a function of sample size and the magnitude of the difference between conversion rates. Whether overall conversion rates are high or low is typically less important than the observed difference and sample size in determining the strength of the confidence measure. It’s possible for one variant to have a very different conversion rate from another and yet not have a 95% or higher confidence. It’s also possible for two sets of variants to have similar conversion or uplift rates, yet different confidence.
As more data arrives, confidence can decline if variant and control conversion rates move closer together—the difference you are measuring is getting smaller, which can outweigh the effect of a larger sample.
Statistically insignificant results
A test that doesn’t have a confidence of 95% can still hold important insights. Here are a few things you can learn from a test with statistically insignificant results:
- It’s possible that all of your variants had roughly the same effect. Knowing this saves you the time you would’ve spent making these changes. Sometimes, you may find that conventional marketing tactics, such as repeating your call to action, don’t necessarily work for your audience.
- While your results may have been due to chance, they can inform the hypothesis for your next test. If multiple variants appear to have roughly the same results, run some of them again alongside new variants to see if you can find a more effective alternative. If one variant does better, but not by a significant amount, you can perform another test in which this variant’s difference is more exaggerated.
- Keep testing! A test with insignificant results should lead to certain questions. Was there truly no difference between your variants? Should you have structured your test differently? You can answer these questions by running follow-up tests.
- While testing is useful for discovering which type of messaging generates the most response from your audience, it’s also important to understand which alterations in messaging have only a negligible effect. This allows you to either continue testing for another more effective alternative, or save the time that may have been spent deciding between two alternate messages.
Whether or not your test has a clear winner, it can be helpful to run a follow-up test to confirm your results or apply your findings to a slightly different scenario.
Discrepancies between the control group and variant
For in-app message campaigns with A/B or multivariate splits, the percentages you configure are assignment targets. Reported impressions rarely match those percentages exactly, because only users who perform the trigger action log impressions, and control-group users who trigger log an impression even though they never see a message.
For example, let’s say a campaign has a target audience of 200 users at launch, with 100 users in the control group and 100 users in the variant.
The 100 users in the variant receive the in-app message payload, and 50 of them perform the trigger action and see the in-app message. The 100 users in the control group are only tracked if they perform the campaign’s trigger action, and 75 of them perform the trigger action and log an impression but don’t see the in-app message.
Despite the initial 50/50 split, the unique impressions logged aren’t balanced. The variant group has 50 impressions, while the control group has 75 impressions.
Also, variant messages that require longer render time, such as those with large images or templated Connected Content, may log fewer impressions than the control group when users trigger the message but leave before rendering completes.
In-app message delays
For triggered in-app message campaigns that include delayed displays, control group impressions will be recorded when the end user would have originally received the in-app message. For example, if a campaign is set to delay the display by one hour, control group impressions will not be logged until the one-hour delay has passed. This helps with the accurate tracking of impressions related to the intended timing of the message delivery.
Removing message variants after launch
If you remove a message variant from a campaign or Canvas by clicking the X in the composer (for example, when replacing a message from a template), the variant is marked as deleted. Analytics are tied to each variant’s unique ID, so removing a variant affects reporting:
- Pre-existing analytics for the deleted variant (such as opens, clicks, and conversions) no longer appear in the current campaign or Canvas step analytics.
- Variant-level breakdowns exclude deleted variants. If you add a replacement variant, it receives a new variant ID and starts with no historical stats, so metrics may show as 0.
This applies only when you delete and re-add variants. Editing the content of an existing variant in place does not affect historical analytics.
For more details on deleted variants in reporting, see Deleted message variants.
Recommended follow-ups
One multivariate and A/B test can (and should!) inspire ideas for future tests, as well as guide you toward changes in your messaging strategy. Possible follow-up actions include the following:
Change your messaging strategy based on test results
Your multivariate results may lead you to change the way you word or format your messaging.
Change the way you understand your users
Each test will shed light on your users’ behaviors, how users respond to different messaging channels, and the differences (and similarities) among your segments.
Improve the way you structure future tests
Was your sample size too small? Were the differences between your variants too subtle? Each test provides an opportunity to learn how to improve future tests. If your confidence is low, your sample size is too small and should be enlarged for future tests. If you find no clear difference between how your variants performed, it’s possible that the differences were too subtle to have a discernible effect on users’ responses.
Run a follow-up test with a larger sample size
Larger samples will increase the chances of detecting small differences between variants.
Run a follow-up test using a different messaging channel
If you find that a particular strategy is very effective in one channel, you may want to test that strategy in other channels. If one type of message is effective in one channel but not effective in another, you may be able to conclude that certain channels are more conducive to certain types of messages. Or, perhaps there is a difference between users who are more likely to enable push notifications and those who are more likely to pay attention to in-app messages. Ultimately, running this sort of test will help you learn about how your audience interacts with your different communication channels.
Run a follow-up test on a different segment of users
To do this, create another test with the same messaging channel and variants, but choose a different segment of users. For instance, if one type of messaging was extremely effective for engaged users, it may be useful to investigate its effect on lapsed users. It’s possible that the lapsed users will respond similarly, or they may prefer another one of the other variants. This test will help you learn more about your different segments and how they respond to different types of messages. Why make assumptions about your segments when you can base your strategy on data?
Run a follow-up test based on insights from a previous test
Use the insights you gather from past tests to guide your future ones. Does a previous test hint at one messaging technique being more effective? Are you unsure about what specific aspect of a variant made it better? Running follow-up tests based on these questions will help you generate insightful findings about your users.
Compare the long-term impact of different variants
If you’re A/B testing re-engagement messages, don’t forget to compare the long-term impact of different variants using Retention Reports. You can use Retention Reports to analyze how each variant impacted any user behavior of your choice days, weeks, a month after message receipt, and see if there is uplift.