Retention reports
User retention is one of the most important metrics for any marketer. Keeping engaged users coming back for more indicates that business is healthy. Braze allows you to measure user retention right on the Analytics page of your campaign or Canvas.
Retention Reports are not available for API-triggered campaigns.
Run a retention report
Step 1: Select a date range
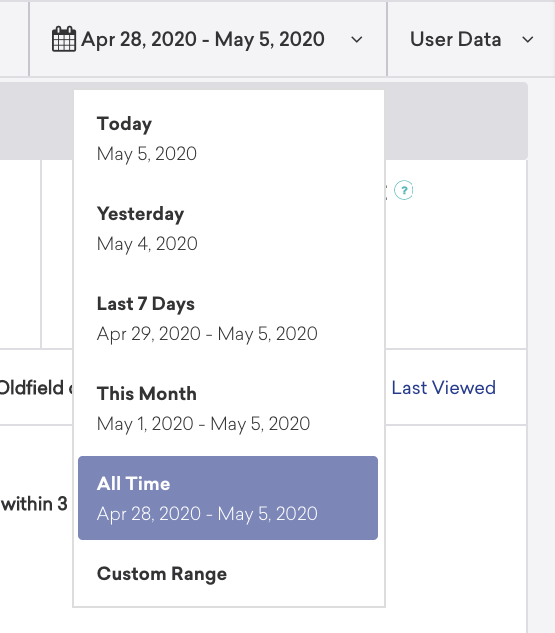
Get started by visiting any campaign or Canvas in your Braze dashboard, and select a date range for your report. Selecting an appropriate date range is crucial because of the way it affects the retention reports.
This report will include all users who initially entered the campaign or Canvas during this window, and of those users, the data of those that performed their retention event during the date range will appear in the report.
To select a date range, you must navigate to the upper right-hand corner of the campaign or Canvas Analytics page. Here you may select various ranges or set a custom range for your report.
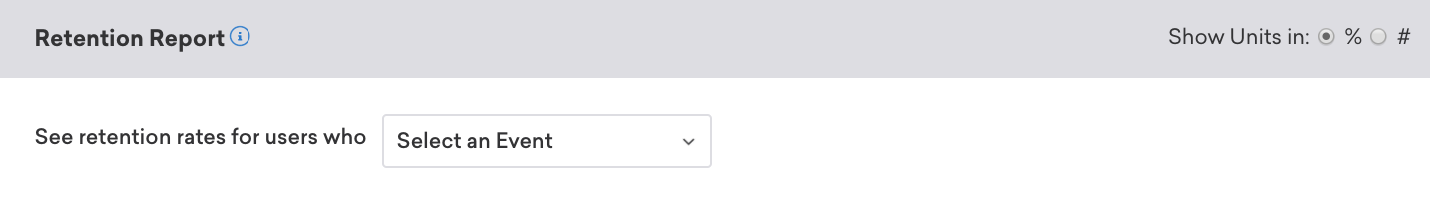
Step 2: Select a retention event
Next, scroll down to the Campaign Retention section. Campaign retention shows you the rate at which any user who has received this specific campaign has performed a retention event (specified by you on the retention report) over the 30 days from the time they received the campaign.
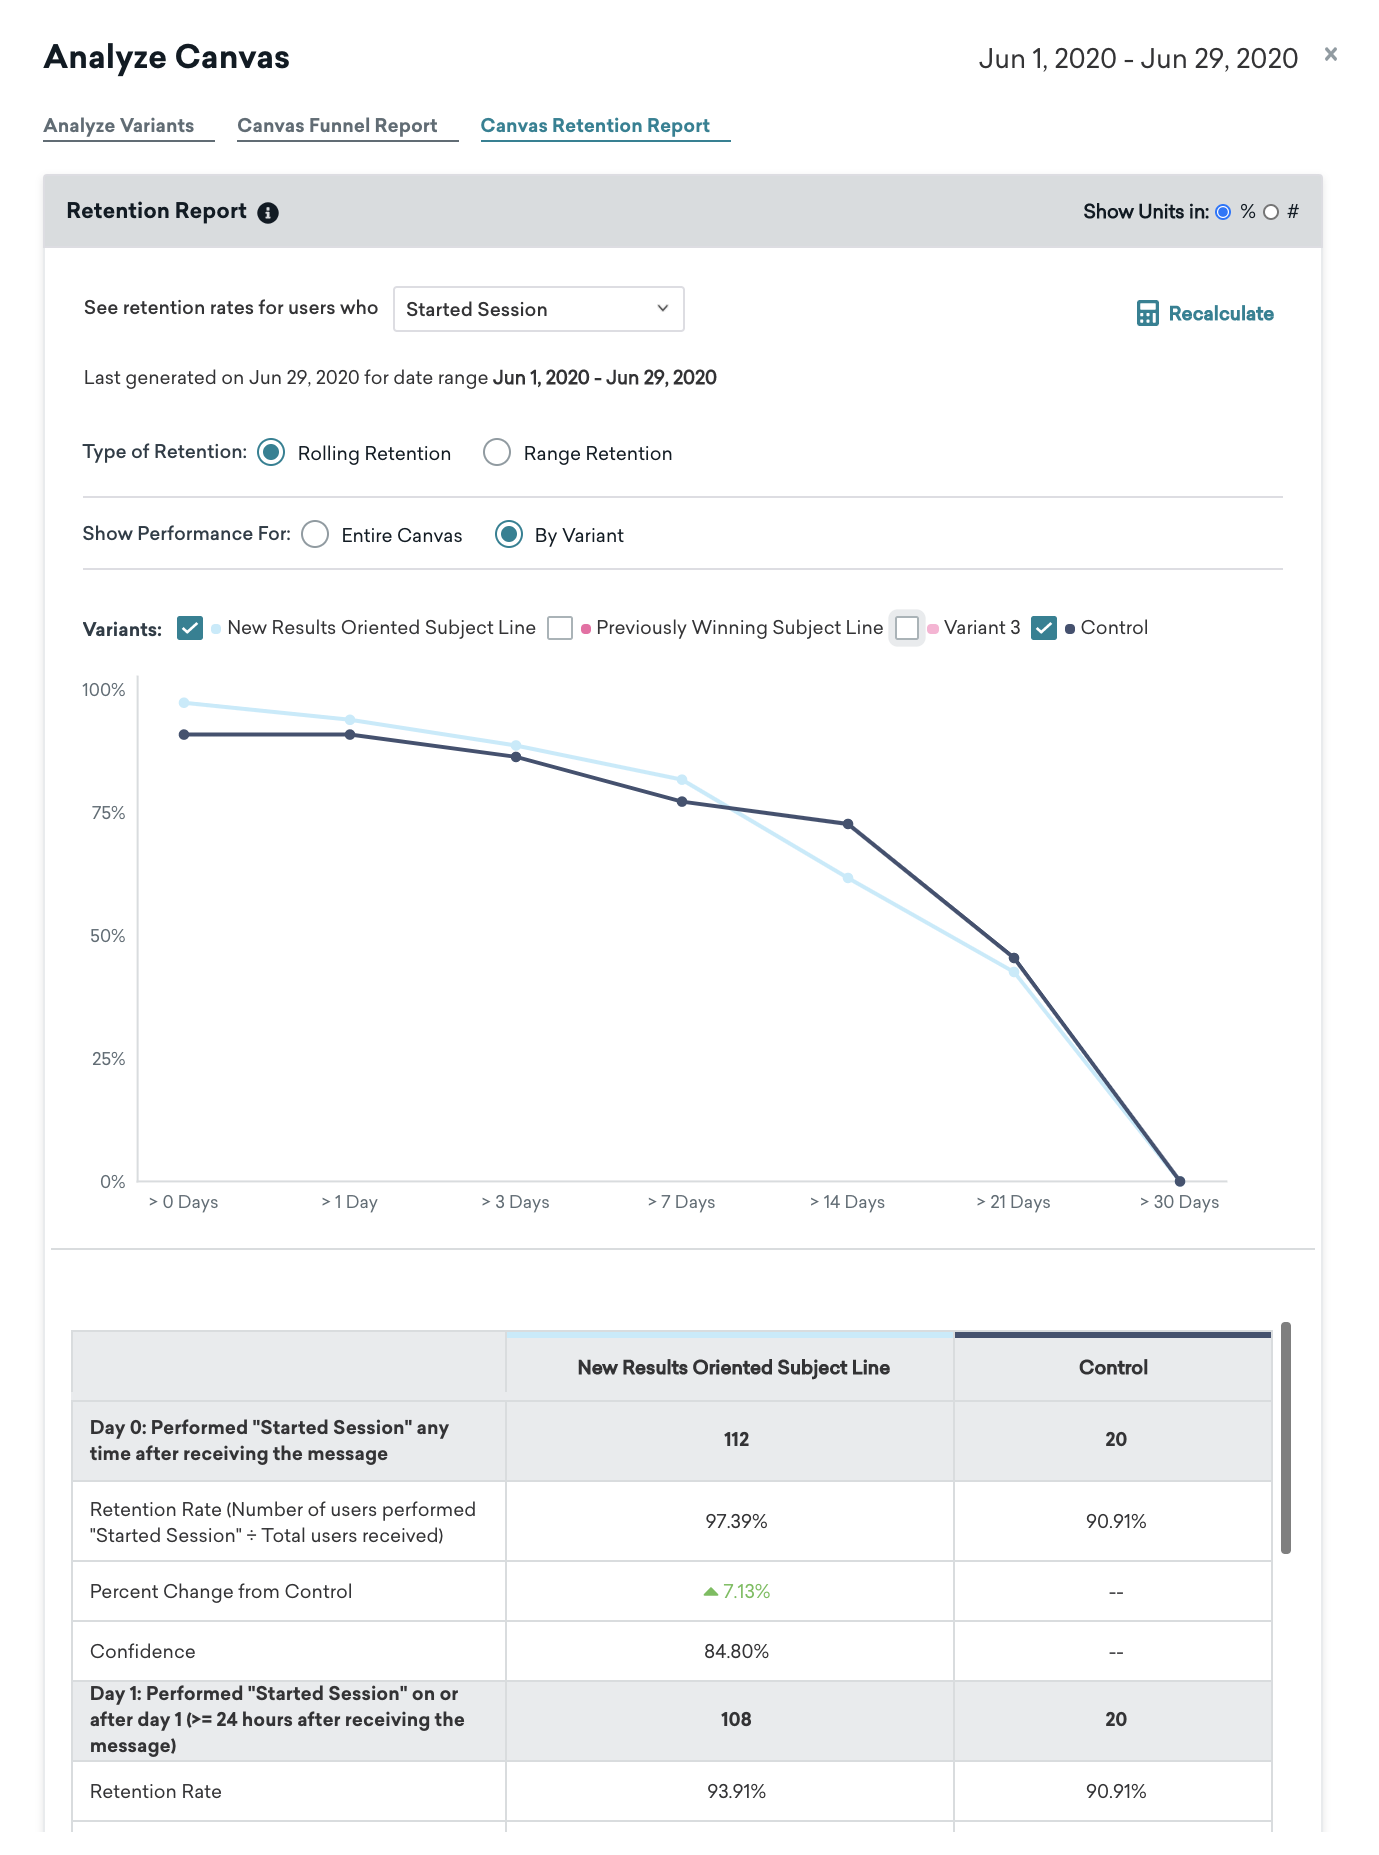
Next, click Analyze Variants at the bottom of the page. From here, you can analyze your variants, check out your funnel report, and view your retention report. Canvas retention shows you the rate at which any user who has received this specific Canvas has performed a retention event (specified by you on the retention report) over the 30 days from the time they received the Canvas.
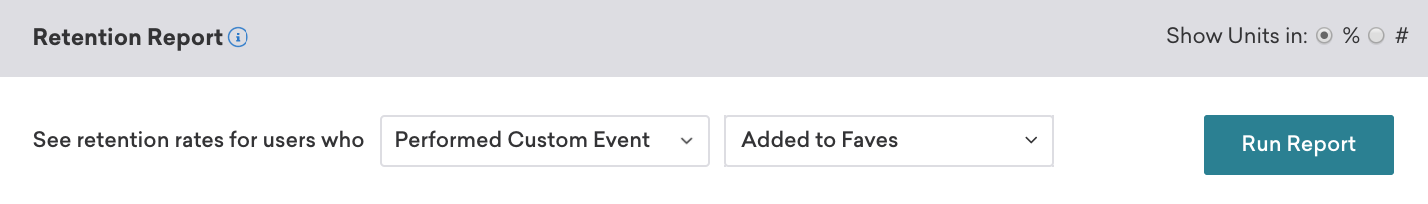
Step 3: Generate the report
Once you’ve selected a retention event, click Run Report to start the query.
This query may take a few minutes to run, depending on how much data needs to be retrieved to generate the results. If it takes too long, you’ll see a notification asking you to retry loading the report again. You may need to wait up to five minutes before the report will load.
Once the report is generated, it can’t be re-run with the same retention event for 24 hours. You will always see a timestamp of when the report was last generated, and an option to regenerate, if it’s been more than a day. You can, however, change the retention event and re-run the report to look at the impact of the campaign on different KPIs.
The report will only list days on which the campaign or Canvas was sending messages. For some campaigns and Canvases, that may mean the report only shows one day if it was only sent once. If it’s recurring or triggered, you may see multiple days in the table.
Report explanation
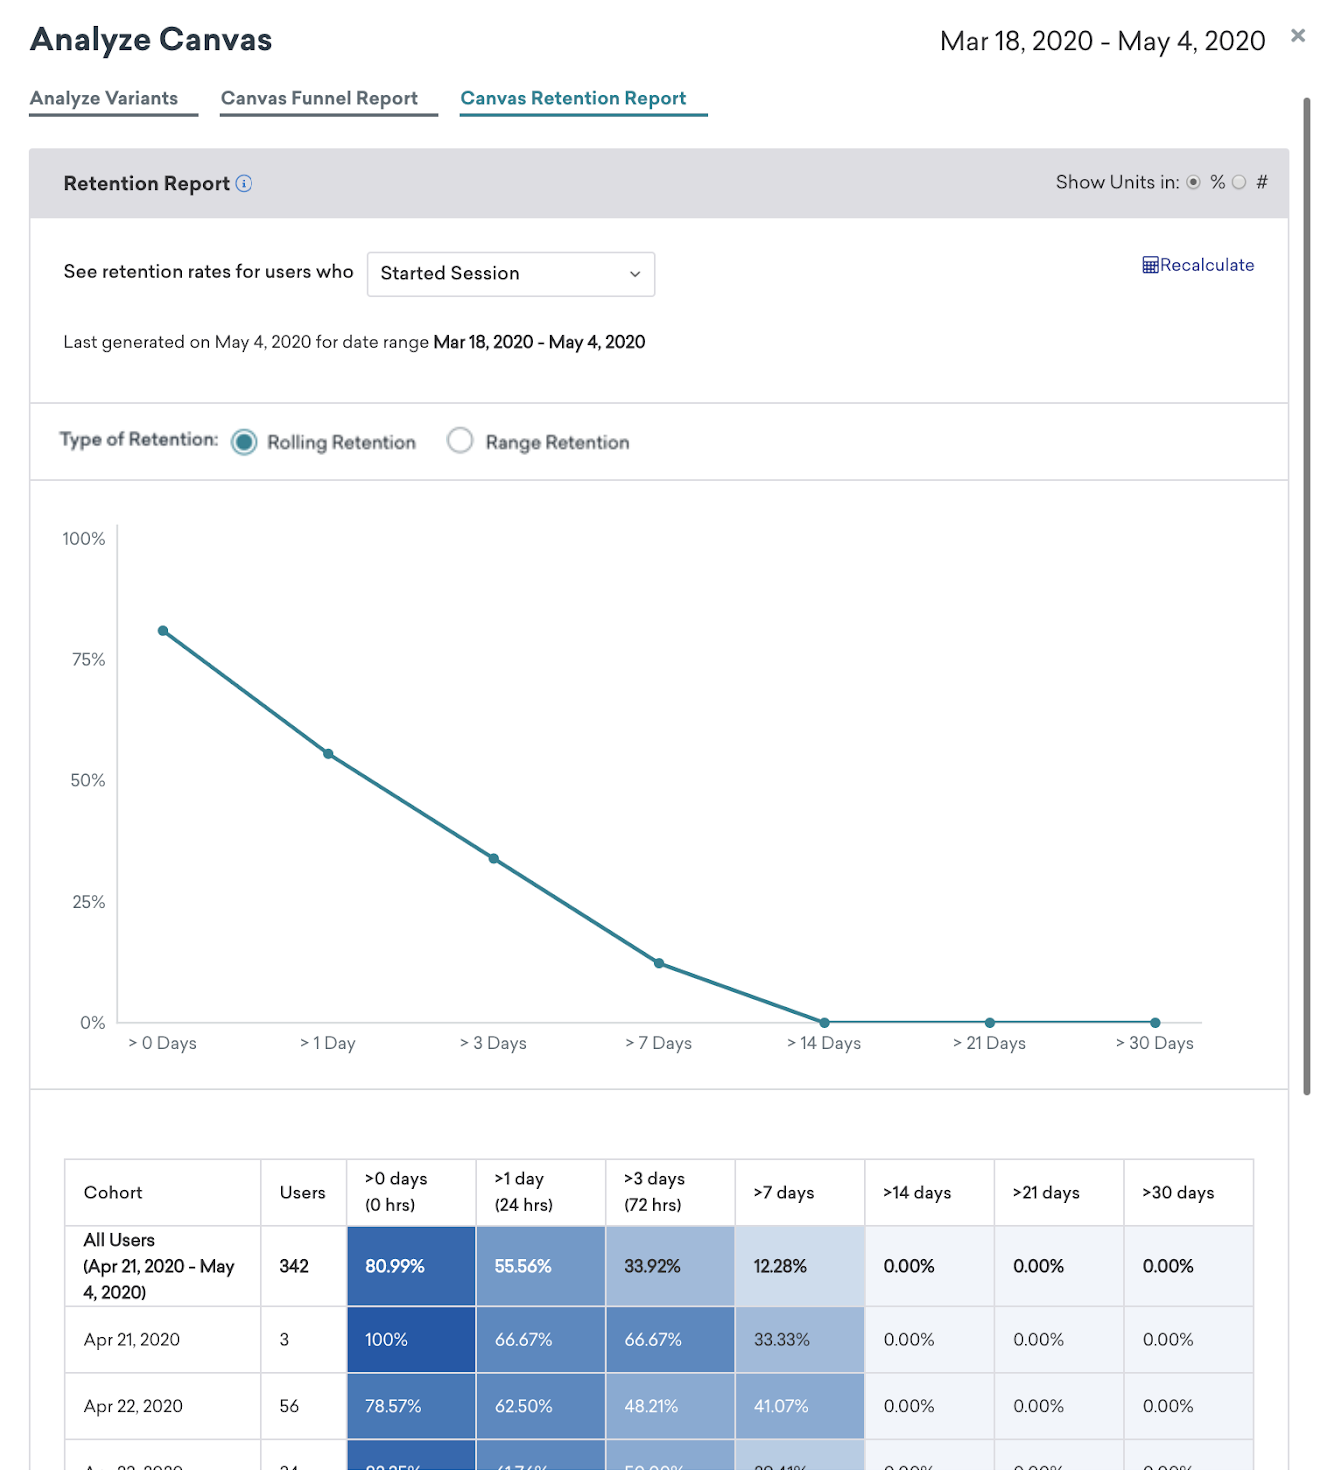
The retention report offers both a rolling retention and range retention formula. To view your campaign or Canvas report with one of these retention types, select either Rolling Retention or Range Retention for your Type of Retention.
Rolling retention
Rolling retention measures how many users come back and do the retention event on or after any of the days listed across the top of the report. So, if a user started a session between day 3 and 7, the user will be counted as retained under the “3 days”, “1 day”, and “0 days” columns. Any user who is counted as retained after the 30-day mark from when the campaign or Canvas was sent will be counted under the “30 days” column in that row.
A user who completes the event multiple times during a window of 30+ days will be counted as part of multiple time frames. For instance, a user who completes a session after 1 day will be incremented in the columns for >0 and >1. If they then complete the event after 3 days, they will again be incremented in the prior columns (>0 and >1), which could result in the retention rate exceeding 100%.
How to read rolling retention reports
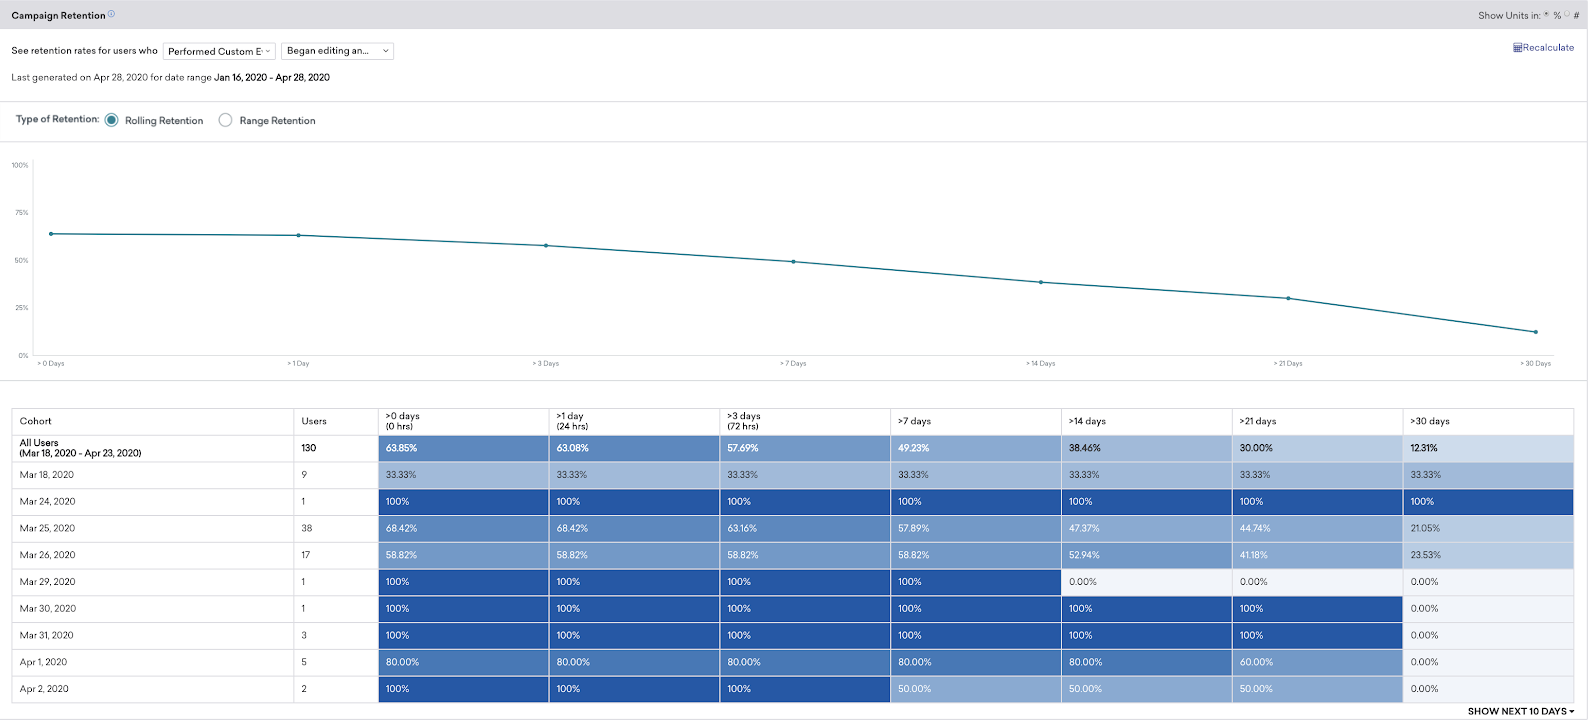
The way to read the retention report chart for a day 3 column would be Y% or Y number of users (based on units chosen) performed the event 3 or more days after receiving the campaign on day Z.
As another example, referring to the table in the preceding image, on the 25th of March, a total of 38 users performed the retention event. Day 0 retention was 68.42%, meaning that 68.42% of users performed the retention event 0 or more days (on Day 0 or later) after receiving the campaign. Day 7 retention was 57.89%, meaning 57.89% of users performed the event 7 or more days (on Day 7 or later) after receiving the campaign.
This information can be useful if you want to know the percentage of users who have and have not used your product 30+ days after first use. A percentage or number value in the day 30 column tells you the percentage of users who returned on day 30 or after.
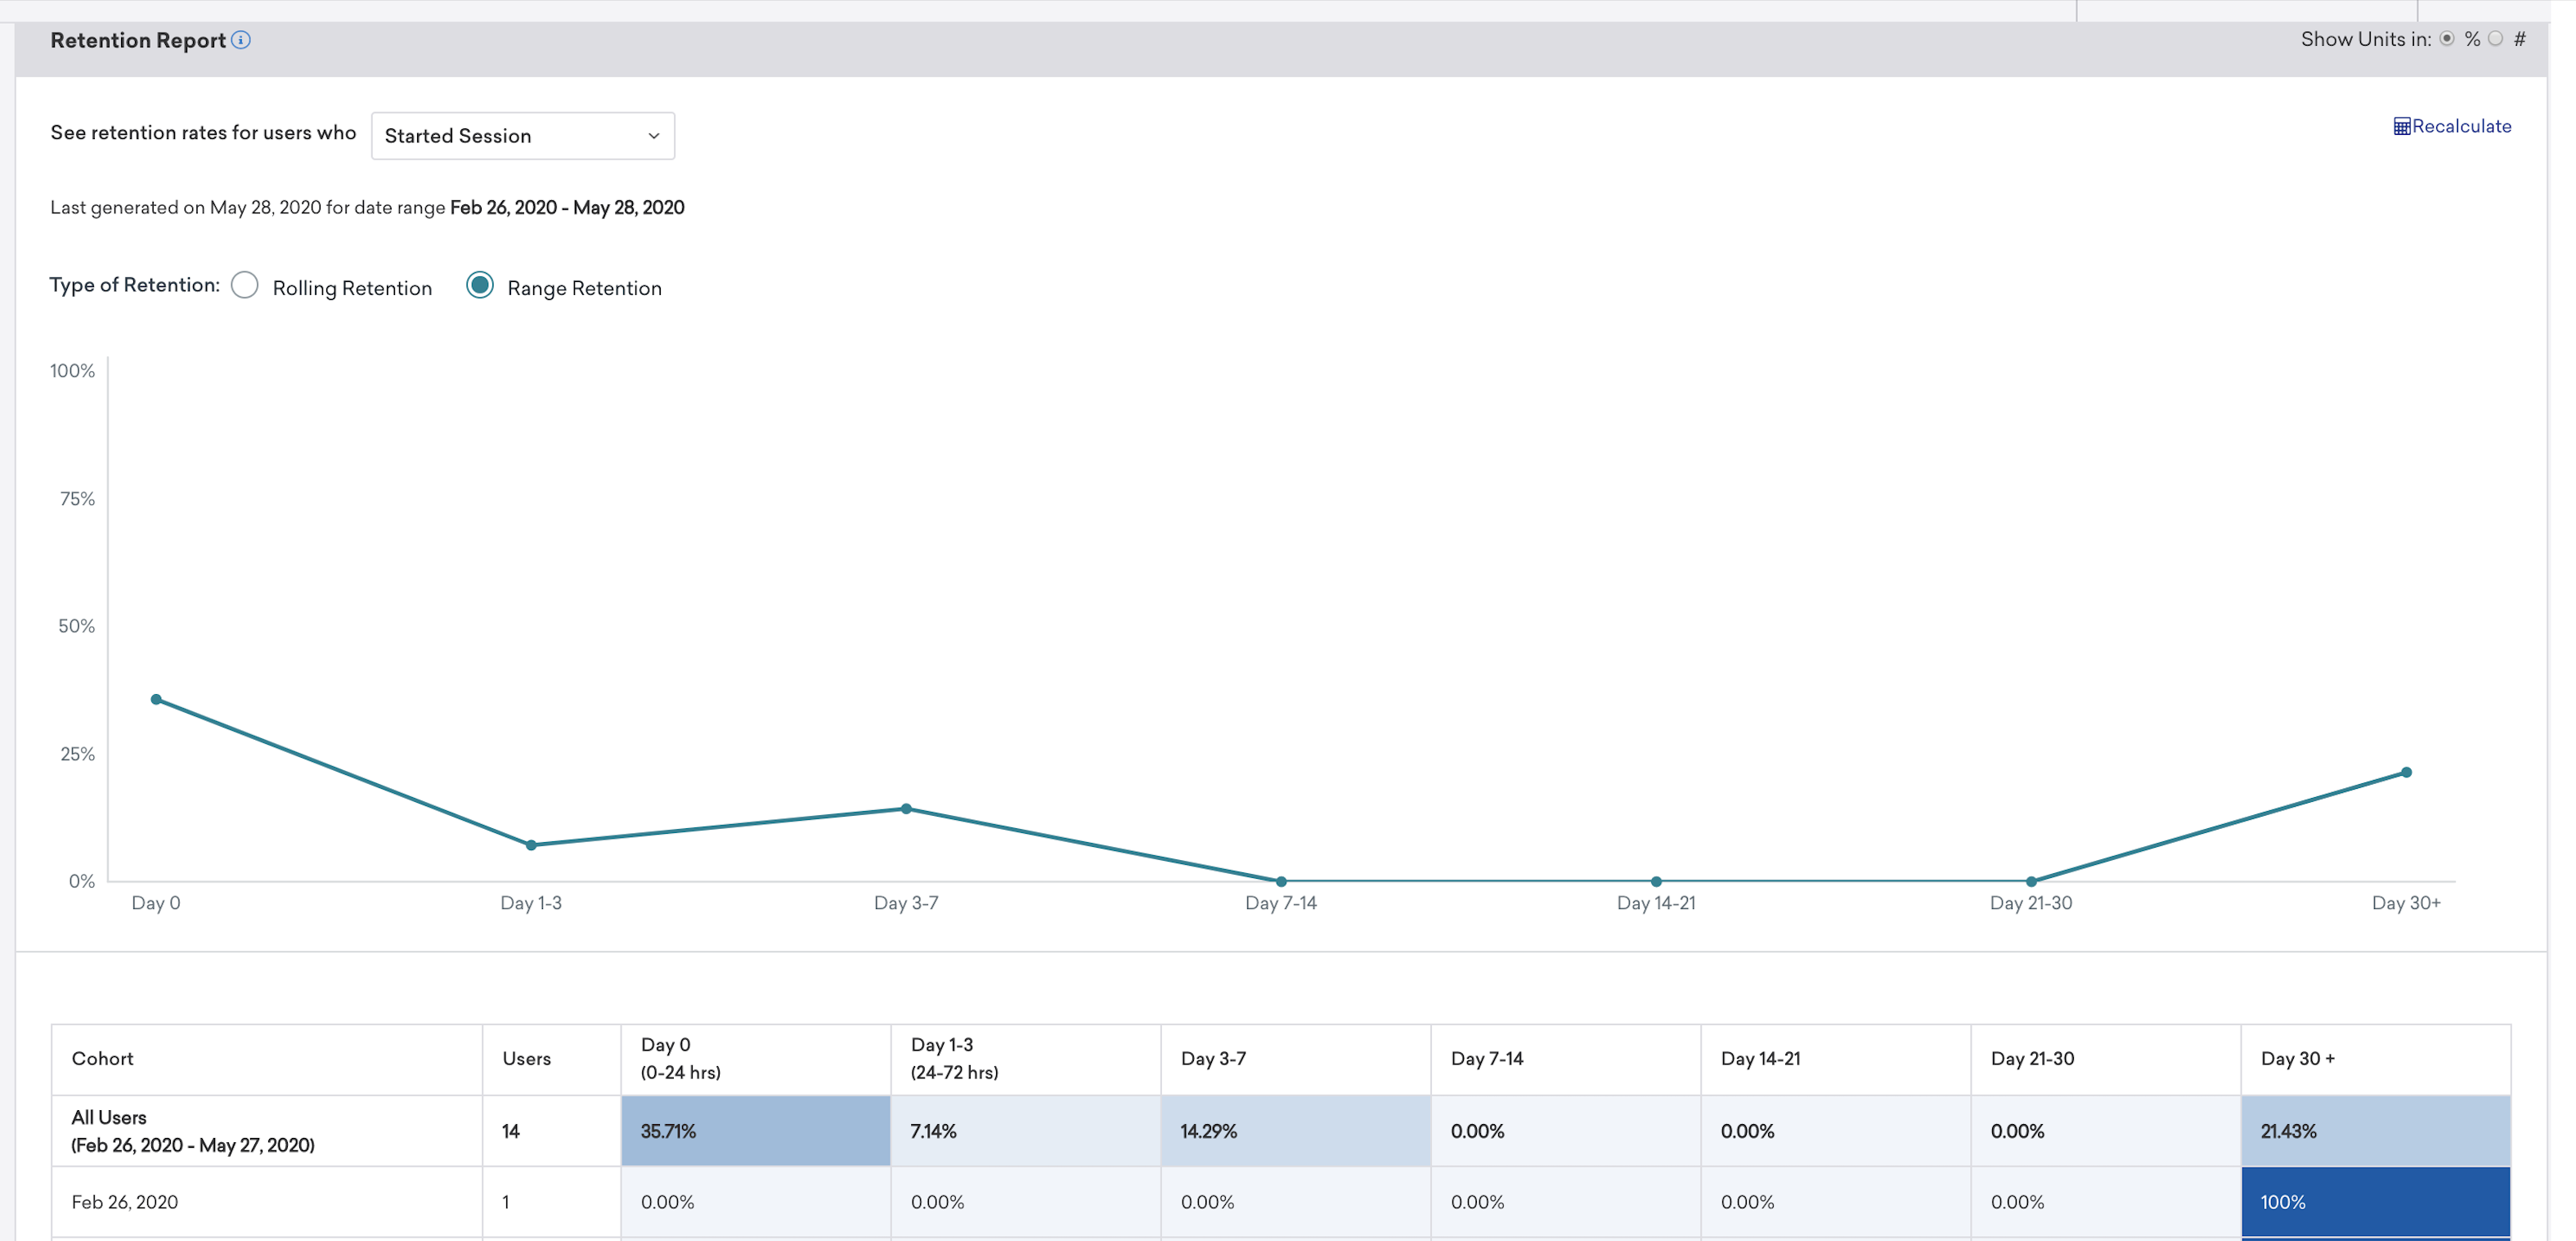
Range retention
Range retention measures how many users come back in the range of days listed across the top of the report. So, if a user started a session between days 3 and 7 and then again on day 13, they would be counted as retained under both “Day 3-7” and “Day 7-14” ranges.
How to read range retention reports
Range Reports are some of the most intuitive reports to read. They clearly state, of all the users in a cohort, what percentage of those users performed the retention event within a given date range. For example, in the following image, referencing the All Users Cohort, on date range “Day 0 (0-24hrs)”, 35.71% of the cohort performed the retention report. If a user performs multiple retention events within multiple date ranges, they will be counted as retained for each range.
Retention report components
- Users Column: The value shown is the number of unique users that performed the start action within the selected time frame; the count of users for the present day will be excluded since it is being calculated.
- Cohort Z Rows: Shows the days in which the campaign or Canvas was sending messages.
- Day X Columns: Days spanning between 0 and 30 days at various increments.
- All Users Row: Also known as the Report Summary Row, summarizes the retention data for the entire time period. Note that if a user has received the campaign or Canvas in multiple cohorts, their results will be counted twice here.
- Percentages/Numbers: Shows the percentage or number of users who performed the event X or more days after receiving the campaign or Canvas on Z day. These percentages are the weighted average percentages. Incomplete values will be denoted by an asterisk.
- Date Range: Set on the campaign or Canvas Details page, the date range includes all users who received the campaign or Canvas during this window, and of those users, the data of those that performed their retention event during the date range will appear in the report.
- Units: You can adjust the units between the percentage of users and the number of users in the upper right-hand corner of the chart, specific units may prove to be more significant when judging the impact of a campaign or Canvas.
- Color Mapping: In your retention report, higher percentages or number of users are assigned darker shades of blue. Lower percentages or number of users are assigned lighter shades of blue. This is done to help users visualize this data.
- Retention Report Graph: This graph summarizes the results for all cohorts for the selected date range.
Performance by variant
Viewing your retention report by variant allows you to compare rolling retention for each variant or message variation for the selected time period, as well as the Control Group. This report can be viewed by toggling Show Performance For to By Variant.
Some use cases for showing performance by variant:
- Have some variants or experiments in which the results seem like a wasted effort or have no statistical significance? Take another look and see if one or the other had a longer-tail impact.
- See what retention looks like if you didn’t send a message by digging into the control group’s retention data.
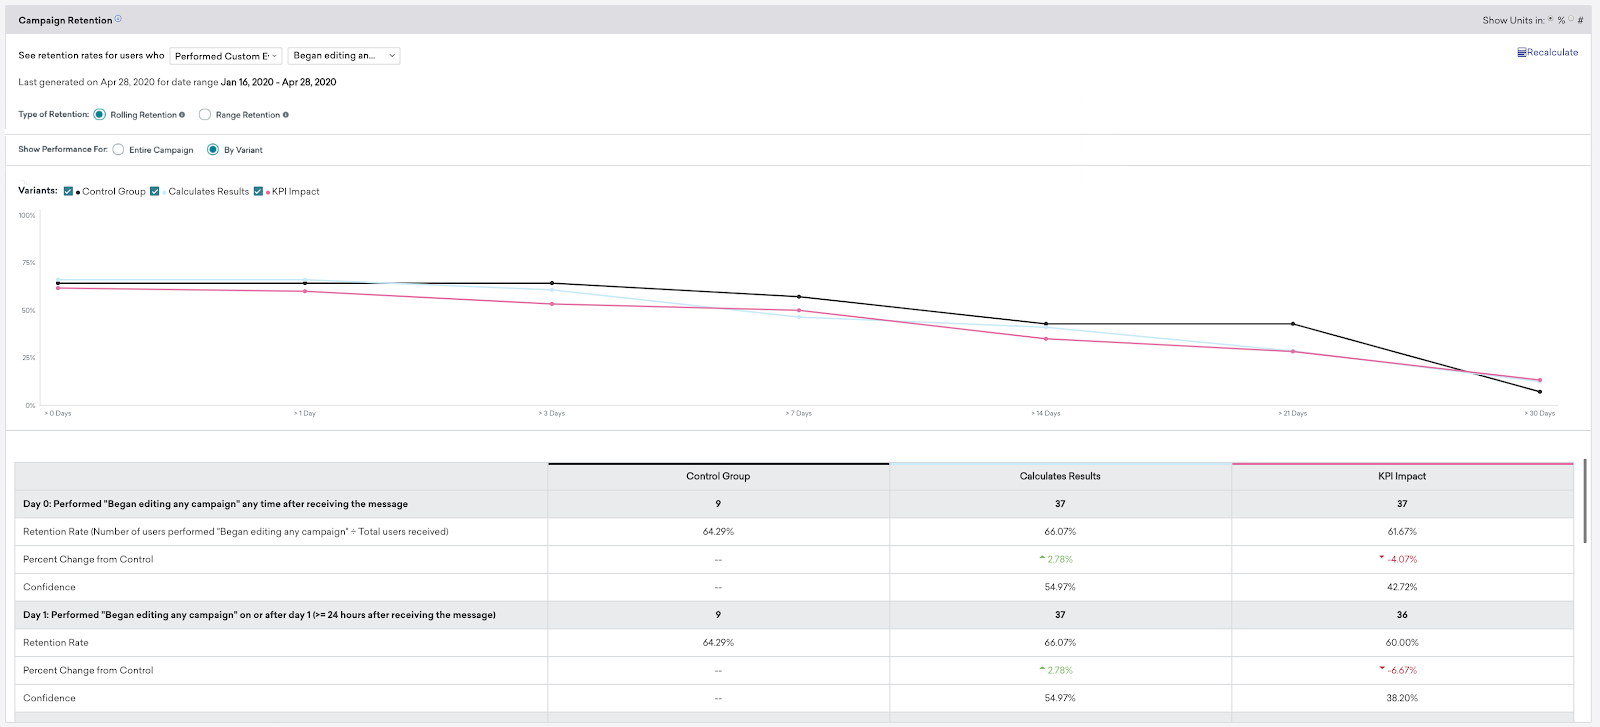
Retention report by variant components
- Date Range: Set on the Campaign or Canvas Details page, the date range includes all users who received the campaign or Canvas during this window, and of those users, the data of those that performed their retention event during the date range will appear in the report. Each day the retention rate, percentage change from the control group, and confidence are measured.
- Retention Rate: Shows the retention rate by variant. The retention rate is equivalent to the number of users that performed the retention event divided by the total users that have received the campaign or Canvas.
- Percentage Change from Control: Quantifies the percentage change per variant from the control group.
- Confidence: Braze compares each variant’s conversion rate against the control’s conversion rate with a statistical procedure called a Z Test to calculate a confidence percentage. This percentage signifies how confidently that variant is performing better than the control group.
- Units: You can adjust the units between the percentage of users and the number of users in the upper right-hand corner of the chart, specific units may prove to be more significant when judging the impact of a campaign or Canvas.
- Variant Graph: This graph summarizes the results by variant for the selected date range.
Things to look for in your retention reports
Retention Reports are easy to generate, yet challenging to interpret and act on. To help aid marketers, we have assembled a couple of topics and questions to consider when looking at your Retention Reports.
- Consider day-of-week trends for recurring campaigns (for example, Do Monday cohorts perform better than Saturday cohorts?).
- Where does the impact start to decline? This could be a signal that a new campaign or Canvas that targets users at that point in time is needed as another boost to retention.
- Are you seeing messaging fatigue?
- Did a specific optimization you make to a campaign or Canvas X days ago have a positive impact?
 Edit this page on GitHub