Reporting for SMS, MMS, and RCS
This reference article covers SMS, MMS, and RCS metrics used at Braze, as well as how to view them in your SMS, MMS, and RCS campaigns.
Viewing analytics
Once you’ve launched your campaign, you can return to the details page for that campaign to view key metrics. Navigate to the Campaigns page and select your campaign to open the details page. For SMS messages sent in Canvas, refer to Canvas analytics.

Looking for definitions for the terms and metrics listed in your report? Refer to our Report Metrics Glossary and filter by SMS/MMS and RCS.
From the Campaign Analytics tab, you can view your reports in a series of panels. You may see more or less than those listed in the following sections, but each has its own useful purpose.
Time range
By default, the time range for Campaign Analytics will display the last 90 days from the current time. This means that if the campaign was launched more than 90 days ago, the analytics will display as “0” for the given time range. To view all analytics for older campaigns, adjust the reporting time range.
Campaign details
The Campaign Details panel shows a high-level overview of the entire performance for your SMS, MMS, and RCS.
Review this panel to see overall metrics such as the number of messages sent to the number of recipients, the primary conversion rate, and the total revenue generated by this message. You can also review delivery, audience, and conversion settings from this page.

Analytics numbers in the dashboard and Snowflake may differ slightly. Braze measures numbers in the dashboard and records rows to Snowflake separately. Snowflake is the more precise data source, so if you see discrepancies between these sources, we recommend referring to Snowflake data.

Estimated Audience and Current Audience
Depending on how large your workspace is, the Campaign Details panel may label audience statistics Estimated Audience or Current Audience.
The following table summarizes what each label means.
| Footer label | When it is used |
|---|---|
| Estimated Audience | Braze does not run a full-database count by default. Audience size is estimated from a sample and extrapolated, similar to the Reachable users range in the segment builder. Margins of error are expected, especially for large workspaces or small segments as a share of the workspace. |
| Current Audience | Braze can compute the default statistic with a full scan of workspace profiles, so the displayed audience size is a current, unsampled count (still subject to channel reachability, subscription rules, and other targeting options). |
For details on sampling behavior, Calculate exact statistics, and segmenting Reachable users, see Measure segment size.
Control groups
To measure the impact of an individual SMS, MMS, or RCS message, you can add a control group to an A/B test. The top-level Campaign Details panel doesn’t include metrics from the Control Group variant.
Changes Since Last Viewed
The number of updates to the campaign from other members of your team is tracked by the Changes Since Last Viewed metric on the campaign overview page. Select Changes Since Last Viewed to view a changelog of updates to the campaign’s name, schedule, tags, message, audience, approval status, or team access configuration. For each update, you can see who performed the update and when. You can use this changelog to audit changes to your campaign.
SMS/MMS/RCS Performance
The SMS/MMS/RCS Performance panel outlines how well your message has performed across various dimensions. The metrics in this panel vary depending on your chosen messaging channel, and whether or not you are running a multivariate test. You can click on the Preview icon to view your message for each variant or channel.
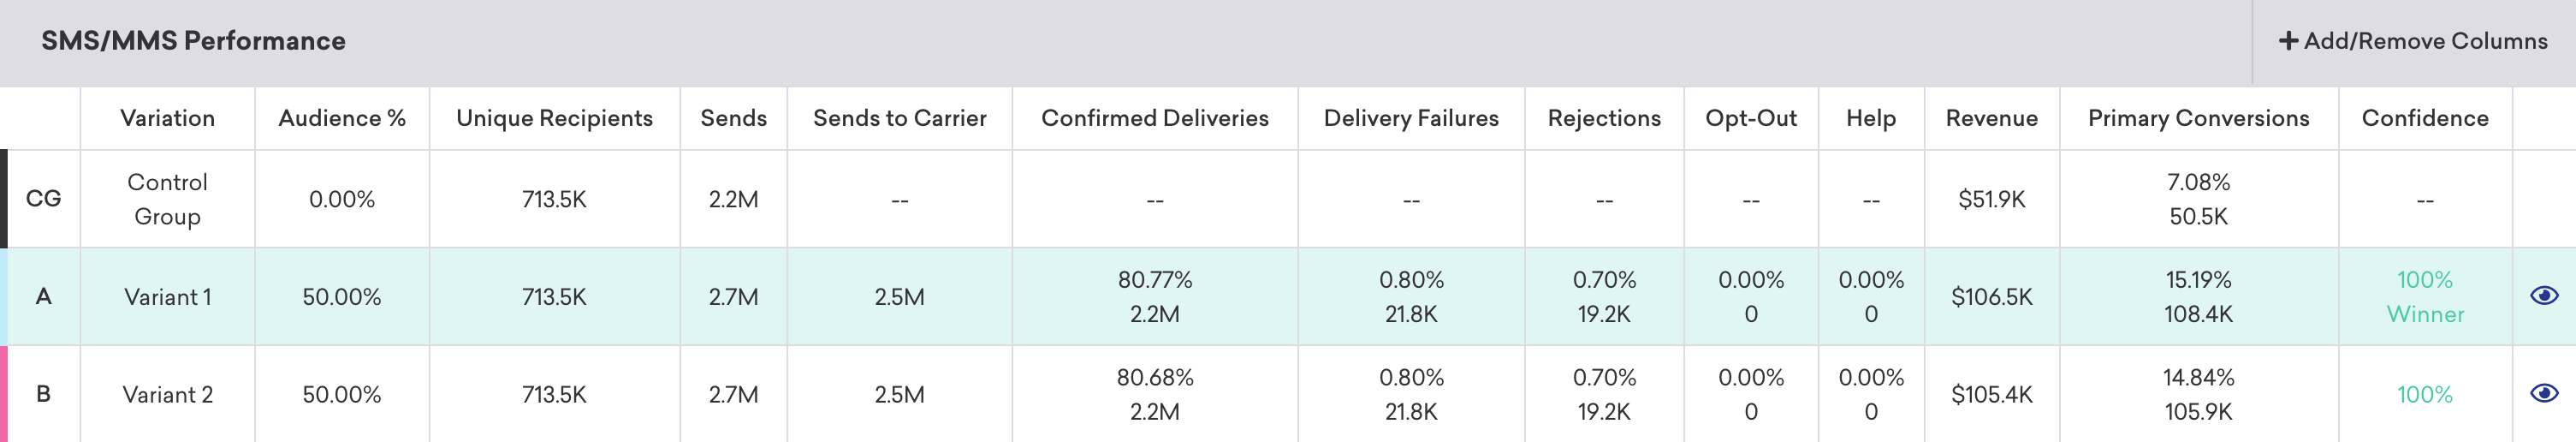
If you want to simplify your view, click Add/Remove Columns and clear any metrics as desired. By default, all metrics are displayed.
SMS, MMS, and RCS metrics
Here is a breakdown of some key metrics you may see while reviewing your message performance. For the full definitions of all SMS, MMS, and RCS metrics, refer to the Report Metrics Glossary and filter by SMS/MMS and RCS.
| Metric | Definition |
|---|---|
| Sent | Sent is every time a campaign or Canvas step has been launched or triggered, and an SMS or RCS has been sent from Braze. It's possible that the SMS or RCS didn't reach a user's device due to errors. |
| Delivery Failures | Delivery Failures are when the SMS couldn't be sent because of queues overflowing (sending SMS at a rate higher than your long or short codes can handle). |
| Confirmed Delivery | Confirmed Deliveries are when the carrier has confirmed the message was delivered to the target phone number. |
| Rejections | Rejections are when the SMS or RCS has been rejected by the carrier. This can happen for several reasons, including carrier content filtering, availability of the destination device, the phone number is no longer in service, and similar. |
| Opt-Out | Opt-Out is when a user replied to your message with an opt-out keyword and was unsubscribed from your SMS or RCS program. |
| Help | Bounces is the total number of messages that were unsuccessfully delivered to the intended recipients. |
| Total Clicks | Total Clicks is the number (or percentage) of unique recipients who clicked on a link in the delivered message. |
Historical performance
The Historical Performance panel allows you to view the metrics from the Message Performance panel as a graph over time. Use the filters at the top of the panel to modify the stats and channels shown in the graph. The time range of this graph will always mirror the time range specified at the top of the page.
To get a day-by-day breakdown, click the hamburger menu and select Download CSV to receive a CSV export of the report.

Keyword responses
The Keyword Responses panel shows you a timeline of the inbound keywords users replied with after receiving your message.

Here, you can also view the response distribution of each keyword category to determine next steps for retargeting and to conveniently create a segment.

Conversion event details
The Conversion Event Details panel shows you the performance of your conversion events for your campaign. For more information, refer to Conversion Events.

Conversion correlation
The Conversion Correlation panel gives you insight into what user attributes and behaviors help or hurt the outcomes you set for campaigns. For more information, refer to Conversion correlation.

SMS Currents events
Like email, Braze receives user-level events related to an SMS message as it makes its journey to a user. Any inbound SMS event will also be sent as a Currents event through the SMS InboundReceived event. This allows you to perform additional actions or reporting on the messages your users are texting in outside of the Braze platform.
Inbound messages are truncated past 1,600 characters.
Retention report
Retention reports show you the rates at which your users have performed a selected retention event over time periods in a specific campaign or Canvas. For more information, refer to Retention reports.
Funnel report
Funnel reporting offers a visual report that allows you to analyze the journeys your customers take after receiving a campaign or Canvas. If your campaign or Canvas uses a control group or multiple variants, you will be able to understand how the different variants have impacted the conversion funnel at a more granular level and optimize based on this data.
For more information, refer to Funnel reports.
Track SMS opt-ins and opt-outs
You can track SMS opt-ins and opt-outs with the following methods:
| Method | Description |
|---|---|
| Segmenter | The segmenter displays the number of users in a specific Subscription Group. It does not deduplicate by phone number—if multiple users share the same phone number, each instance is counted separately. |
| Subscription group timeseries | Provides a daily snapshot of subscriptions for email and phone numbers. The timeseries counts subscriptions, unsubscribes, and resubscribes. For example, if a user subscribes, unsubscribes, and then resubscribes, they are counted as one subscribed user. |
| Currents | Use Currents to export subscription and engagement events for your own reporting. |
The Opt-In and Opt-Out statistics in the SMS/MMS/RCS Performance panel reflect users opting in or out through inbound keywords (for example, texting “START” for opt-in or “STOP” for opt-out). These numbers are typically lower than what is shown in the segmenter, as they count the number of times these keywords were texted, not the total number of users subscribed to SMS.
Track SMS campaign opt-outs
Track SMS opt-outs at the campaign level by using the inbound receive table instead of the subscription group state change table. For example, in Query Builder or your data warehouse, you can run a query that references the USERS_MESSAGES_SMS_INBOUNDRECEIVE or USERS_MESSAGES_SMS_INBOUNDRECEIVE_SHARED table.
This example query references the USERS_MESSAGES_SMS_INBOUNDRECEIVE table:
1
2
3
4
5
6
SELECT *
FROM USERS_MESSAGES_SMS_INBOUNDRECEIVE
WHERE app_group_id = 'app-group-id'
AND subscription_group_api_id = 'subscription_group_api_id'
AND action = 'Unsubscribed'
AND (campaign_id IS NOT NULL OR canvas_id IS NOT NULL);
This returns users who opted out of SMS communications for the given workspace and subscription group, filtered to those associated with campaigns or Canvases.
Opt-out timing
Keyword and inbound-message events in Currents or your data warehouse, such as timestamps on users.messages.sms.InboundReceive or subscription group state change events, are the authoritative source for when Braze recorded the opt-out.
Event timestamps reflect when Braze received or processed the inbound message, not necessarily when the user sent the SMS or when a carrier or SMS provider received it. If your analysis treats opt-outs as when Braze processed the inbound opt-out path, these timestamps match that definition.
The user profile shows current subscription state but may not surface a single “SMS unsubscribed at” field unless you set a custom attribute or similar when processing opt-outs.
Charges applied to SMS sending outcomes
This table reflects Braze billing, not your provider’s billing. Outcomes that are not charged by Braze may be charged by your provider.
| Outcome | Definition | Charged by Braze |
|---|---|---|
| Sent | A campaign or Canvas step has launched or triggered, and an SMS payload has been sent to the SMS provider. | No charge |
| Delivery Failed | The SMS payload couldn’t be sent to the SMS provider. This can occur due to overflowing queues, suspended accounts, or media errors (in the case of MMS). | No charge |
| Delivered | The SMS provider received confirmation of message delivery from the upstream carrier (and, where available, from the destination device). | Charge |
| Rejected | The SMS provider received a rejected receipt indicating that the message wasn’t delivered. This can happen for several reasons, including carrier content filtering or availability of the destination device. | Charge |
| Sent to Carrier |
Sends to Carrier is deprecated, but will continue to be supported for users that already have it. It’s the sum of Confirmed Deliveries, Rejections, and Sends where delivery or rejection wasn’t confirmed by the carrier. This includes instances where carriers don’t provide delivery or rejected confirmation, as some carriers don’t provide this confirmation or can’t do so at the time of send.
| Charges may apply based on individual message sending outcomes |
Reconcile Rejections with Snowflake or Currents
The Rejections metric in the dashboard is an aggregate workspace count. It isn’t a row-level export, so you can’t always match each rejection to a single row in Snowflake or a single users.messages.sms.Rejection event in Currents. For example, if the user profile was deleted before Braze finished processing the rejection for warehouse export, that rejection doesn’t appear in your USERS_MESSAGES_SMS_REJECTION_SHARED table or Currents payload, while aggregate SMS reporting can still reflect the outcome. For more information, see the SQL table reference and SMS Rejection events in the Currents event glossary.