Conversions dashboard
The conversions dashboard allows you to analyze conversions across campaigns, Canvases, and channels, using different attribution methods. When measuring your conversions, you can specify the time frame, conversion event, and conversion window.
Setting up your report
To set up your conversions dashboard report:
- Navigate to Analytics > Conversions.
- Select a Date Range for your report, up to a 90-day window.
- Select the campaigns or Canvases (or both) that you would like to analyze.
- If you would like to filter campaigns and Canvases by tag, select a Tag.
- Select the Channel(s) you would like to analyze for your messages.
- (optional) If desired, select a Breakdown layer. This allows you to view different dimensions of data, such as by variant, Canvas step, country, or language.
- (optional) If you are interested in calculating conversions of an event that was not set up as a conversion event on the campaign or Canvas, turn on Use custom events.
- Select an Attribution Method through which to analyze the selected messages.
If you are analyzing conversions for multiple channels, your Attribution Method will default to Last-Touch Attribution.
- Click Create to run the report.
After the page has loaded, select a Conversion Event to filter the report for conversion data. The available selections will include the events that were pre-configured on the Canvases and campaigns. If you selected a custom event when setting up your report (step 6), this option is not available.
Using custom events
If you are interested in calculating conversions of an event that was not set up as a conversion event on the campaign or Canvas, you can select a specific custom event to use as a conversion event.
- When setting up your report, turn on Use custom events.
- Select a custom event that you would like to use as the conversion event.
- Select the conversion window within which that event should have occurred to be counted as a conversion.
If you select a custom event, you will not see the Conversion Event dropdown on the page and will have to re-run to report to view conversions for different custom events.
Understanding your results
Your report is split into three sections:
Conversion details
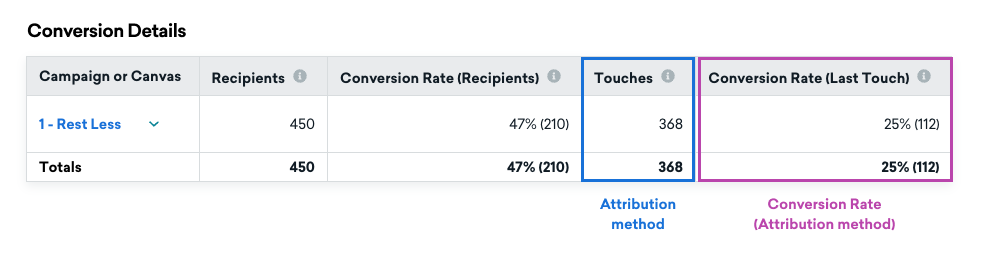
The conversion details table will always show one column for Recipients and another for Conversions (rate and total). The remaining two table columns that appear depend on the options you selected when setting up your report. The following table describes possible metrics.
| Metric shown | Description |
|---|---|
| Recipients | The number of users who received a message through the selected channel within the report’s date range |
| Conversion Rate (Recipients) | Calculated as: (Number of conversions) / (Number of recipients) |
| Attribution method | Defined by the attribution method you selected when you set up the report. For Last Touch attribution or if multiple channels are selected, this appears as Touches. |
| Conversion Rate (Attribution method) | Defined by the attribution method you selected when you set up the report. If multiple channels are selected, this defaults to last-touch attribution. |
If you selected breakdown-level details for campaigns or Canvases when setting up your report (step 5), you can click to expand the table.
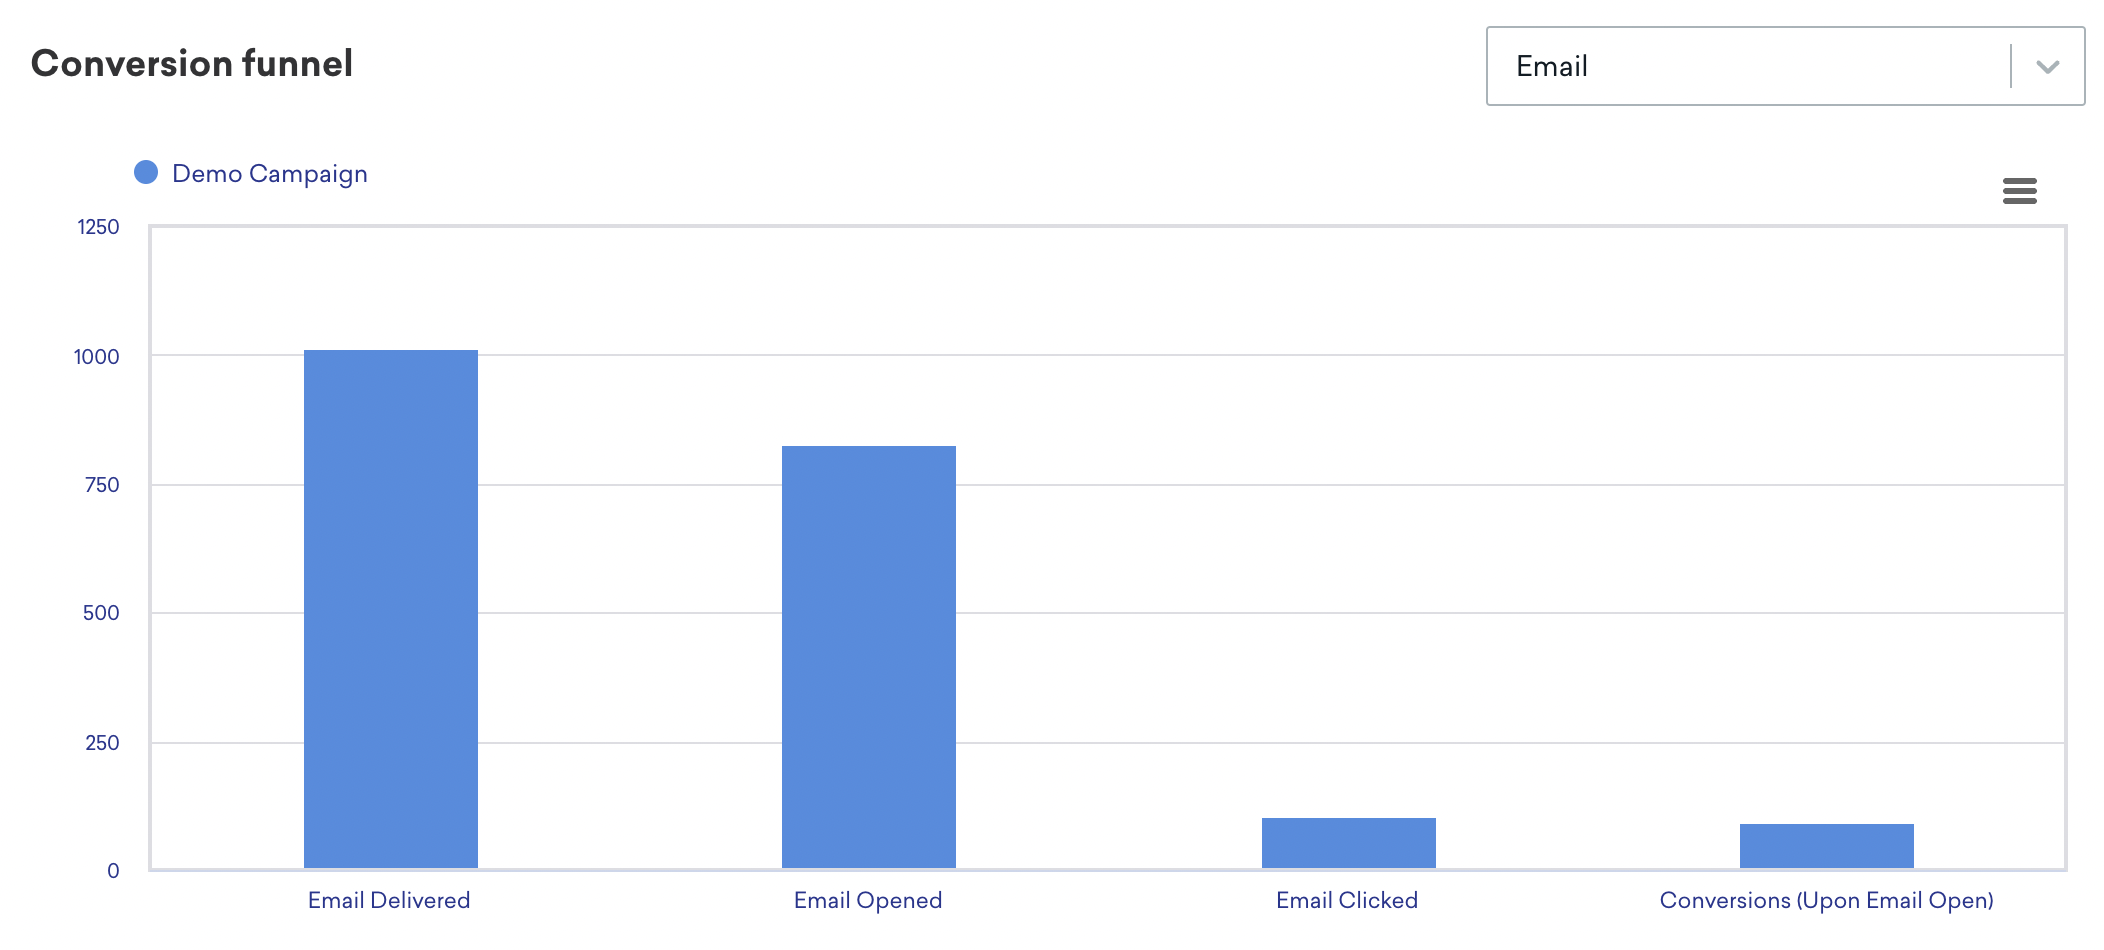
Conversion funnel
This bar graph shows the absolute counts for each engagement event based on the selected channel. The conversions count will be defined as per the selected attribution method.
By default, all selected campaigns and Canvases are shown. To deselect a campaign or Canvas, click on the name of the campaign or Canvas that you’d like to exclude. For additional details on the engagement event, you can hover over each bar.
To download the time series data, click and select your download option. Available options are PNG, JPEG, PDF, SVG, or CSV.
This graph only shows data for a single channel at a time. Use the Channel dropdown on the chart to select a single channel.
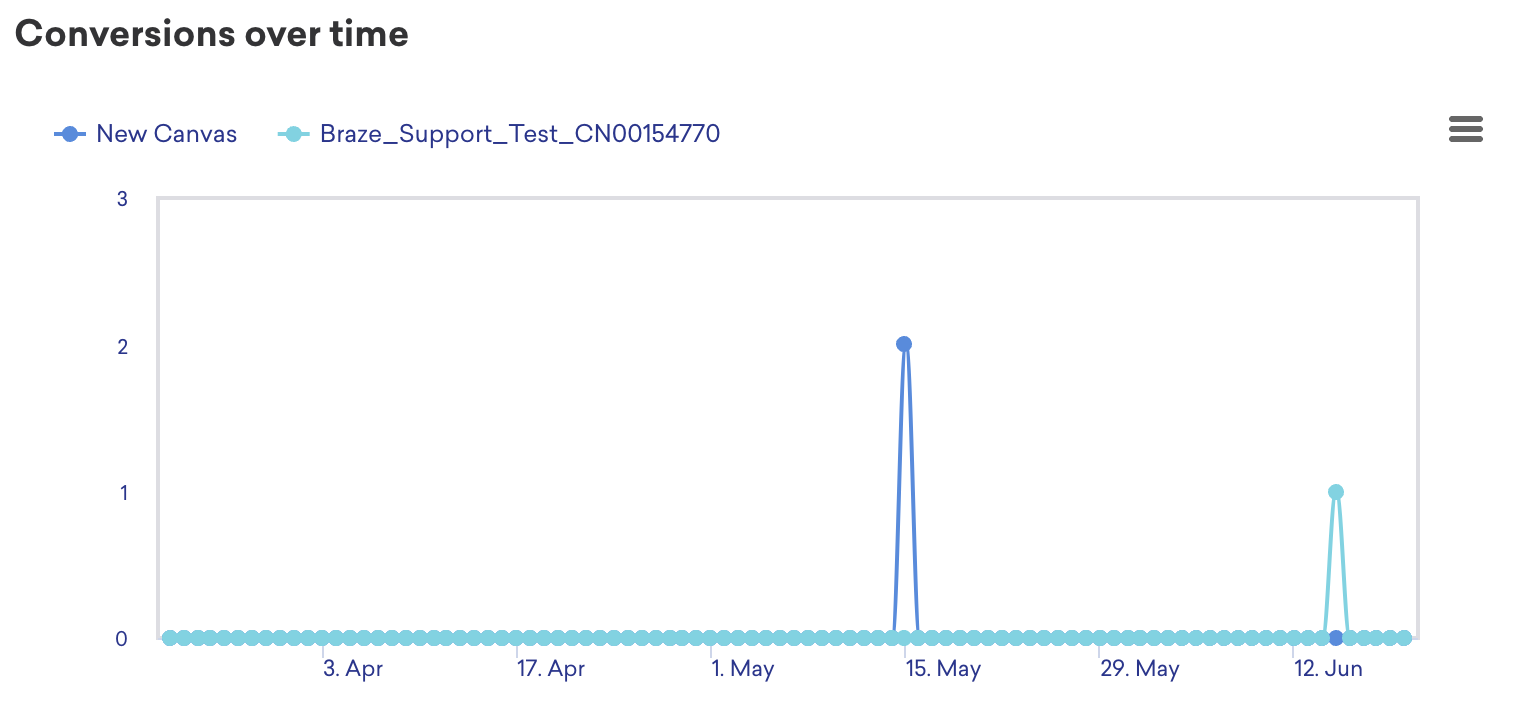
Conversions over time
This time series graph includes a representation of the conversions per campaign or Canvas over time. By default, all selected campaigns and Canvases are shown. To deselect a campaign or Canvas, click on the name of the campaign or Canvas that you’d like to exclude.
To download the time series data, click and select your download option. Available options are PNG, JPEG, PDF, SVG, or CSV.
Attribution methods
| Attribution method | Definition | Rate calculation | Channel-specific options |
|---|---|---|---|
| Upon Receipt | Total number of conversions that occurred after message receipt | Calculated as (Unique Received Conversions) / (Unique Recipients) |
|
| Upon Send | Total number of conversions that occurred after message send | Calculated as (Unique Send Conversions) / (Unique Recipients) |
|
| Upon Open | Total number of conversions that occurred after message open | Calculated as (Unique Open Conversions) / (Unique Recipients) |
|
| Upon Click | Total number of conversions that occurred message click | Calculated as (Unique Click Conversions) / (Unique Recipients) |
|
| Upon Impression | Total number of conversions that occurred after an impression | Calculated as (Unique Impression Conversions) / (Unique Recipients) |
|
| Upon Last-Touch | Conversions that give all credit to the last-touched or clicked message during the conversion window. | Calculated as (Number of Touches) / (Unique Recipients) | Last-touch attribution is automatically selected if multiple channels are added to the report. |
Terms to know
| Term | Definition |
|---|---|
| Touch | A physical interaction or touchpoint with a message. Touches can include:
|
 Edit this page on GitHub