Webhook reporting
Learn about the different webhook reporting metrics and analytics options provided in the Braze dashboard.
Viewing analytics
Once you’ve launched your campaign, you can return to the details page for that campaign to view key metrics. Navigate to the Campaigns page and select your campaign to open the details page. For messages sent in Canvas, refer to Canvas analytics.

Looking for definitions for the terms and metrics listed in your report? Refer to the Report Metrics Glossary and filter by your channel. For email-specific definitions, see the Email Analytics Glossary.
From the Campaign Analytics tab, you can view your reports in a series of panels. You may see more or less than those listed in the following sections, but each has its own useful purpose.
Time range
By default, the time range for Campaign Analytics will display the last 90 days from the current time. This means that if the campaign was launched more than 90 days ago, the analytics will display as “0” for the given time range. To view all analytics for older campaigns, adjust the reporting time range.
Campaign details
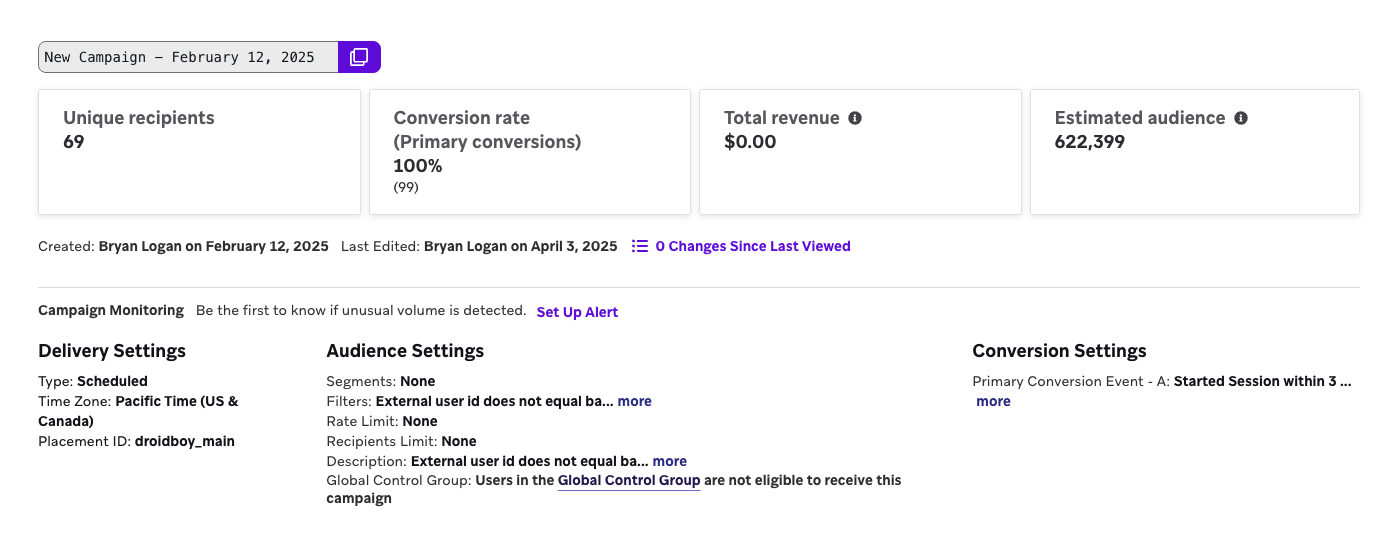
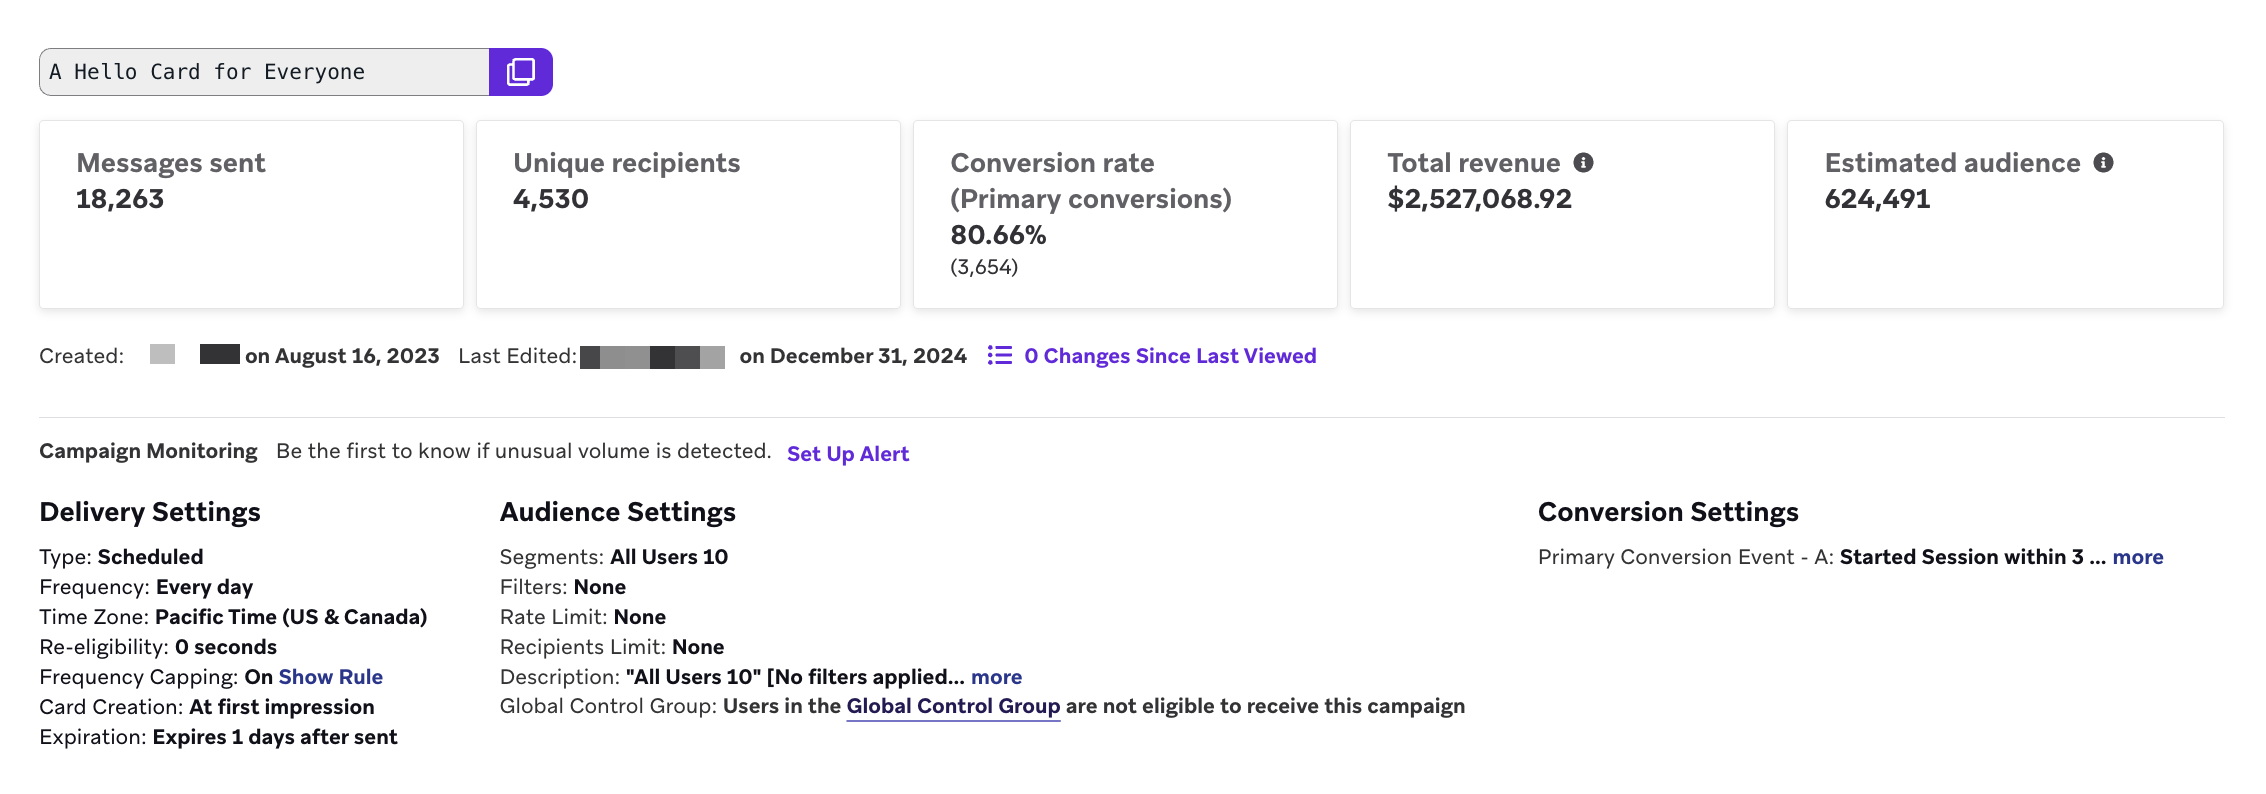
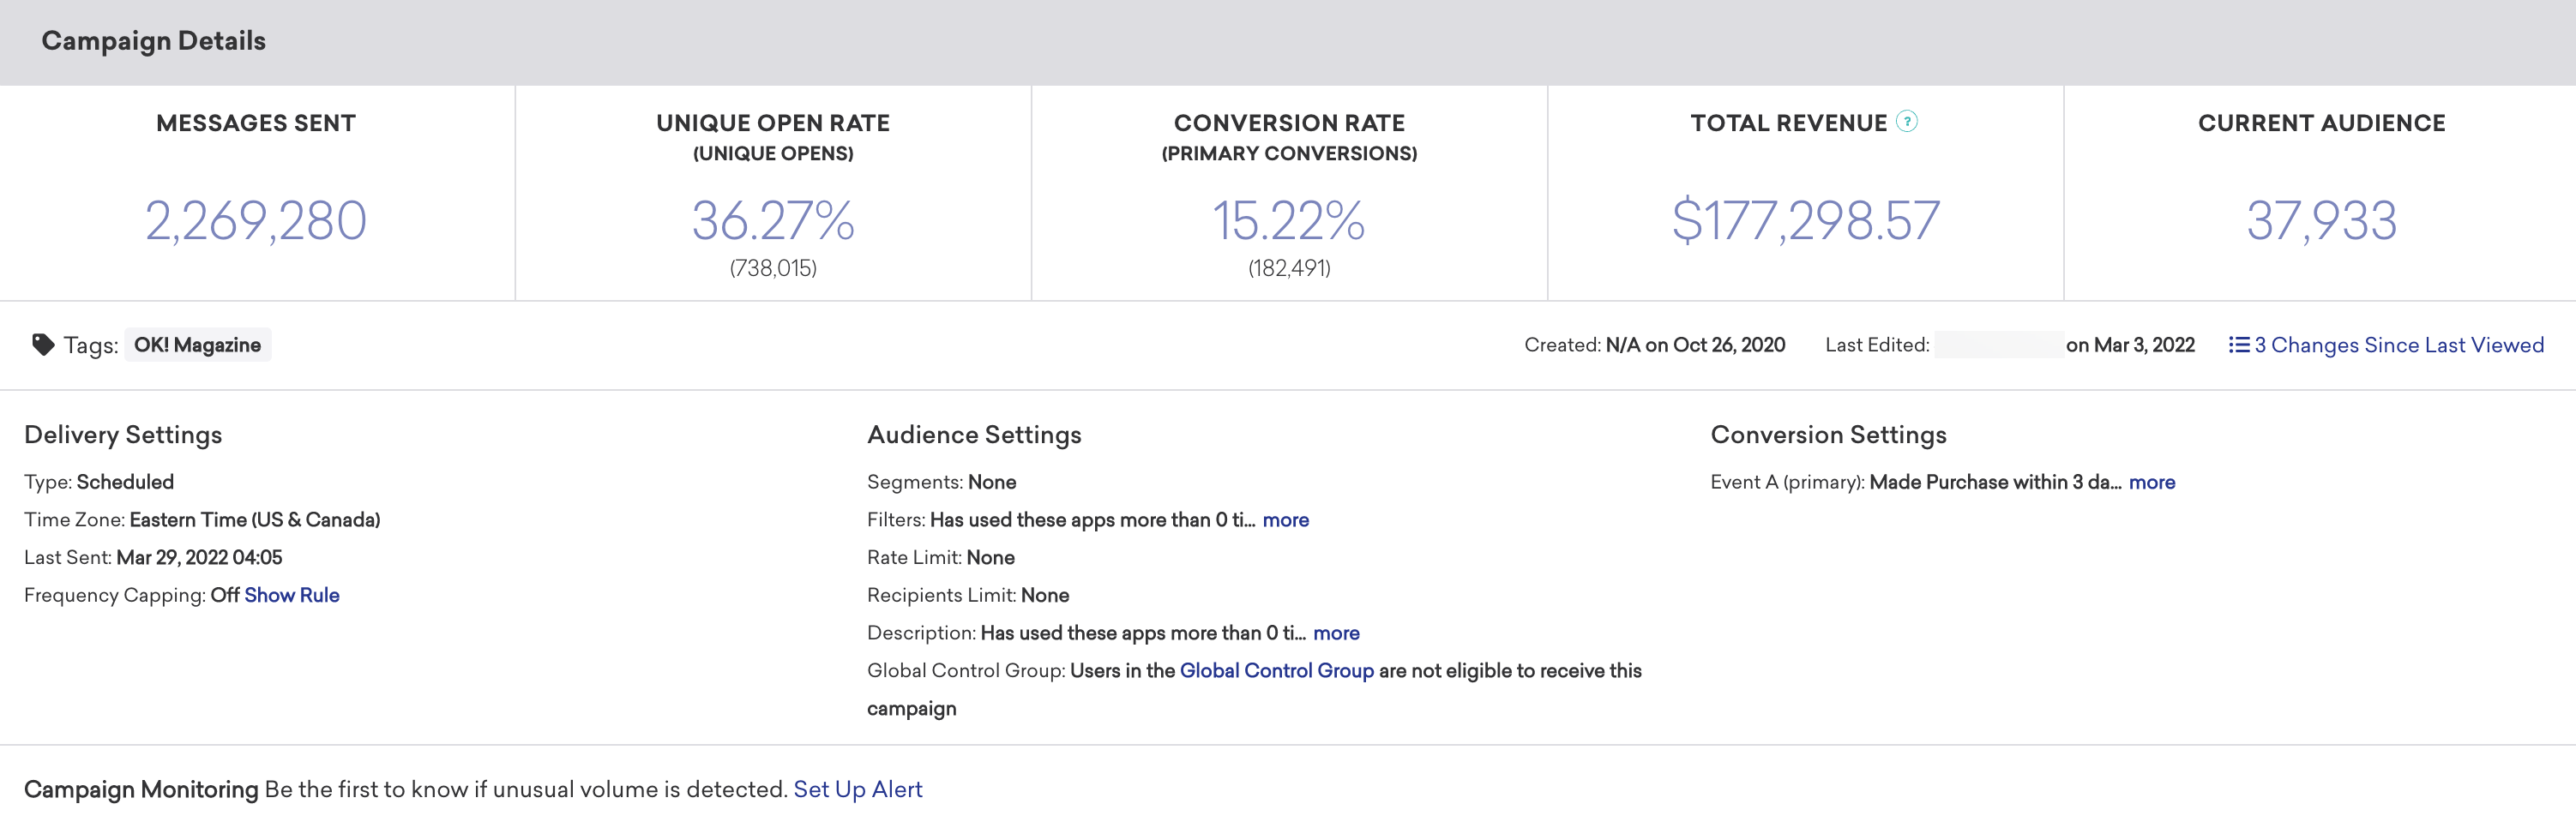
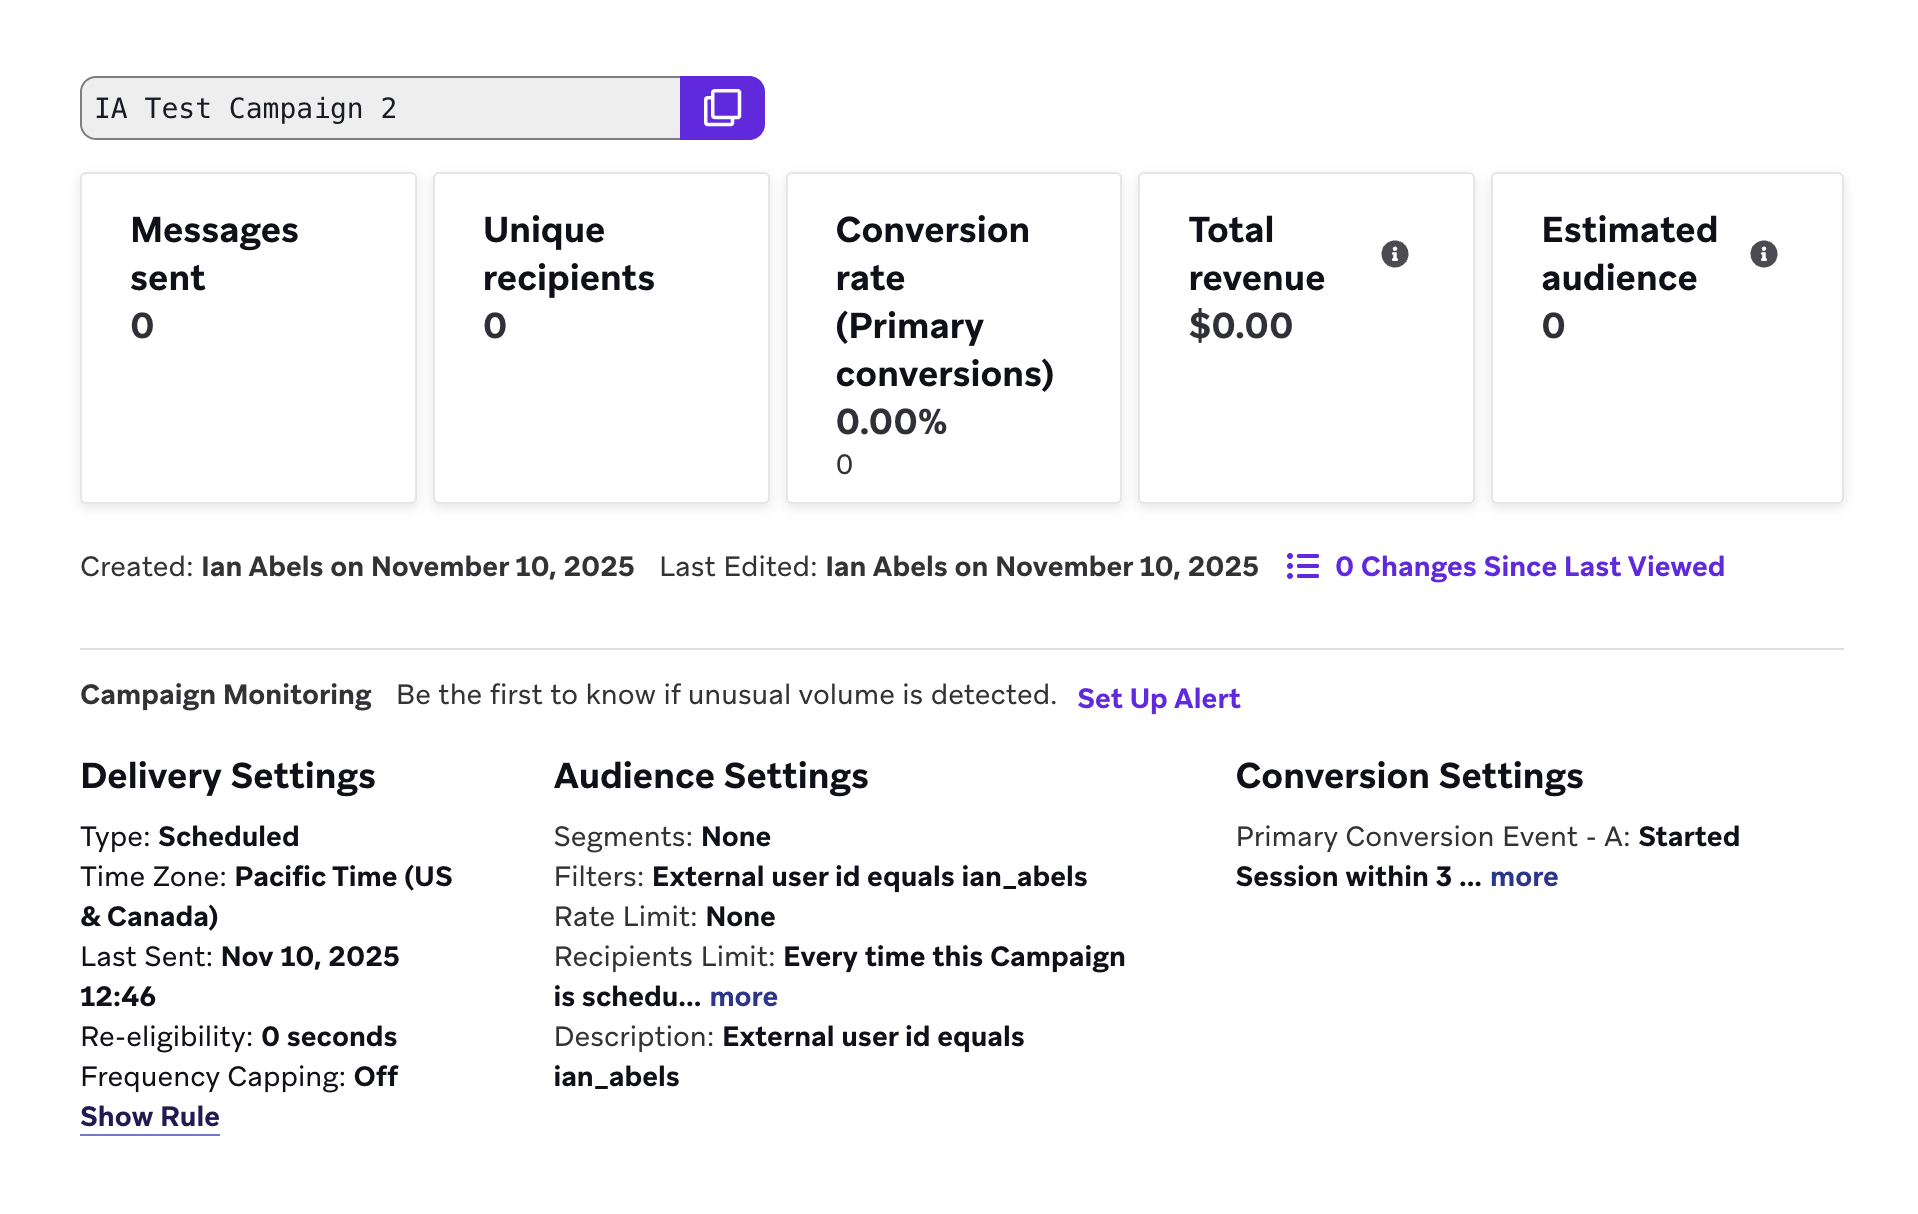
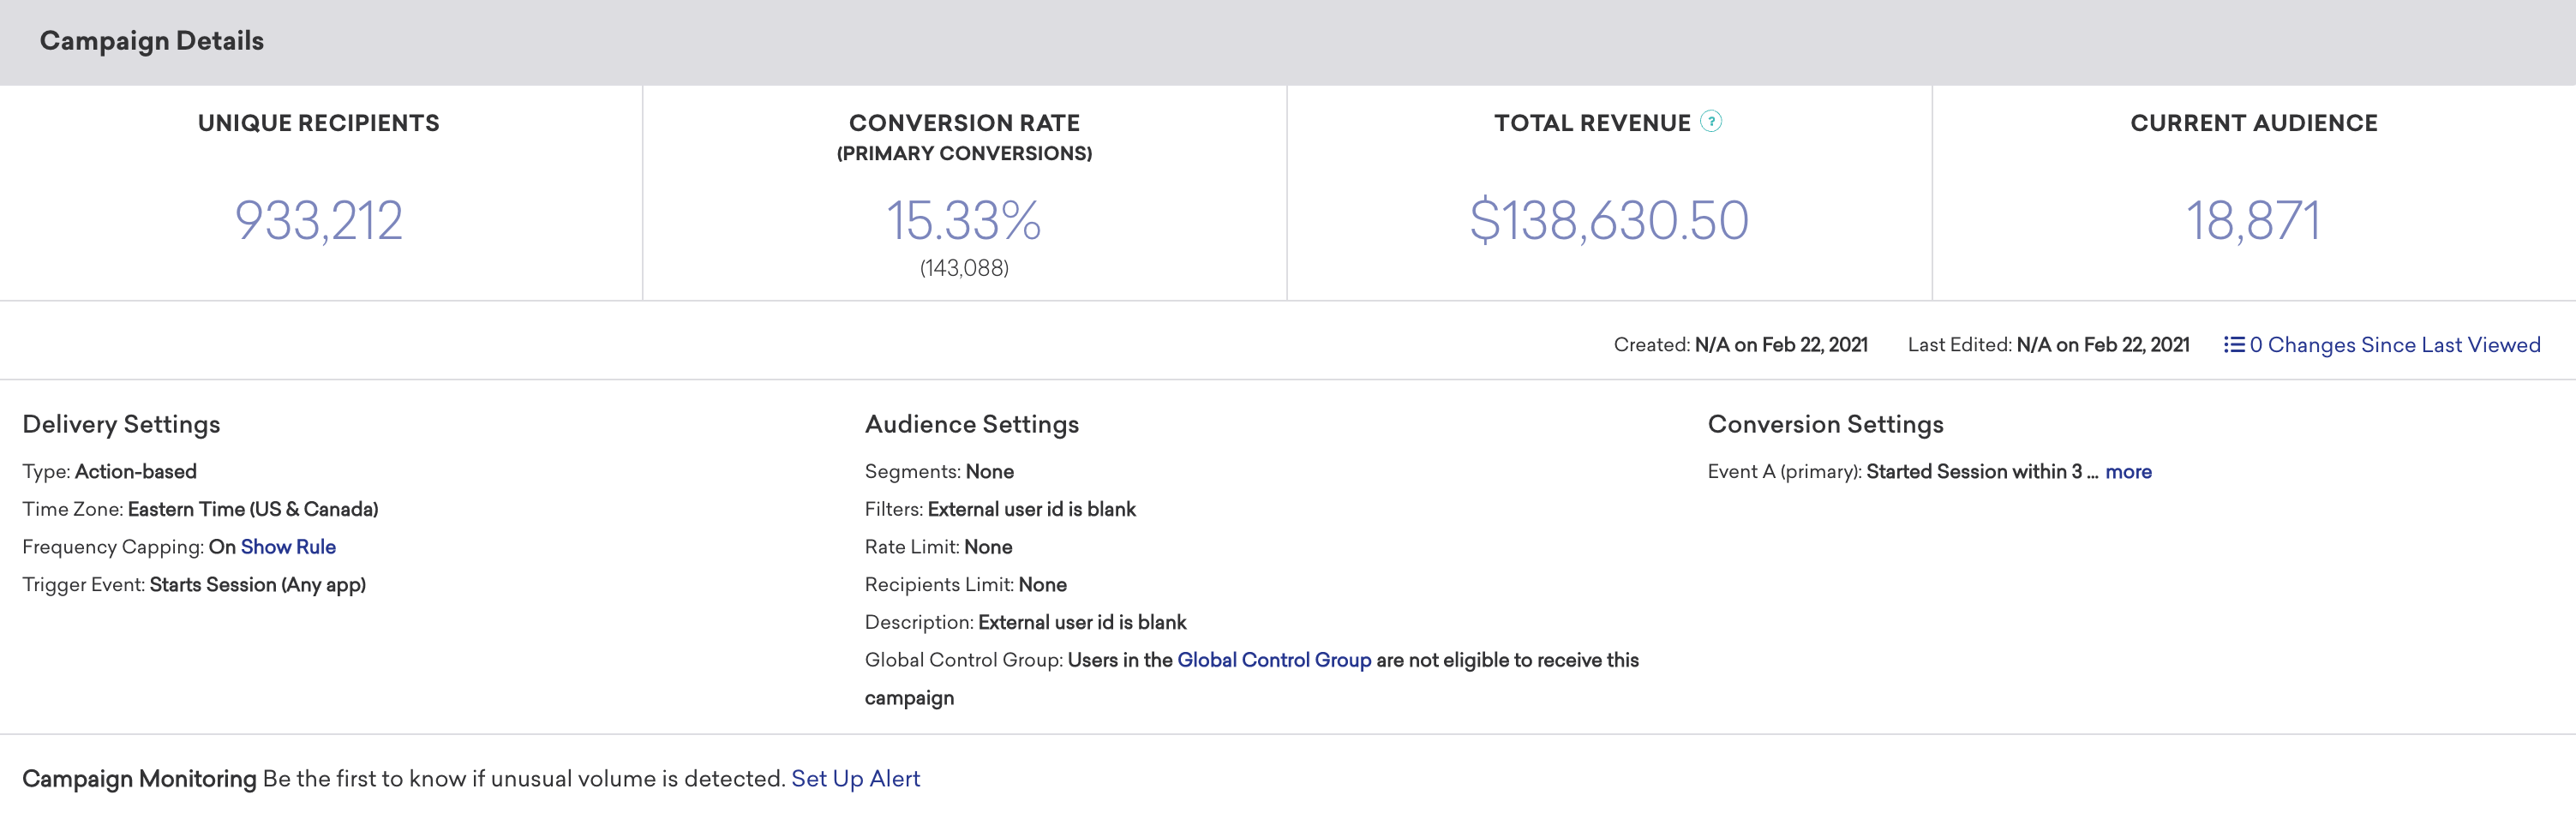
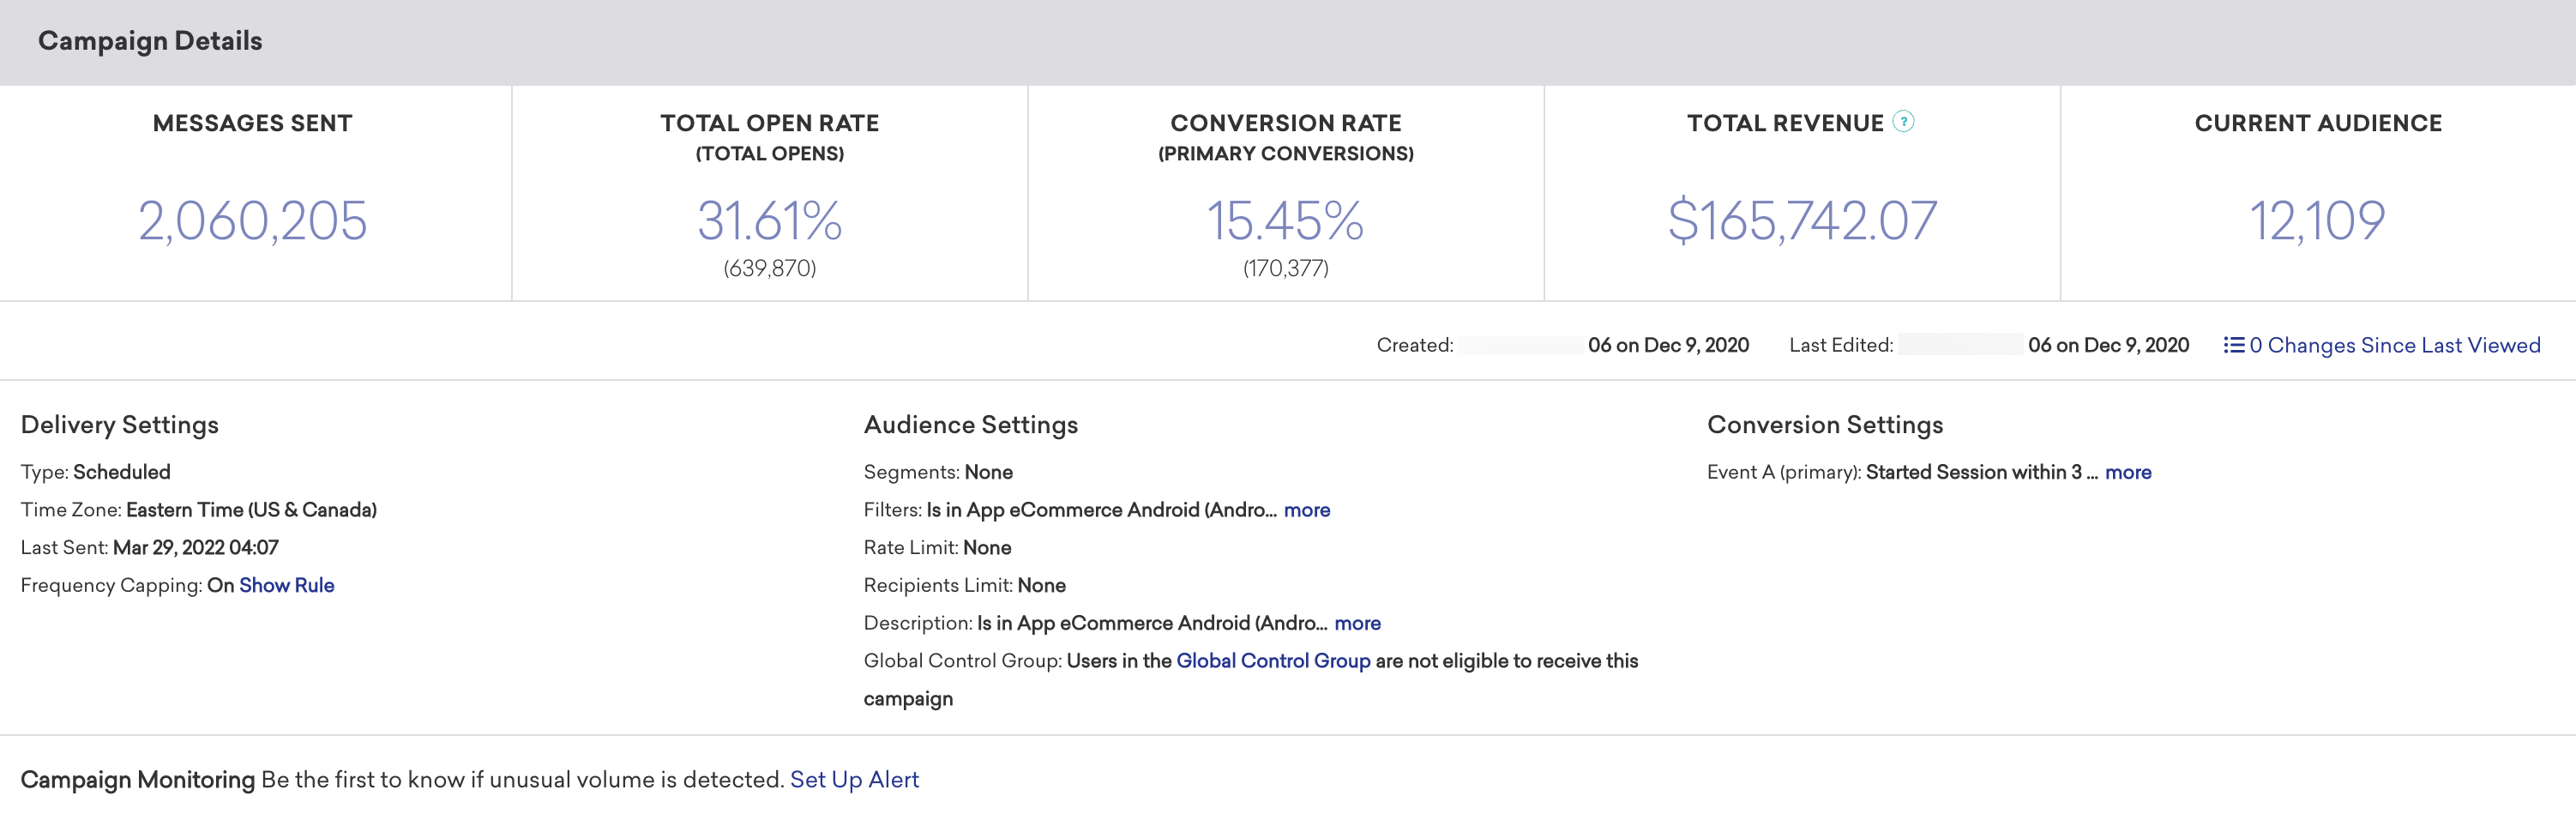
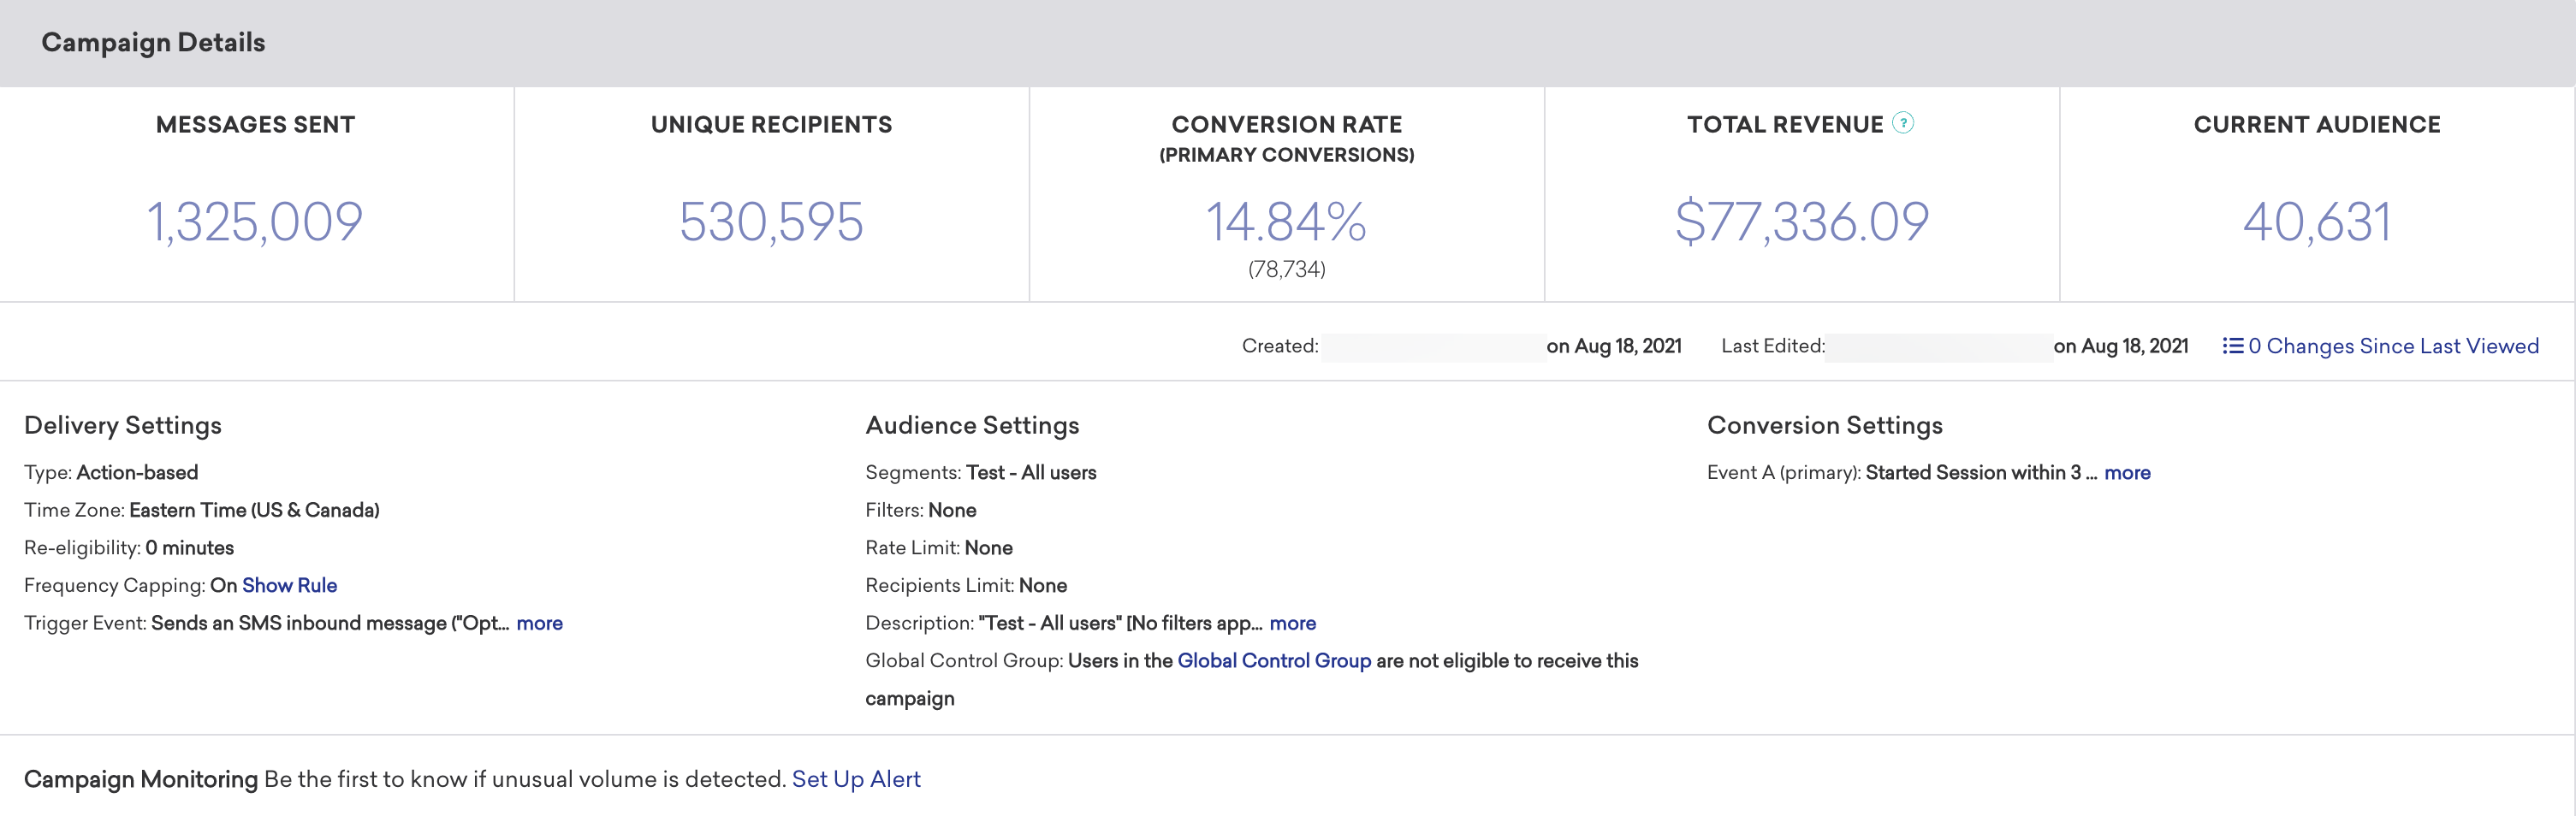
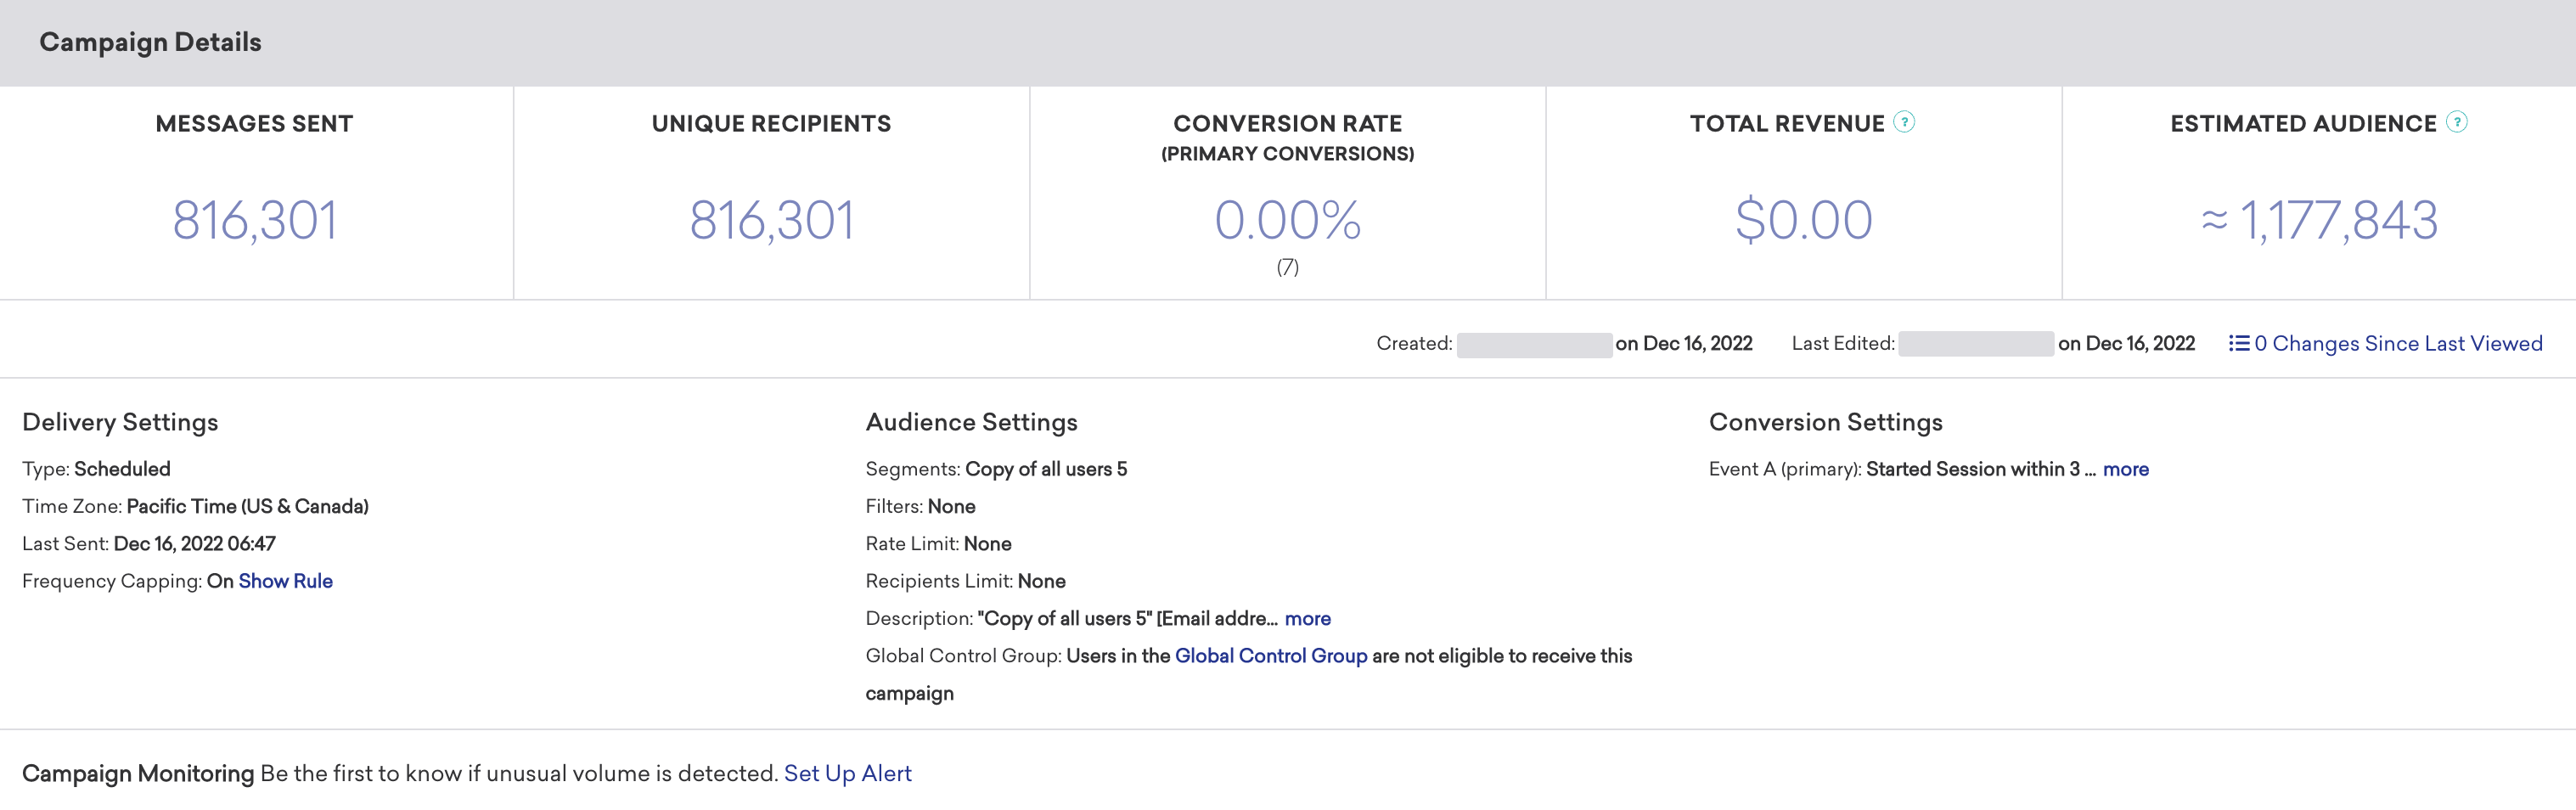
The Campaign Details panel shows a high-level overview of the entire performance for your message.
Review this panel to see overall metrics such as the number of messages sent to the number of recipients, the primary conversion rate, and the total revenue generated by this message. You can also review delivery, audience, and conversion settings from this page.

Analytics numbers in the dashboard and Snowflake may differ slightly. Braze measures numbers in the dashboard and records rows to Snowflake separately. Snowflake is the more precise data source, so if you see discrepancies between these sources, we recommend referring to Snowflake data.
Estimated Audience and Current Audience
Depending on the total number of users in your workspace, the Campaign Details panel labels audience statistics Current Audience or Estimated Audience.
The following table summarizes what each label means.
| Footer label | When it is used |
|---|---|
| Current Audience | The workspace has 50,000 users or fewer. Braze runs a full scan of workspace profiles for the default statistic, so the displayed audience size is a current, unsampled count (still subject to channel reachability, subscription rules, and other targeting options). |
| Estimated Audience | The workspace has more than 50,000 users. Braze doesn’t run a full-database count by default. Audience size is estimated from a sample and extrapolated, similar to the Reachable users range in the segment builder. Margins of error are expected, especially for small segments as a share of the workspace. |
For details on sampling behavior, Calculate exact statistics, and segmenting Reachable users, see Measure segment size.
Changes Since Last Viewed
The number of updates to the campaign from other members of your team is tracked by the Changes Since Last Viewed metric on the campaign overview page. Select Changes Since Last Viewed to view a changelog of updates to the campaign’s name, schedule, tags, message, audience, approval status, or team access configuration. For each update, you can see who performed the update and when. You can use this changelog to audit changes to your campaign.
Channel-specific reporting
The following tabs cover channel-specific panels, metrics, and troubleshooting. Select a channel to view its reporting details.
Banner reporting
Banner Performance
The Banner Performance panel outlines how well your message has performed across various dimensions. These metrics vary depending on your messaging channel and whether or not you’re running a multivariate test.
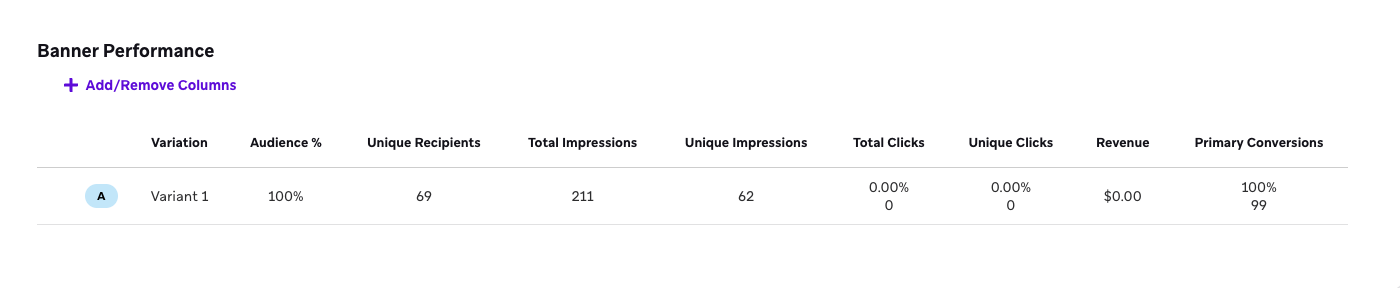
If you want to simplify your view, click Add/Remove Columns and clear any metrics as desired. By default, all metrics are displayed.
Banner metrics
These are the key metrics to track while reviewing your Banner campaign performance. Clicks and impressions for Banners are tracked automatically with the SDK.
For the full definitions of all Banners metrics, refer to the Report Metrics Glossary and filter by Banners.
| Metric | Definition |
|---|---|
| Total Impressions | Total Impressions is the number of times a message is viewed. Braze logs an impression only when the message becomes visible to the user on their screen. For example, if a message is placed at the bottom of a page, the impression is not logged until the user scrolls down and the message comes into view. If a user is shown the same message twice, it will count as two impressions. For Banners, impressions are logged once per user session. If the same Banner is viewed multiple times within the same session, only one impression is logged. |
| Unique Impressions | Unique Impressions is the total number of users who have viewed a message from a given campaign. An impression is logged only when the message becomes visible on a user's screen. Each user is only counted once. |
| Total Clicks | Total Clicks is the total number (and percentage) of users who clicked within the delivered message, regardless of whether the same user clicks multiple times. |
| Total Dismissals | Total Dismissals is the total number of times users dismissed the Banner. Available only for Banners with dismissal behavior enabled. |
| Unique Clicks | Unique Clicks is the distinct number of recipients who have clicked a link within a message at least once. Each user is only counted once. |
| Primary Conversions | Primary Conversions (A) or Primary Conversion Event is the number of times a defined event occurred after interacting with or viewing a received message from a Braze campaign. This defined event is determined by you when building the campaign. |
| Unique Daily Impressions |
Unique Daily Impressions is the number of unique users who viewed the message on a given day. This count resets each calendar day, so a user who views the same message on two different days is counted twice. This metric aligns with the billing metric of the same name.
Because a viewer can have a unique daily impression every day, you should expect this to be higher than Unique Impressions. |
| Revenue | Revenue is the total revenue in dollars from campaign recipients within the set primary conversion window. |
| Confidence | Confidence is the percentage of confidence that a certain variant of a message is outperforming the control group. |
Banner metrics calculation examples
There are a few metrics available that cover the visibility of your message. This includes Unique Daily Impressions and Unique Impressions. Let’s use a few example scenarios to understand these metrics better.
Let’s say you view a Banner today, then view the same Banner tomorrow, and again the day after tomorrow—you will be counted as a Unique Daily Impression three times. However, you will only be counted for one Unique Impression.
As another example, suppose you see five Unique Impressions on a Banner campaign. This means only five users’ devices performed all of the following steps:
- Started a session or the app explicitly requested a Banner sync (or both)
- Navigated to the Banners view
- SDK recorded an impression and logged it to the server
Unique Daily Impressions refers to the Banners that were actually seen.
Discrepancies between control groups and variants
When a Banner campaign uses a control group, control group impressions can be higher than variant impressions, even when the audience split between groups is even. This discrepancy is caused by a difference in how impressions are logged for control and variant Banners.
Both control and variant impressions require the Banner placement to enter the viewport. Variant impressions are logged only when the full Banner is visible on screen. Control impressions can be logged as soon as the placement enters the viewport, before the full Banner would be visible for a variant.
Content Card reporting
When sends are logged
The timing of a Sent event for Content Cards depends on the delivery type and Card Creation setting.
Scheduled delivery
For scheduled Content Cards, the timing of a Sent event depends on the Card Creation setting:
- At campaign launch: The send is logged at the scheduled send time, when the card is written to the user’s feed. This happens regardless of whether the user has opened the app or viewed the card.
- At first impression: The send is logged the first time the app requests the card after the scheduled send time, when the card is created on demand.
If your campaign is configured to use At first impression (recommended), the Sent count in campaign analytics grows gradually as individual apps request the card. If the app never requests a card (such as, a user never opens the app) before the card expires, no send is recorded, and the card is never delivered. If your campaign is configured to use At campaign launch, the Sent count in campaign analytics spikes at the scheduled time.
Action-based delivery
For action-based Content Cards, the send is logged shortly after the user performs the triggering action, when the card is written to their feed. This happens regardless of whether the user has viewed the card.
Campaigns Received and retargeting filters
Regardless of the delivery type or Card Creation setting, a Content Card campaign appears in the user’s profile under Campaigns Received only after they have actually viewed the card in the app. The Last Received Any Message and Last Received Campaign retargeting filters update at view time for the same reason.
Control groups
To measure the impact of an individual Content Card, you can add a control group to an A/B test. The top-level Campaign Details panel doesn’t include metrics from the Control Group variant.
Content Card Performance
The Content Card Performance panel outlines how well your message has performed across various dimensions. The metrics in this panel vary depending on your chosen messaging channel, and whether or not you are running a multivariate test. You can click on the Preview icon to view your message for each variant or channel.

If you want to simplify your view, click Add/Remove Columns and clear any metrics as desired. By default, all metrics are displayed.
Content Card metrics
Here is a breakdown of some key metrics you may see while reviewing your message performance. For the full definitions of all Content Cards metrics, refer to the Report Metrics Glossary and filter by Content Cards.
| Metric | Definition |
|---|---|
| Messages Sent |
Messages Sent is the total number of messages sent in a campaign. After launching a scheduled campaign, this metric will include all messages sent, regardless of whether they have been sent out yet due to rate limiting. This doesn’t mean the message was received or delivered to a device, only that the message was sent.
This is calculated differently depending on what you selected for Card creation:
|
| Total Impressions | Total Impressions is the number of times a message is viewed. Braze logs an impression only when the message becomes visible to the user on their screen. For example, if a message is placed at the bottom of a page, the impression is not logged until the user scrolls down and the message comes into view. If a user is shown the same message twice, it will count as two impressions. This can increment multiple times for the same user. |
| Unique Impressions | Unique Impressions is the total number of users who have viewed a message from a given campaign. An impression is logged only when the message becomes visible on a user's screen. This count doesn't increment the second time that a user views a Content Card. |
| Unique Daily Impressions |
Unique Daily Impressions is the number of unique users who viewed the message on a given day. This count resets each calendar day, so a user who views the same message on two different days is counted twice. This metric aligns with the billing metric of the same name.
Because a user can have a unique daily impression every day, you should expect this to be higher than Unique Impressions. |
| Unique Clicks | Unique Clicks is the distinct number of recipients who have clicked a link within a message at least once and is measured by dispatch_id. This includes clicks on Braze-provided unsubscribe links. |
| Unique Dismissals | Unique Dismissals is the number of unique recipients who dismissed a Content Card from a campaign. A user dismissing a Content Card from a campaign multiple times represents one unique dismissal. |
Regarding how impressions are logged, there are some nuances between web, Android, and iOS. Generally speaking, Braze logs an impression when a card is seen, which is after a user scrolls to the specific Content Card in their feed.
Unique Daily Impressions versus Unique Impressions
There are a few metrics available that cover the visibility of your message. This includes Unique Daily Impressions and Unique Impressions. Let’s use a few example scenarios to understand these metrics better.
Let’s say you view a Content Card today, then receive a new card from the same campaign tomorrow, and again the day after tomorrow—you will be counted as a Unique Daily Impression three times. However, you will only be counted for one Unique Impression. You’ll also be included in the number of Messages Sent, as the card was available on your device.
As another example, suppose you see five Unique Impressions on a Content Card campaign showing 150,000 Messages Sent. This means the card was made available (on the backend) to an audience of 150,000 users, but only five users’ devices performed all of the following steps after that send occurred:
- Started a session or the app explicitly requested a Content Cards sync (or both)
- Navigated to the Content Cards view
- SDK recorded an impression and logged it to the server
Your Messages Sent refers to Content Cards available to be seen, while Unique Daily Impressions refers to Content Cards that were actually seen.
Email reporting
Email Performance
The Email Performance panel outlines how well your message has performed across various dimensions. The metrics in this panel vary depending on your chosen messaging channel, and whether or not you are running a multivariate test. You can select the Preview icon to view your message for each variant or channel.
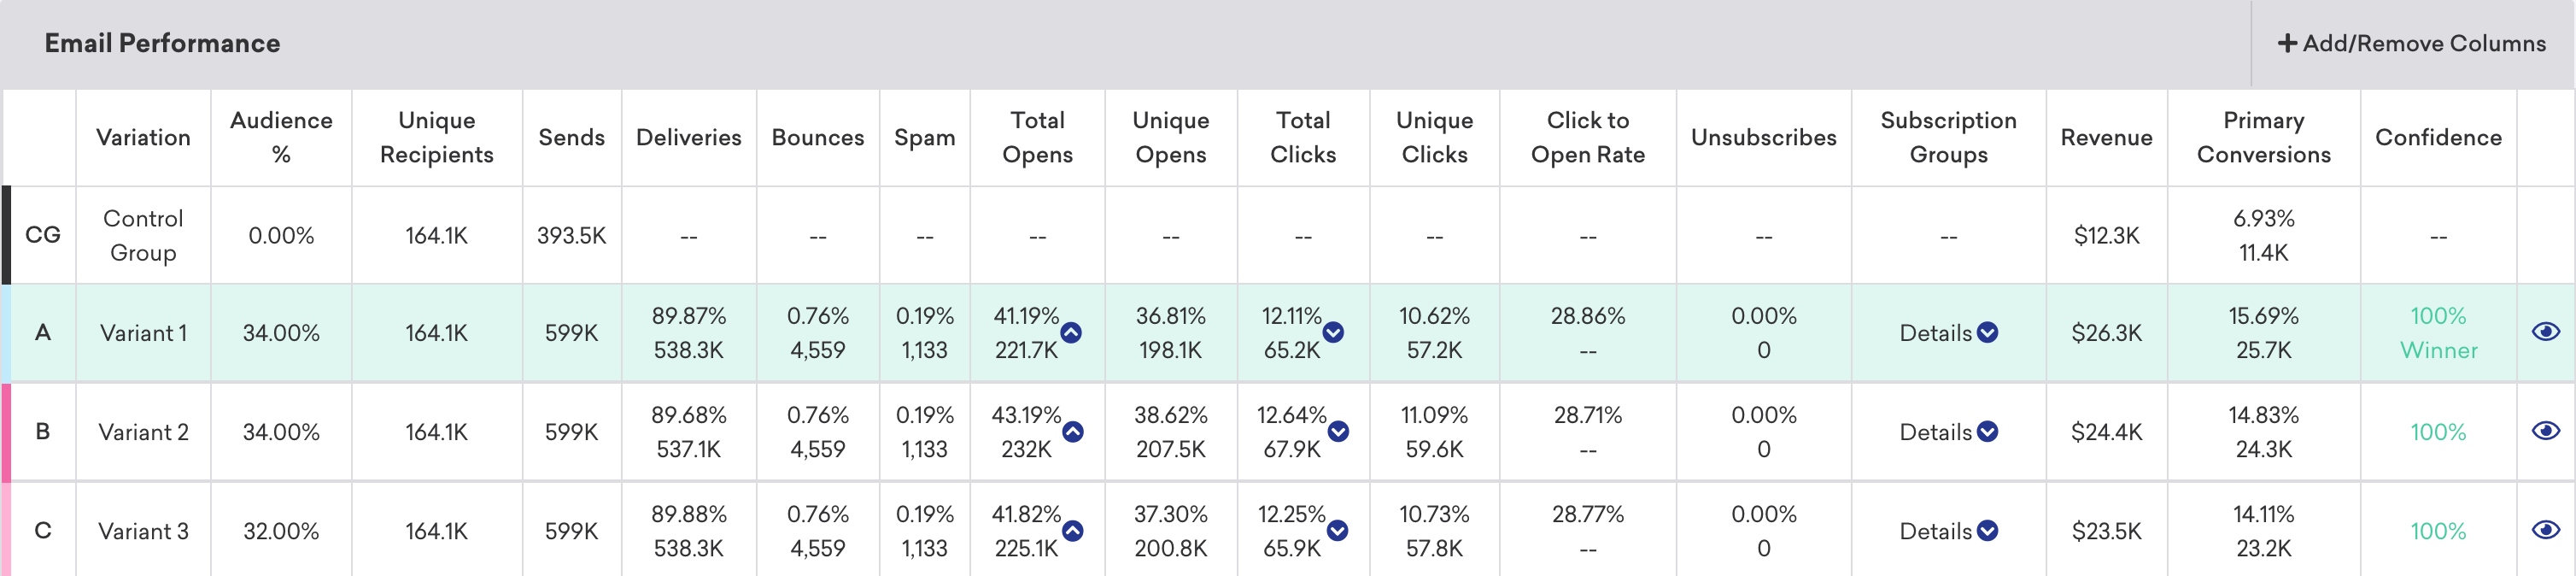
If you want to simplify your view, click Add/Remove Columns and clear any metrics as desired. By default, all metrics are displayed.
Heatmaps
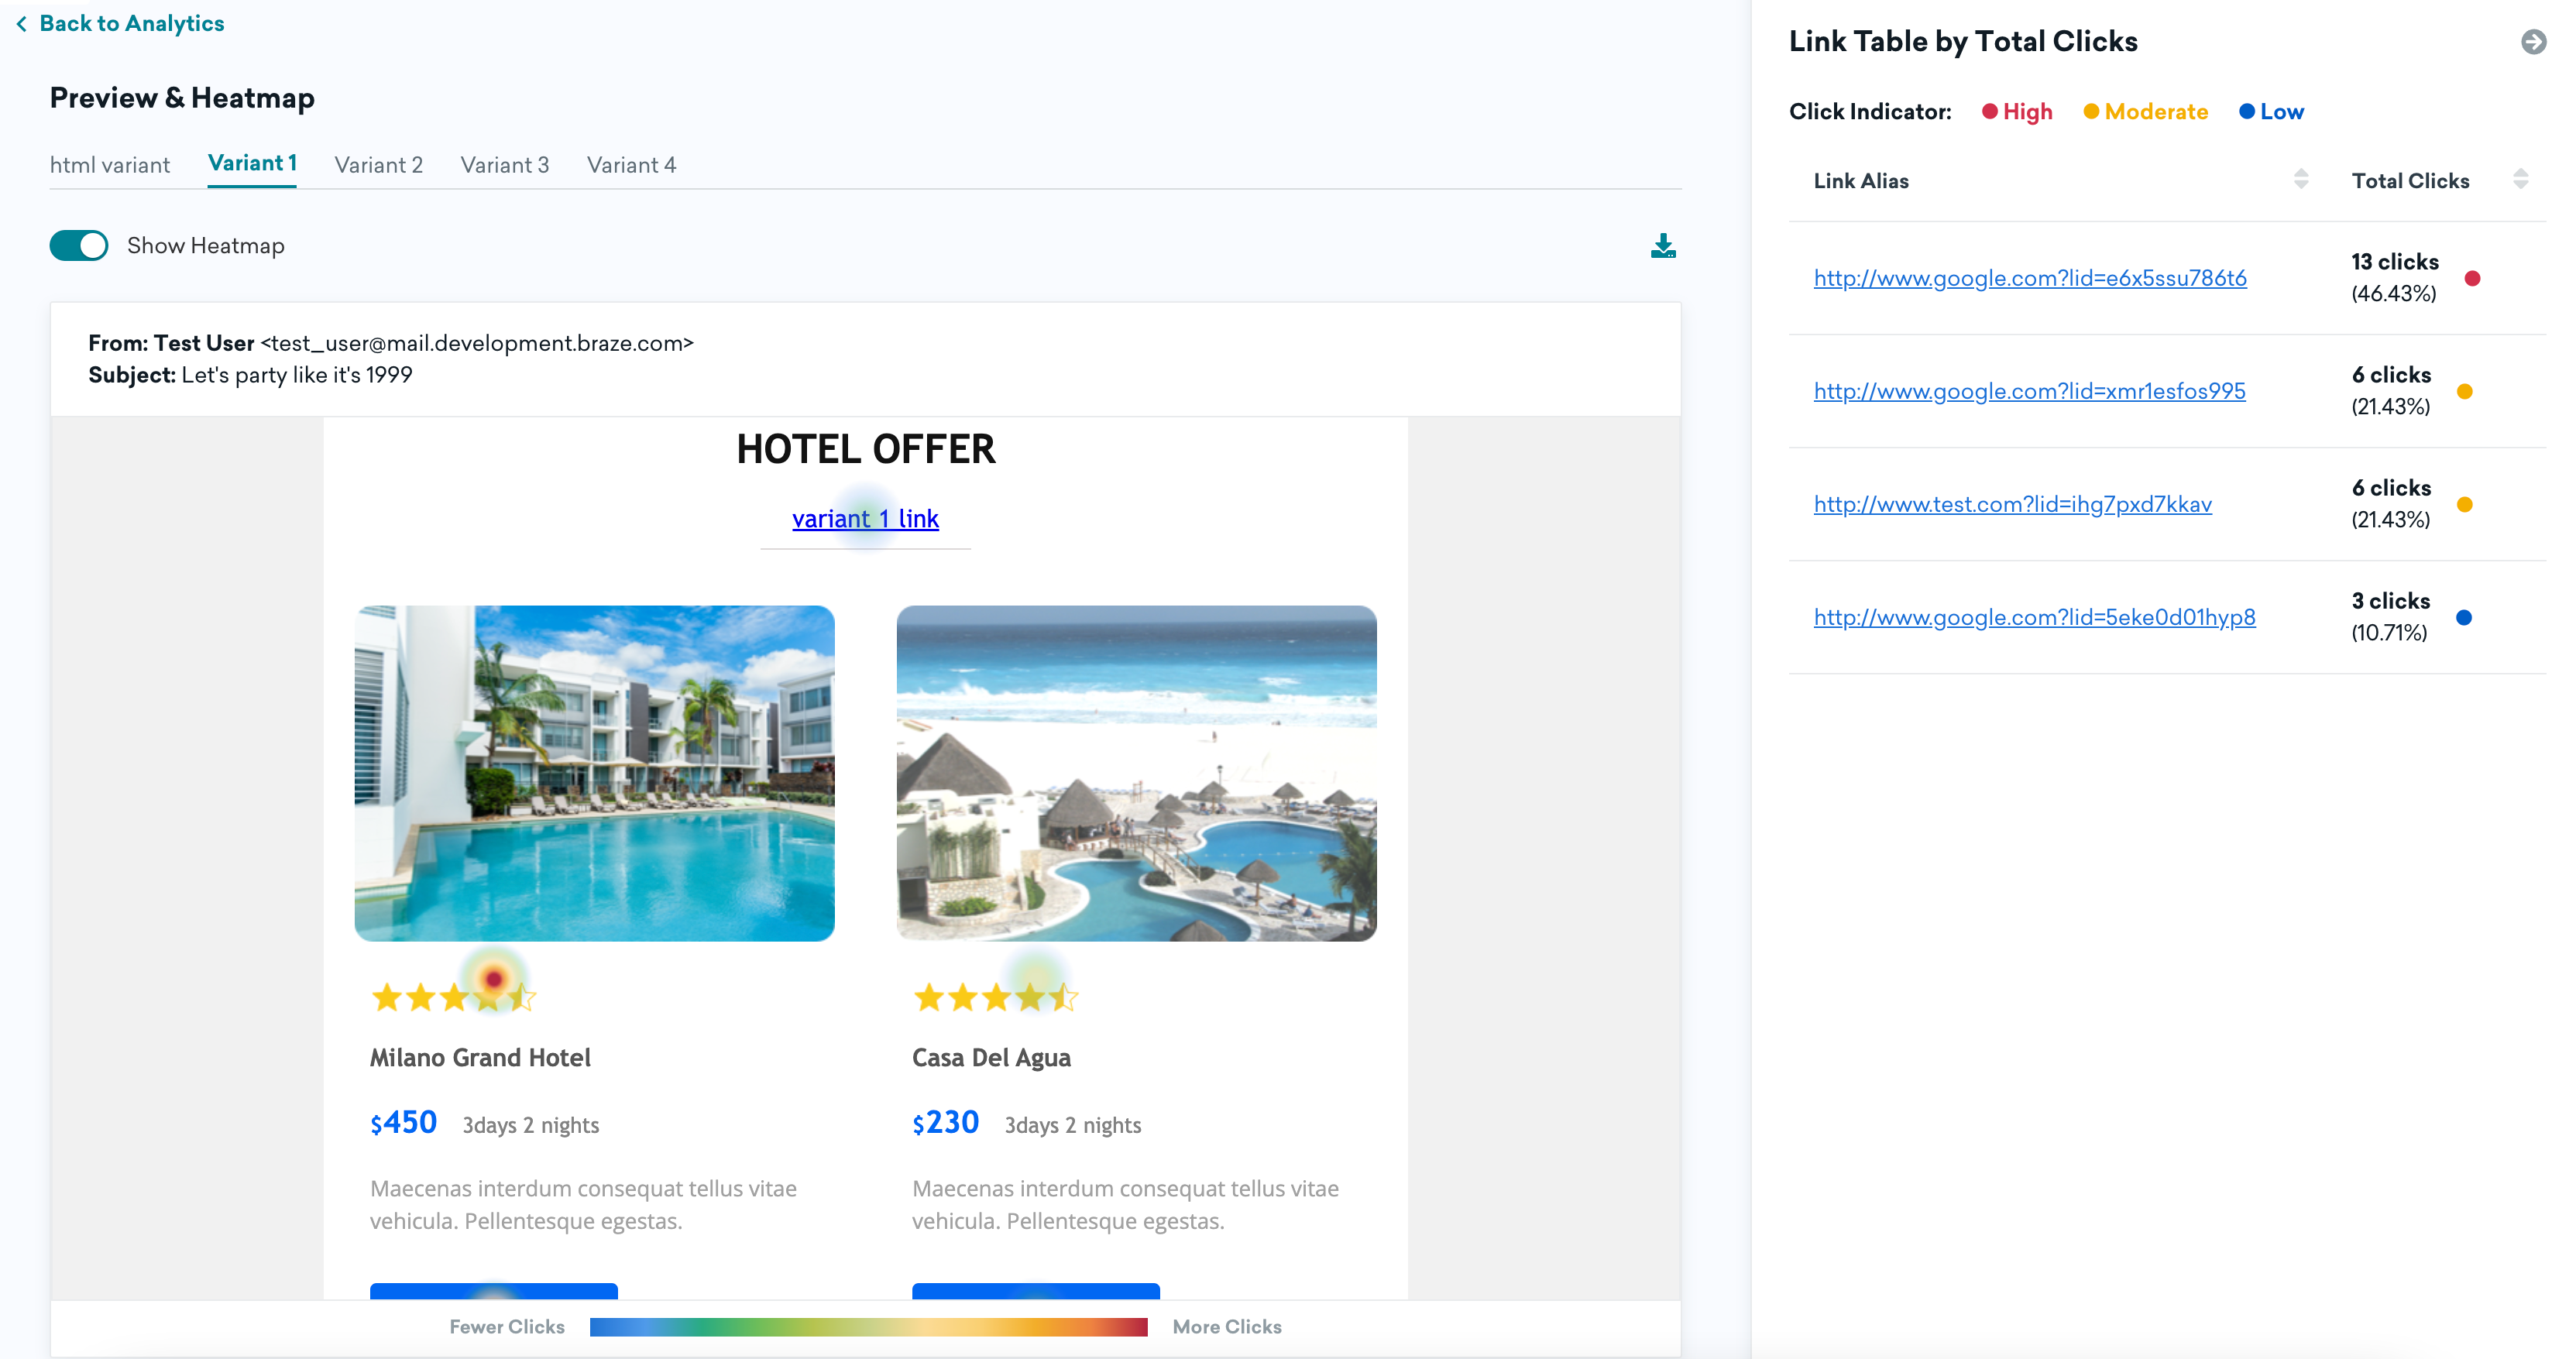
Using heatmaps, you can see how successful different links in a single email campaign are. From the Message Analytics section, go to the Email Performance panel. Select Preview & Heatmap to view a preview of your email campaign and the heatmap. Alternatively, you can select the hyperlink in the variant name to view the heatmap.
Campaign analytics display click data for up to 100 unique URLs per variant, sorted by total clicks. URLs are grouped by their normalized form, which does not include query parameters. If a variant has more than 100 unique normalized URLs, only the top 100 by click count are shown. Click data for URLs beyond this limit still exists, but won’t appear in the dashboard or heatmap. When link aliasing is enabled, clicks are tracked by link ID rather than raw URL, which typically results in fewer unique entries and makes this limit less likely to be reached.
In this view, you can use the Show Heatmap toggle to bring up a visual view of your email that shows the overall frequency and location of clicks within the lifespan of the campaign. In the Link Table by Total Clicks panel, you can view all of the links in your email campaign and sort by total clicks. This can provide additional insight on where your users navigate. To save a copy of the heatmap for reference, select the download button.
If links use Liquid for dynamic URLs, clicked URLs may not match the rendered link in the message closely enough for the heatmap to associate clicks with that link, so those links might not appear on the heatmap. To attribute click data to templated links on the heatmap, use link aliasing. For a full picture, use click data in the Link Table by Total Clicks panel.
Heatmap unsubscribe clicks versus campaign analytics
Clicks on unsubscribe links in the heatmap may differ from the Unsubscribers metric in campaign analytics:
- When you use a custom unsubscribe URL in your message body, Braze treats that link as a standard tracked link for heatmap purposes—it appears in the Link Table by Total Clicks like any other link. When Braze processes an unsubscription from the Braze-provided unsubscribe link, the Unsubscribers metric increments. Custom unsubscribe URLs do not increment that metric unless you update users through the API.
- When a user unsubscribes using the list-unsubscribe header (a one-click unsubscribe option shown by some inbox providers), that action increments Unsubscribers in campaign analytics but doesn’t appear as a click in the heatmap. If the message uses Unsubscribe from specific subscription group, Braze unsubscribes the user from only the configured subscription group instead of globally. Availability of this option varies by recipient because inbox providers differ in whether they render or support the list-unsubscribe header.
For a complete view of unsubscribe behavior, review both the heatmap link breakdown and the Unsubscribers metric. For more details, see Why Unsubscribes and unsubscribe-link clicks can differ.
Mobile-only links in the heatmap
The heatmap only shows heat signatures for links visible at the selected preview size.
Links that only appear in the mobile layout are hidden in Desktop (and may be hidden in Overall, depending on preview width), so those clicks do not show as heat signatures. Those links still appear in the Link Table by Total Clicks panel with their total clicks and percentages.
To view heat signatures for mobile-only links, select Mobile. The mobile preview matches the drag-and-drop editor’s mobile breakpoint (620 px). If the email switches layouts only at a narrower width, those links stay hidden even in the Mobile preview size.
Images
We recommend enabling CORS for your image URLs to help prevent images from breaking in heatmap previews and exports.
If images are missing from an export, work with your developers so image assets allow cross-origin access: the server should return the Access-Control-Allow-Origin header with either * or your Braze dashboard domain.
Email metrics
Here are some key email-specific metrics that you won’t see in other channels. To see the full definitions of all email metrics used in Braze, refer to our Email Analytics Glossary.
| Metric | Definition |
|---|---|
| Unique Clicks | Unique Clicks is the distinct number of recipients who have clicked a link within a message at least once and is measured by dispatch_id. This is tracked over a seven-day period for email and measured by dispatch_id. This includes clicks on Braze-provided unsubscribe links. This number should be between 5–10%. Anything greater than 10% is exceptional! |
| Unique Opens | Unique Opens is the total number (or percentage) of delivered messages that have been opened by a single user at least once and are tracked over a seven-day period. For email, this is tracked over a 7 day period. This number should be between 30–40%. Anything greater than 40% is exceptional! |
| Click-to-Open Rate | Click-to-Open Rate is the percentage of opened emails that have been clicked by a single user or machine at least once, and is only available in the Report Builder. |
| Spam Rate | Spam is the total number of emails delivered that were marked as "spam" by the recipient. While Braze doesn't change the subscription state of these users, these users will be automatically excluded in future emails, unless you're sending a transactional email, which is configured to "send to all users including unsubscribe". If this metric is greater than 0.08, that could be a sign that either your message copy is too salesy, or you should reconsider your email address collection methods (to confirm you're messaging those who are interested in your correspondence). |
| Unsubscribers or Unsub | Unsubscribers or Unsub is the number of messages resulting in an unsubscription. Unsubscriptions occur when Braze processes an unsubscribe from the Braze unsubscribe URL in the message body or from the list-unsubscribe header when that path is handled by Braze. |
| Other Opens |
Other Opens includes human opens that are not impacted by MPP (such as a user opening an email in the Gmail app or on Gmail desktop, which subsequently fires a tracking pixel and logs a regular open). Other Opens are typically human opens, but there could also be scenarios where a machine opens the mail (a bot or an inbox service provider like Gmail or Yahoo). It is also possible for a user to open an email on a non-iOS device and log the Other Open before a Machine Open is logged.
Because Machine Opens can be user-driven, the relationship between Machine Opens and Other Opens is not human versus non-human, but rather, MPP-impacted versus not MPP-impacted. While Other Opens can still be relied on to measure some portion of human opens, it's not currently possible to determine the percentage of Machine Opens that are human-driven, so determining a precise "true" open rate is not currently possible. For MPP-enabled users:
|
| Estimated Real Opens | Estimated Real Opens is an estimate of how many unique opens there would be if machine opens did not exist, and is the result of a proprietary Braze statistical model. See the following section for details. |
| Machine Opens |
Machine Opens includes both non-human and human opens that indicate an open by an Apple Mail Privacy Protection (MPP)-enabled user. This means that a user can log multiple Machine Opens. Machine Opens are not automatically generated if the device isn't connected to Wi-Fi, so a user can potentially open an email in the Apple Mail app before Apple pre-fetches images, which still results in a Machine Opens.
For MPP-enabled users:
|
| Bounces | Bounces is the total number of messages that were unsuccessfully delivered to the intended recipients. |
| Hard Bounce | A Hard Bounce is when an email fails to deliver to the recipient due to a permanent delivery error. A hard bounce might occur because the domain name doesn't exist or because the recipient is unknown. |
| Soft Bounce | A Soft Bounce is when an email fails to deliver to the recipient due to a temporary delivery error, even though the recipient’s email address is valid. A soft bounce might occur because the recipient's inbox is full, the server was down, or the message was too large for the recipient's inbox. |
| Deferral | A Deferral is when an email was not immediately delivered, but Braze retries the email for up to 72 hours after this temporary delivery failure to maximize the chances of successful delivery before attempts for that specific campaign are stopped. |
Deliveries and bounces
The dashboard highlights Hard Bounces. Some Bounces may be soft bounces and won’t match that count alone. You can approximate soft bounces with this formula:
Sends − (Deliveries + Hard Bounces) ≈ Soft Bounces
Deliveries can rise during your email service provider (ESP) retry window while retries succeed, while Sends and hard bounces for a one-time send stay fixed once the send completes. SendGrid and SparkPost retry for up to 72 hours; Amazon SES retries for up to 14 hours.
Common delivery troubleshooting scenarios
When reviewing your email analytics, keep these patterns in mind:
- Gap between Sends and (Deliveries + Hard Bounces): During the ESP retry window after a one-time send, this gap often reflects soft bounces or deferrals still being retried. After retries finish, any remaining gap usually means messages that soft bounced and were never delivered—those sends are not counted toward campaign Deliveries or Bounces. Use the formula in Deliveries and bounces to approximate in-flight soft bounces.
- Low Deliveries after retries finish: If delivery rates stay low once retries have finished, compare this send’s volume to your typical patterns. Mailbox providers may defer, throttle, or soft bounce mail when volume spikes relative to your sender reputation. You may see messages such as
Email was deferred due to the following reason(s): [IPs were throttled by recipient server]in the Message Activity Log. Use delivery speed rate limiting to pace large sends, and refer to Throttled IPs for additional troubleshooting steps. - Soft bounces and deferrals not shown in campaign analytics: Campaign analytics highlight Hard Bounces but do not include Soft Bounces or Deferrals as separate columns. Monitor these events in the Message Activity Log, with the Soft Bounced segment filter, or through Currents deferral events. For how retries work, see Deferrals.
- Delivery percentages that may not add up to 100%: Deliveries %, Bounce %, and Spam Rate % may not sum to 100% of Sends. Messages that soft bounce and are never delivered after the ESP retry window are not counted in campaign Deliveries or Bounces, so they can leave a portion of Sends unaccounted for in those rates. Wait until retries finish before judging final delivery performance, or use the formula in Deliveries and bounces to estimate how many sends are still in retry.
Clicks without an open event
A click can be logged without an open when the open pixel never loads. For example, the message is clipped in Gmail, or the user has disabled images (the open pixel is usually at the footer). Some clients proxy images (such as Apple Mail), so the open may log when the server first fetches the pixel, not when the user reads the mail. Corporate domains often block images by default.
A click and open can also land on different days: a user might click on May 16 with images off (no open), then open in webmail on May 17 (open logged then).
Higher Unique clicks than Unique opens
You might see Unique clicks far outpace Unique opens (for example, several unique clicks for each unique open) even when you expect a lower ratio from your audience. That pattern usually means opens are undercounted, clicks are inflated, or both. However, this does not mean Braze is mis-counting clicks in isolation.
Braze records an email open when the open tracking pixel loads. That pixel is a small transparent image (often described as 1 x 1 px) Braze adds to the message HTML. If the pixel never loads, no open is logged for that view, but link clicks can still register—so your click-to-open rate and the balance between these two metrics can look skewed.
The mailbox never loaded the open tracking pixel
The pixel might not load when:
- The message is clipped. Long HTML pushes content—including the pixel at the bottom—behind a “View entire message” style cutoff. In Gmail, messages larger than about 102 KB are often clipped, which can prevent the pixel from loading until the full message is opened (and sometimes not even then, depending on the client).
- Images are blocked or restricted. Stricter inbox security (common on corporate accounts) can block remote images until the recipient chooses to load them, so the open pixel does not fire even though they click tracked links.
- The message is in spam or bulk folders. Many providers do not load remote images (including the open pixel) in those folders by default.
What you can do
- Clipping: Shorten and simplify the HTML, remove unused styles or assets, and keep the overall message size within client limits. For Gmail, aim for under about 102 KB as described in Email size.
- Inbox security and image loading: Only the recipient (or their IT policy) can change whether images load by default.
- Spam placement: Focus on improving email deliverability and list hygiene. If mail is consistently landing in spam and metrics look wrong, contact Braze Support.
Security or bot activity on links
Some email security products follow links to scan for threats. Those requests can log a click without loading images, so you can see click activity without a matching open.
Deferrals
Deferred or deferral is when an email was not immediately delivered, but Braze retries the email through your ESP after this temporary delivery failure to maximize the chances of successful delivery before attempts for that specific campaign are stopped. SendGrid and SparkPost retry for up to 72 hours; Amazon SES retries for up to 14 hours. Typical reasons for deferrals include reputation-based email volume rate-limiting from the inbox provider, temporary connectivity issues, or DNS errors.
Deferrals differ from Soft Bounces. If no email was successfully delivered during this retry period, Braze will send one soft bounce event per attempted campaign sent. Before February 25, 2025, these retries were counted as multiple soft bounces for 1 campaign send.
Note that Deferrals are currently only available using Currents or Braze Snowflake features (such as Query Builder, SQL Segment, Snowflake Data Sharing). If you’re interested in Deferrals in campaign or Canvas analytics, submit product feedback.
Estimated real open rate
This statistic uses a proprietary analytical model created by Braze to reconstruct an estimate of the campaign’s unique open rate as if machine opens did not exist. While we receive labels of Machine Opens on some open events from email senders, these labels can often label actual opens as machine opens. In other words, the Other Opens are likely an underestimate of real opens (by actual users). Instead, Braze uses click data from each campaign to infer the rate at which actual humans opened the message. This compensates for various machine opening mechanisms, including Apple’s MPP.
Braze periodically evaluates Estimated Real Open Rate after a campaign has sent enough emails. After an evaluation, Braze may reevaluate the metric once after at least 72 hours, even if the campaign’s send volume is unchanged. Additional reevaluations require increased send volume.
Braze initially evaluates up to 10,000 delivered emails per variation, but reaching that volume doesn’t guarantee an estimate. Each variation also needs enough qualifying clicks from recipients with Machine Opens and recipients with no Machine Opens.
If qualifying click activity remains insufficient, the column displays “–”. When Braze reevaluates the variation, additional qualifying clicks may produce an estimate.
Considerations
Estimated Real Open Rate is only available in campaigns, and is not reported in Current events. This metric is only retroactively calculated for active campaigns launched before November 14, 2023.
Handling increases in click rates
Open rates can be an insightful metric to track for your email campaigns. However, these open rates aren’t necessarily accurate indicators of human engagement with email campaigns. An open event, by definition, occurs when a user opens an email, meaning a transparent open tracking pixel was successfully downloaded.
Additionally, use of security scanning tools can inflate open rates. Some of these tools protect their users by scanning incoming emails for malicious content by clicking links to verify their legitimacy. These clicks are often referred to as “bot clicks” or “non-human interaction” (NHI).
Ultimately, after an email leaves our servers, we have limited visibility into what happens next, but here are recommendations for managing NHI affecting your results:
- Be aware that this can happen to any sender and nearly any recipient. Clicks, like opens, are not entirely reliable indicators of human interaction with your messages, meaning NHI is not preventable.
- Higher positive engagement tends to correlate with lower NHI, so it’s important to follow email messaging best practices. This includes getting explicit permission from your users to send email and sunsetting unengaged subscribers on a regular cadence.
- Use HTTPS links in your emails when possible. NHI is less common for senders using secure links.
- If you use a single-click unsubscribe process, consider creating a preference center that takes users to a page to edit and manage their notification preferences. This can be helpful because NHI can inadvertently unsubscribe users.
- Consider using other metrics to measure your email marketing success, such as conversions, app sessions, or site visits.
- Add a hidden link in your email campaigns. This link would be something that a human wouldn’t notice like white-on-white text or a punctuation mark. Bots tend to click all links, so you can conclude that users generating click events on the invisible link are actually the result of NHI, so the open or click doesn’t necessarily indicate positive engagement.
Troubleshooting
Bounced emails
- 554 5.7.1 [internal] recipient address was suppressed due to customer policy: Try another address, re-engage on another channel, or remove the address from the suppression list for your own test addresses only. Avoid removing real user suppressions as that can hurt reputation.
- Mailbox full / invalid account: Often a list-quality signal. Prioritize users who recently opened or clicked (for example, the last 30–60 days) while you clean inactive or bad addresses.
Soft bounce retry behavior
When an email soft bounces due to temporary issues (such as mailbox full, server temporarily unavailable, or other transient deliverability failures), Braze automatically retries delivery for up to 72 hours. The number of retry attempts varies by receiver.
If the email is not successfully delivered after the retry period, Braze logs one soft bounce event for that campaign send. These soft bounces don’t appear in campaign analytics, but you can:
- Monitor them in the Message Activity Log to see bounce reasons
- Use the Soft Bounced segment filter to exclude these users from future sends
Because of this retry period, email delivery metrics (deliveries, bounces, and spam rate) may not add up to 100% for campaigns where soft-bounced emails ultimately fail to deliver.
For more information on soft bounces, see the Email analytics glossary.
Invalid domains
Errors like unable to get mx info often mean many targets use bad domains (for example, typos). Segment, export, correct, and re-import those profiles.
Throttled IPs
You may see the message Email was deferred due to the following reason(s): [IPs were throttled by recipient server] in the Message Activity Log if a mailbox provider temporarily slows or blocks delivery from your IP because of volume, reputation, or both. Braze retries deferred messages; if deferrals cluster from this, you often see elevated soft bounces alongside them.
This pattern usually means you’re sending faster than the mailbox provider accepts for your current reputation. In addition to improving engagement and list quality, use delivery speed rate limiting to cap how quickly messages leave Braze for a campaign or Canvas. That helps reduce throttling while you work with your deliverability team on longer-term fixes.
If throttling persists for specific domains, reduce volume to those domains and contact Braze deliverability support for guidance.
Unknown IP reputation status
If your email performance report shows an “unknown” value for IP reputation, this may be related to a Google Postmaster Tools outage. Google Postmaster Tools provides reputation data for Gmail deliverability, and temporary service disruptions can result in missing or unknown reputation values.
If you see an unknown reputation status and have questions about your email deliverability, contact Braze Support.
KakaoTalk reporting
KakaoTalk Performance
The KakaoTalk Performance panel outlines how well your message has performed across various dimensions. The metrics in this panel vary depending on your chosen messaging channel, and whether or not you are running a multivariate test. You can click on the Preview icon to view your message for each variant or channel.
If you want to simplify your view, click Add/Remove Columns and clear any metrics as desired. By default, all metrics are displayed.
KakaoTalk metrics
Here are some key KakaoTalk metrics you may see in your analytics. For more details, see the Report Metrics Glossary.
Currently, estimated or exact audience statistics are not available for KakaoTalk campaigns.
| Term | Definition |
|---|---|
| Audience | Audience is the percentage of users who received a particular message. (Number of recipients in variant) / (Unique Recipients) |
| Unique Recipients | Unique Recipients is the number of unique daily recipients, or users who received a new message in a day. For this count to increment for a user more than once, the user must receive a new message on a different day. This number is based on the user_id. For more details, see Unique Recipients in the Report Metrics Glossary. |
| Sends | The total number of messages sent in a campaign. This doesn’t mean the message was received or delivered to a device, only that the message was sent. |
| Total Clicks | The total number of times that the KakaoTalk messages sent were clicked by users. |
| Errors | Errors is the number of errors returned by the KakaoTalk provider (incremented during the sending process). |
| Revenue | Revenue is the revenue in dollars from campaign recipients within the set primary conversion window. |
| Primary Conversions | Primary Conversions is the number of times a defined event occurred after interacting with or viewing a received message from a Braze campaign. This defined event is determined by you when building the campaign. |
Report Builder
You can also use Report Builder to build custom reports for your KakaoTalk campaigns. When creating a report, you can filter to include only KakaoTalk campaigns by selecting KakaoTalk under Channels, or by filtering by any tags you’ve applied to your KakaoTalk campaigns.


LINE reporting
Control groups
To measure the impact of an individual LINE message, you can add a control group to an A/B test. The top-level Campaign Details panel doesn’t include metrics from the Control Group variant.
LINE Performance
The LINE Performance panel outlines how well your message has performed across various dimensions. The metrics in this panel vary depending on your chosen messaging channel, and whether or not you are running a multivariate test. You can click on the Preview icon to view your message for each variant or channel.
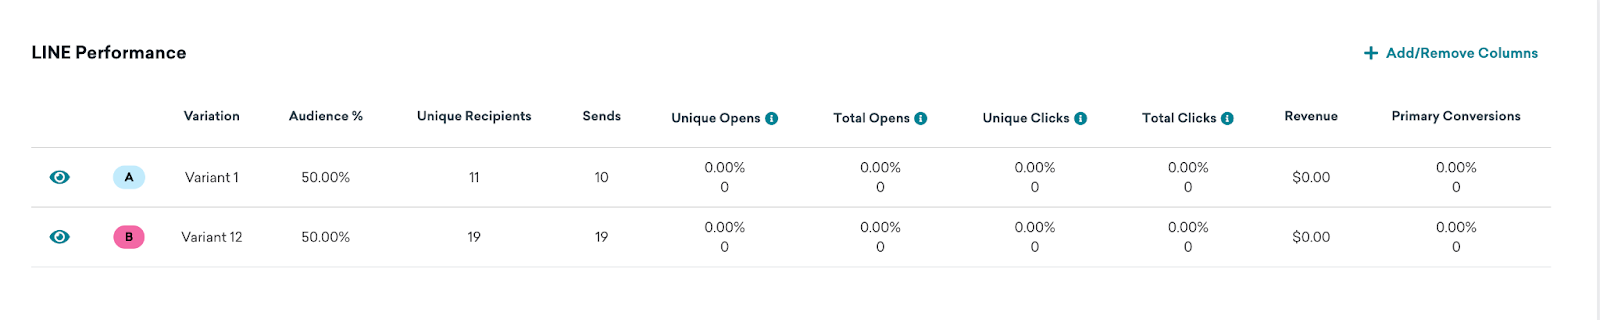
If you want to simplify your view, click Add/Remove Columns and clear any metrics as desired. By default, all metrics are displayed.
LINE metrics
Here are some key LINE metrics you may see in your analytics. To see the definitions of all LINE metrics used in Braze, refer to Report metrics glossary.
| Term | Definition |
|---|---|
| Sends | The total number of sends successfully communicated between Braze and LINE. This does not mean the message was received by the user. |
| Unique Opens | The total number of LINE messages sent that were opened by users after a minimum threshold of 20 messages per day has been reached. |
| Total Opens | The total number of times that the LINE messages sent were opened by users after a minimum threshold of 20 messages per day has been reached. |
| Unique Clicks | The total number of LINE messages sent that were clicked by users, after a minimum threshold of 20 messages per day has been reached. |
| Total Clicks | The total number of times that the LINE messages sent were clicked by users after a minimum threshold of 20 messages per day has been reached. |
Push reporting
Push Performance
The Push Performance panel outlines how well your message has performed across various dimensions. The metrics in this panel vary depending on your chosen messaging channel, and whether or not you are running a multivariate test. You can click on the Preview icon to view your message for each variant or channel.
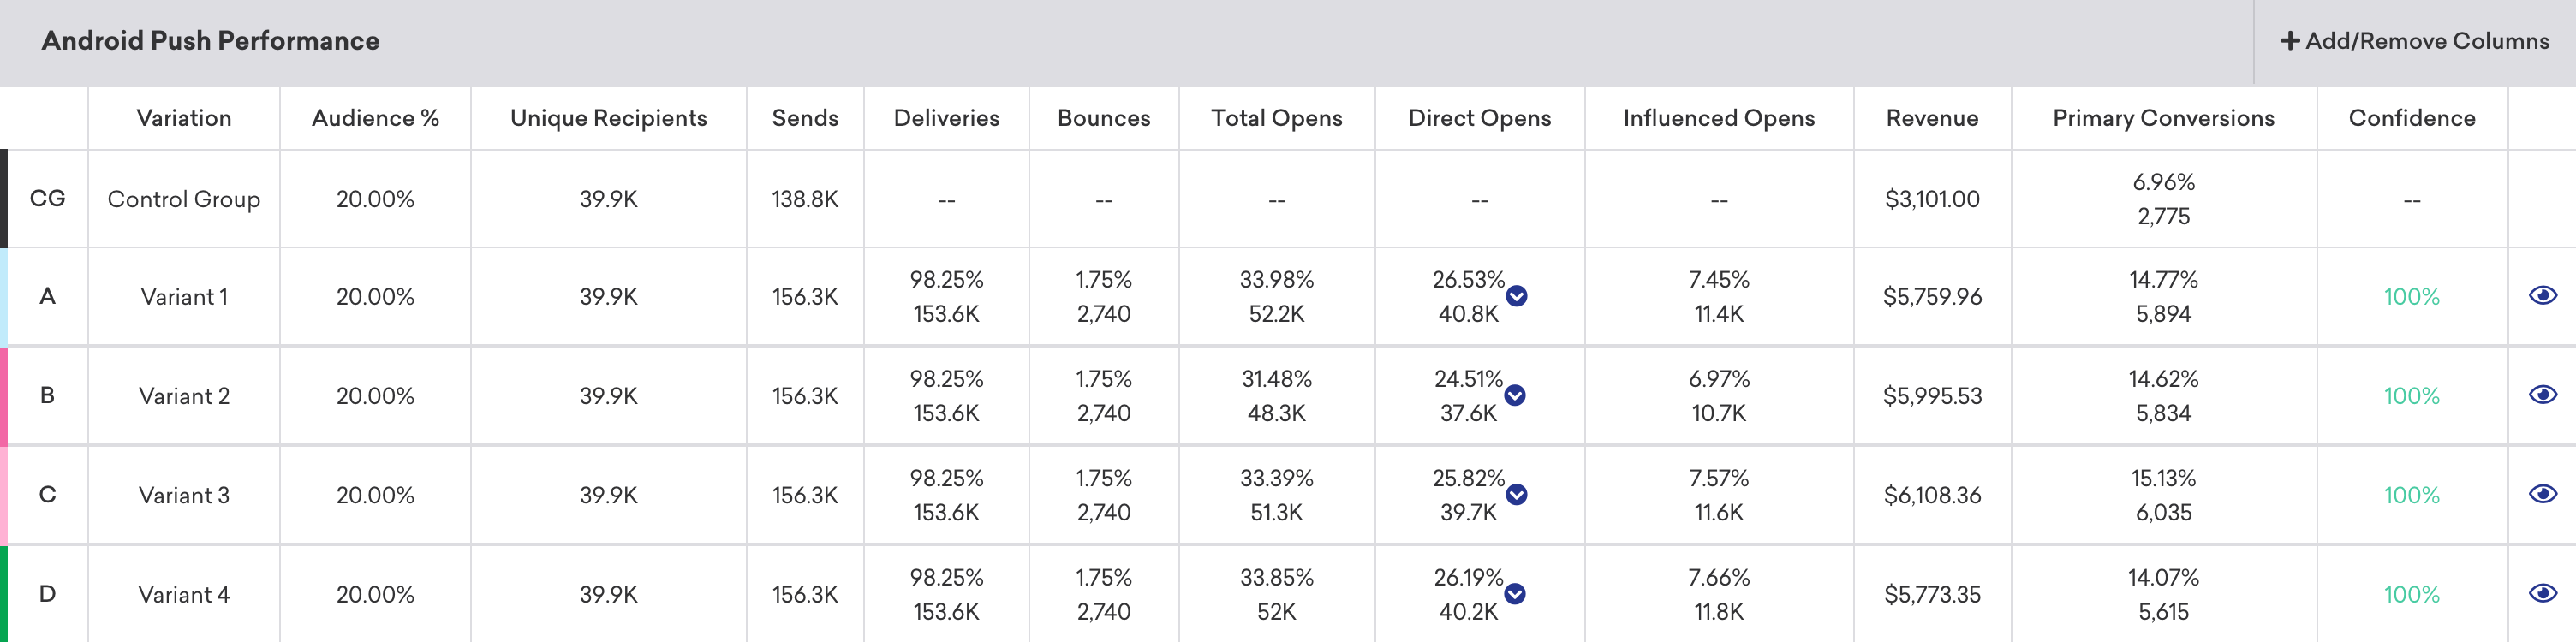
If you want to simplify your view, click Add/Remove Columns and clear any metrics as desired. By default, all metrics are displayed.
Push metrics
Here is a breakdown of some key metrics you may see while reviewing your message performance. For the full definitions of all push metrics, refer to the Report Metrics Glossary and filter by push.
| Metric | Description |
|---|---|
| Bounces | Bounces is the total number of messages that were unsuccessfully delivered to the intended recipients. See Bounced push notifications. |
| Direct Opens | Direct Opens is the total number (or percentage) of users who opened your app or website by directly pressing the notification. |
| Opens | Opens are instances including both Direct Opens and Influenced Opens in which the Braze SDK has determined, using a proprietary algorithm, that a push notification has caused a user to open the app. |
Delivery of notifications is a “best effort” by Apple Push Notification services (APNs). It is not intended to deliver data to your app, only to notify the user that there is new data available. The important distinction is that we will display how many messages we successfully delivered to APNs, not necessarily how many APNs successfully delivered to devices.
Tracking unsubscribes
Push unsubscribes aren’t included as a metric in campaign analytics, and depend on updates to a user’s push status from providers like Apple or Google. These updates can be infrequent and unpredictable. As a result, push unsubscribes are not included as a metric in push campaign analytics.
However, manually tracking push unsubscribes can still provide valuable insights into user responses to your notification frequency and content relevance. Here are two options for tracking push unsubscribes: Using segment filters or custom filters.
You can create a segment to identify users who aren’t push enabled, meaning they’re not subscribed or opted-in and don’t have a foreground push token. For example, to see the number of unsubscribes in your app, you would use an “OR” combination of the following segments:
Background or Foreground Push Enabled is falseHas Uninstalled
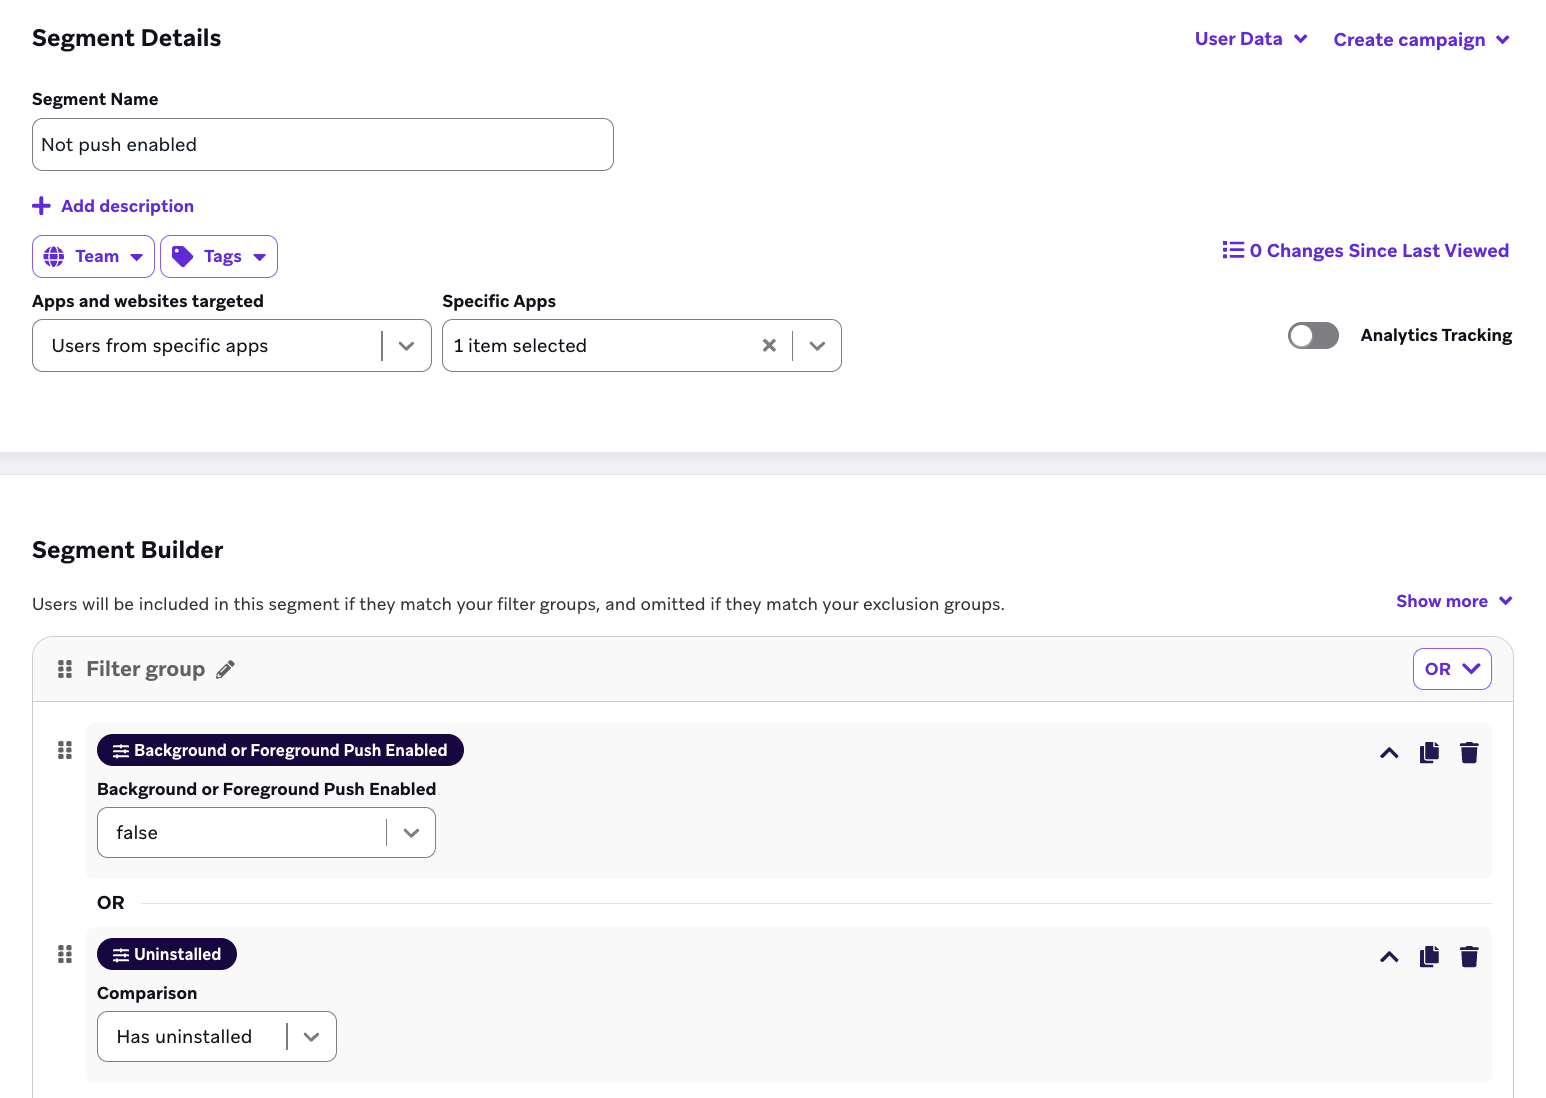
Note the segmentation filters are approximate and can’t be specifically tied to a date and campaign.

Logging a custom event for subscription change will log data points. Alternatively, use segment filters to identify and target users who aren’t push enabled.
For a different workaround, we also recommend creating a custom event for push unsubscribes based on whether a user’s push enabled status is true or false in order to track this metric.
Understanding opens
Even though Direct Opens and Influenced Opens include the word “opens”, they’re actually different metrics. Direct Opens refers to the direct opening of a push notification. Influenced Opens refers to the opening of an app, without opening a push notification within a specific time frame after receiving it. So, Influenced Opens refers to the app opens, not push notification opens.
Push action buttons and reporting
When you add push action buttons, the Push Performance panel can include Body Clicks, Button 1 Clicks, and Button 2 Clicks alongside metrics such as Direct Opens. These columns measure different interactions, so compare them when you interpret engagement.
Direct Opens reflects dashboard metrics for interactions that count as a direct open of your message. Push Notification Open events in Currents or Snowflake describe push interactions more broadly and can include optional fields such as button_action_type (for example, close) and button_string. For field definitions, see Push Notification Open events.
For iOS, Braze default notification categories (such as Yes / No, Accept / Decline, or Confirm / Cancel) use a fixed pairing: the first action supports OPEN_APP, a URI, or a deep link (aligned with On-Click Behavior in the composer). The companion action uses CLOSE by default—it dismisses the notification and does not open the app. See the default mapping in Apple push action button object.
Because of that, taps on the dismissive preset button (for example, No or Decline) typically do not count toward Direct Opens. Those taps may still appear in Push Notification Open exports when logged, with button_action_type set to close and button_string identifying the tapped action. When you compare campaign analytics to warehouse data, use those payload fields so you don’t treat dismissive taps the same as taps on the notification body or the primary action.
For Android, you set On-Click Behavior per button (Open App, Redirect to Web URL, or Deep Link), so reporting follows the actions you configure rather than the iOS default OPEN_APP / CLOSE split.
Why push sends can exceed unique recipients
The number of Sends may exceed the number of Unique Recipients due to the following reasons:
- Re-eligibility is on: When re-eligibility is enabled in your campaign or Canvas settings, users who meet the segment and delivery criteria can receive the same push notification multiple times. This results in a higher number of total sends.
- Users have multiple devices: If re-eligibility is not enabled, the difference may be explained by users having multiple devices associated with their profile. For instance, a user could have both a smartphone and tablet, and the push notification is being sent to all registered devices. Each delivery counts as a send, but only one unique recipient is recorded.
- Users are assigned to multiple apps: If users are associated with more than one app (such as when testing a new app), they may receive the same push notification on each app. This contributes to a higher number of sends.
Why bounces occur
Bounces occur in Apple Push Notification services (APNs) when a push notification attempts delivery to a device that does not have the intended app installed. APNs also has the right to change tokens for devices arbitrarily. If you attempt to send to a user’s device in which their push token has changed in between when we previously registered their token (such as at the beginning of each session when we register a user for a push token) and the time of send, this would cause a bounce.
If a user disables push within their device settings on subsequent app open the SDK will detect that push has been disabled and notify Braze. At this point we will update the push enabled state to be disabled. When a disabled user receives a push campaign before having a new session, the campaign would successfully send and appear as delivered. The push will not bounce for this user. Following a subsequent session, when you attempt to send a push to the user Braze is already aware of whether we have a foreground token as such no notification is sent.
Push notifications that expire before delivery are not considered as failed and will not be recorded as a bounce.
Firebase Cloud Messaging (FCM) bounces could occur in three cases:
| Scenario | Description |
|---|---|
| Uninstalled applications | When a message attempts delivery to a device and the intended app is uninstalled on that device, the message will be discarded and the device’s registration ID will be invalidated. Any future attempts at messaging the device will return a NotRegistered error. |
| Backed up application | When an application is backed up, its registration ID could become invalid before the application is restored. In this case, FCM will no longer store the application’s registration ID and the application will no longer receive messages. As such, registration IDs should not be saved when an application is backed up. |
| Updated application | When an application is updated, the previous version’s registration ID may no longer work. As such, an updated application should replace its existing registration ID. |
SMS, MMS, and RCS reporting
Control groups
To measure the impact of an individual SMS, MMS, or RCS message, you can add a control group to an A/B test. The top-level Campaign Details panel doesn’t include metrics from the Control Group variant.
SMS/MMS/RCS Performance
The SMS/MMS/RCS Performance panel outlines how well your message has performed across various dimensions. The metrics in this panel vary depending on your chosen messaging channel, and whether or not you are running a multivariate test. You can click on the Preview icon to view your message for each variant or channel.
When a campaign includes both SMS and RCS variants, use the Performance Over Time chart and the Statistics filter to compare SMS and RCS performance side by side. You can also use the SMS/MMS/RCS Performance table to show separate RCS and SMS fallback rows for the same send.

If you want to simplify your view, click Add/Remove Columns and clear any metrics as desired. By default, all metrics are displayed.
SMS, MMS, and RCS metrics
Here is a breakdown of some key metrics you may see while reviewing your message performance. For the full definitions of all SMS, MMS, and RCS metrics, refer to the Report Metrics Glossary and filter by SMS/MMS and RCS.
| Metric | Definition |
|---|---|
| Sent | Sent is every time a campaign or Canvas step has been launched or triggered, and an SMS or RCS has been sent from Braze. It's possible that the SMS or RCS didn't reach a user's device due to errors. |
| Delivery Failures | Delivery Failures are when the SMS couldn't be sent because of queues overflowing (sending SMS at a rate higher than your long or short codes can handle) or similar failures before the provider accepts the message. SMS fallback from an RCS send can also record Delivery Failures for the fallback SMS. |
| Confirmed Delivery | Confirmed Deliveries are when the carrier has confirmed the message was delivered to the target phone number. |
| Rejections | Rejections are when the SMS or RCS provider reported that the message wasn't delivered. This can happen for several reasons, including carrier content filtering, availability of the destination device, the phone number is no longer in service, and similar. For RCS, failed and undelivered provider statuses are counted as Rejections rather than Delivery Failures. |
| Opt-Out | Opt-Out is when a user replied to your message with an opt-out keyword and was unsubscribed from your SMS or RCS program. |
| Help | Bounces is the total number of messages that were unsuccessfully delivered to the intended recipients. |
| Total Clicks | Total Clicks is the total number (or percentage) of click events on the delivered message. The same recipient can contribute more than once. |
Keyword responses
The Keyword Responses panel shows you a timeline of the inbound keywords users replied with after receiving your message.
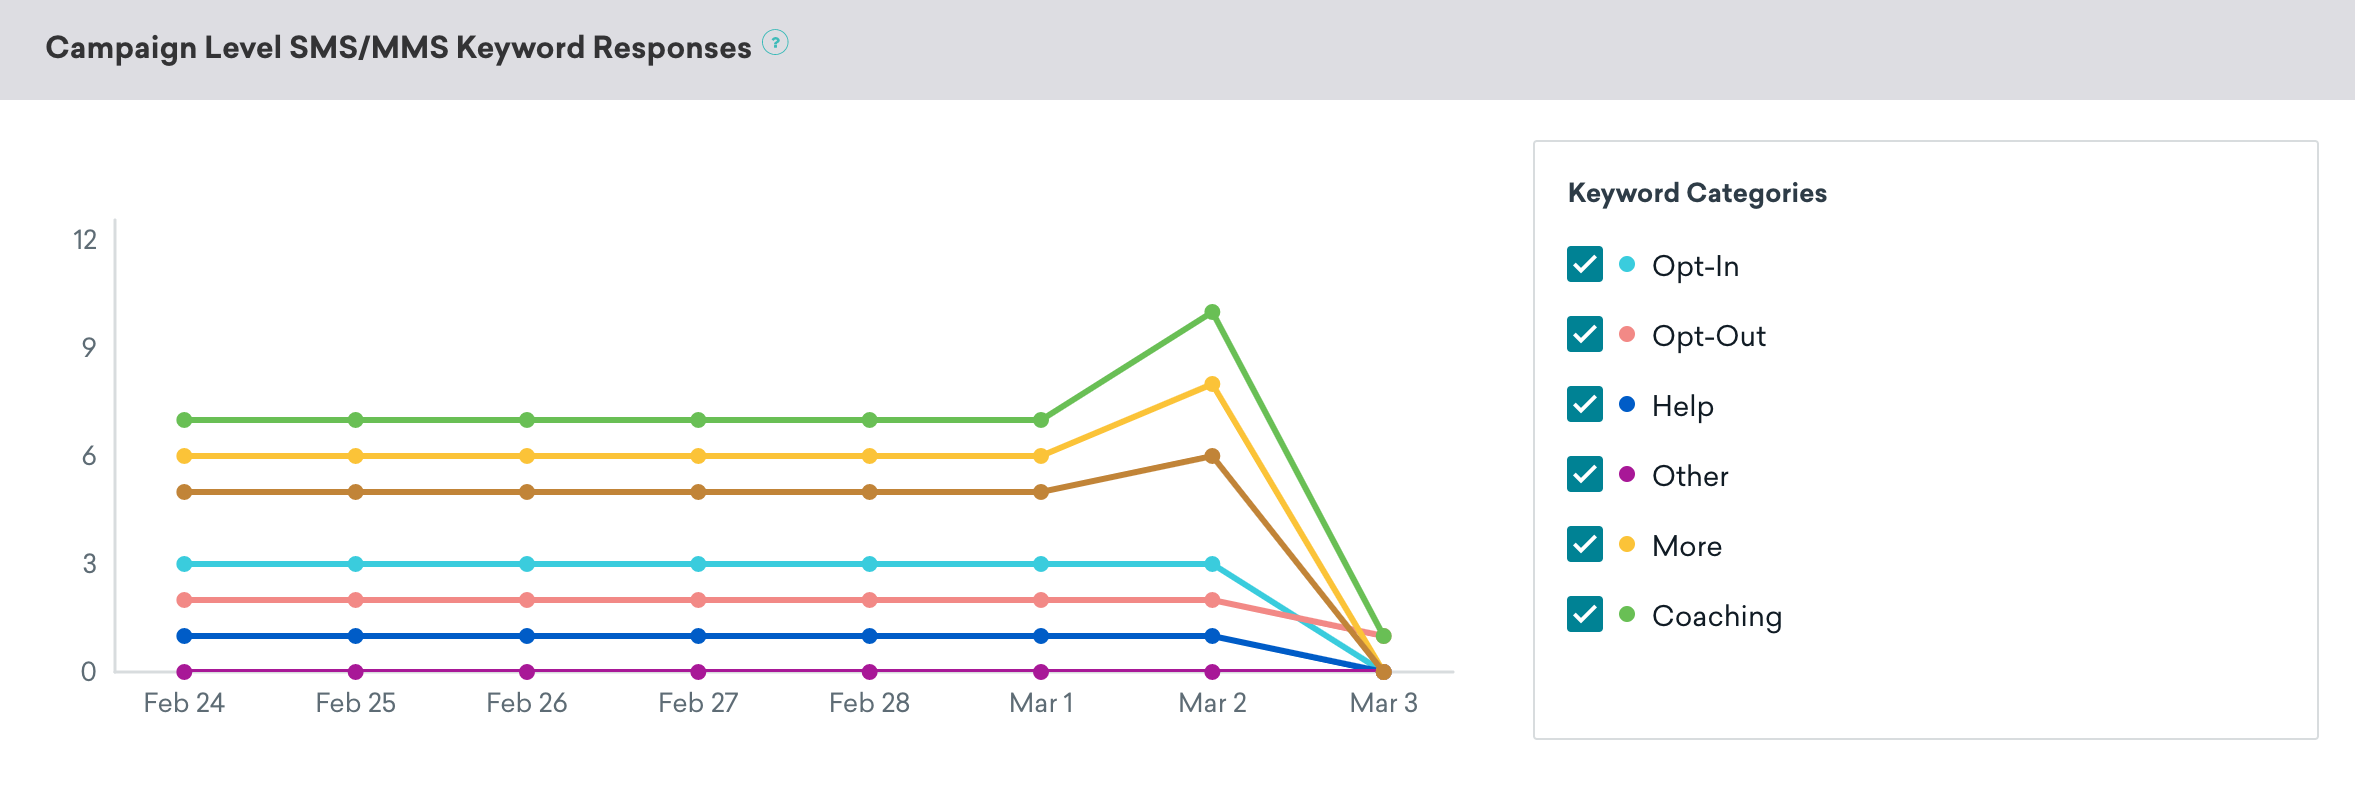
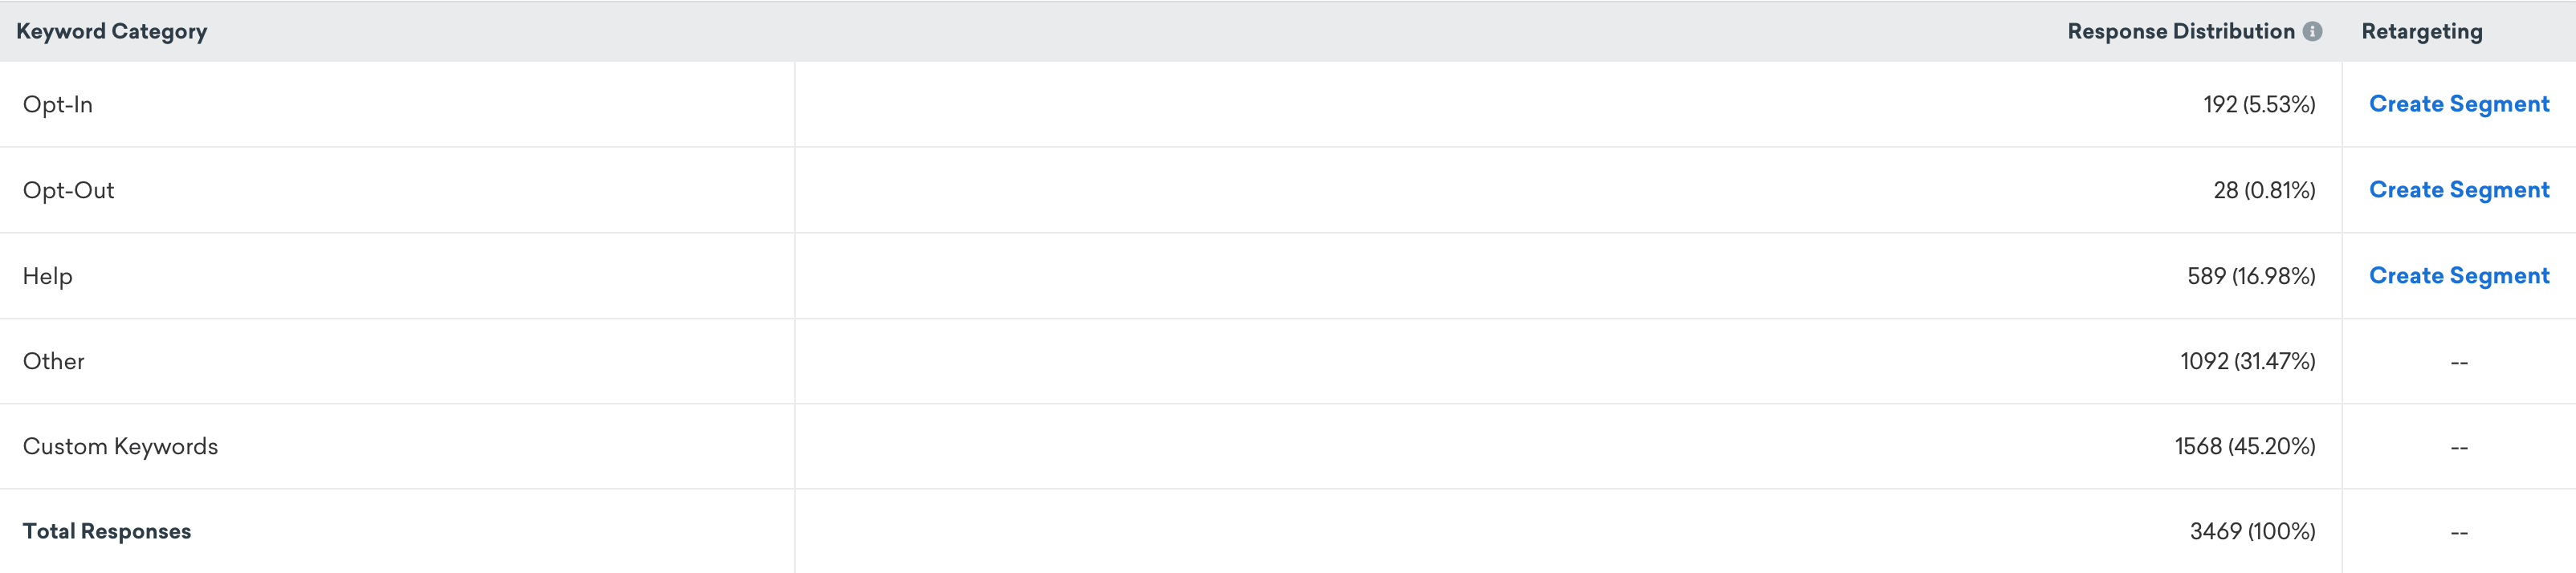
Here, you can also view the response distribution of each keyword category to determine next steps for retargeting and to conveniently create a segment.
SMS Currents events
Like email, Braze receives user-level events related to an SMS message as it makes its journey to a user. Any inbound SMS event will also be sent as a Currents event through the SMS InboundReceived event. This allows you to perform additional actions or reporting on the messages your users are texting in outside of the Braze platform.
Inbound messages are truncated past 1,600 characters.
Dashboard click metrics such as Total Clicks exclude suspected bot activity, but Currents still exports all click events with is_suspected_bot_click and suspected_bot_click_reason for warehouse reconciliation. For affected dashboard metrics, segmentation, and orchestration, see Bot click filtering for SMS/RCS links.
Track SMS opt-ins and opt-outs
You can track SMS opt-ins and opt-outs with the following methods:
| Method | Description |
|---|---|
| Segmenter | The segmenter displays the number of users in a specific Subscription Group. It does not deduplicate by phone number—if multiple users share the same phone number, each instance is counted separately. |
| Subscription group timeseries | Provides a daily snapshot of subscriptions for email and phone numbers. The timeseries counts subscriptions, unsubscribes, and resubscribes. For example, if a user subscribes, unsubscribes, and then resubscribes, they are counted as one subscribed user. |
| Currents | Use Currents to export subscription and engagement events for your own reporting. |
Opt-in and opt-out counts in campaign analytics
The Opt-In and Opt-Out statistics in the SMS/MMS/RCS Performance panel reflect users opting in or out through inbound keywords (for example, texting “START” for opt-in or “STOP” for opt-out). These numbers are typically lower than what is shown in the segmenter, as they count the number of times these keywords were texted, not the total number of users subscribed to SMS.
Opt-in, opt-out, and HELP counts are reported for SMS, MMS, and RCS combined.
Track SMS campaign opt-outs
Track SMS opt-outs at the campaign level by using the inbound receive table instead of the subscription group state change table. For example, in Query Builder or your data warehouse, you can run a query that references the USERS_MESSAGES_SMS_INBOUNDRECEIVE or USERS_MESSAGES_SMS_INBOUNDRECEIVE_SHARED table.
This example query references the USERS_MESSAGES_SMS_INBOUNDRECEIVE table:
SELECT *
FROM USERS_MESSAGES_SMS_INBOUNDRECEIVE
WHERE app_group_id = 'app-group-id'
AND subscription_group_api_id = 'subscription_group_api_id'
AND action = 'Unsubscribed'
AND (campaign_id IS NOT NULL OR canvas_id IS NOT NULL);
This returns users who opted out of SMS communications for the given workspace and subscription group, filtered to those associated with campaigns or Canvases.
Opt-out timing
Keyword and inbound-message events in Currents or your data warehouse, such as timestamps on users.messages.sms.InboundReceive or subscription group state change events, are the authoritative source for when Braze recorded the opt-out.
Event timestamps reflect when Braze received or processed the inbound message, not necessarily when the user sent the SMS or when a carrier or SMS provider received it. If your analysis treats opt-outs as when Braze processed the inbound opt-out path, these timestamps match that definition.
The user profile shows current subscription state but may not surface a single “SMS unsubscribed at” field unless you set a custom attribute or similar when processing opt-outs.
Charges applied to SMS sending outcomes
This table reflects Braze billing, not your provider’s billing. Outcomes that are not charged by Braze may be charged by your provider.
| Outcome | Definition | Charged by Braze |
|---|---|---|
| Sent | A campaign or Canvas step has launched or triggered, and an SMS payload has been sent to the SMS provider. | No charge |
| Delivery Failed | The SMS payload couldn’t be sent to the SMS provider. This can occur due to overflowing queues, suspended accounts, or media errors (in the case of MMS). | No charge |
| Delivered | The SMS provider received confirmation of message delivery from the upstream carrier (and, where available, from the destination device). | Charge |
| Rejected | The SMS provider received a rejected receipt indicating that the message wasn’t delivered. This can happen for several reasons, including carrier content filtering or availability of the destination device. | Charge |
| Sends to Carrier | Sends to Carrier is the sum of Confirmed Deliveries, Rejections, and Sends where delivery or rejection wasn’t confirmed by the carrier. This includes instances where carriers don’t provide delivery or rejected confirmation, as some carriers don’t provide this confirmation or can’t do so at the time of send. Deprecated for new dashboards, but continues to be supported for users that already have it. Some dashboards may still label this metric as Sent to Carrier. |
Charges may apply based on individual message sending outcomes |
Sends to Carrier is deprecated for new dashboards. Use Sent, Confirmed Delivery, Delivery Failed, and Rejections for current reporting. See the Report Metrics Glossary for definitions.
RCS Card message reporting
For Card RCS messages, Total Clicks in campaign and Canvas analytics includes card button taps (such as Message reply and Open URL) and suggestion interactions. The metric may increment more than once if a user taps the same control multiple times.
Card button and suggestion clicks aren’t tracked through link shortening or advanced tracking settings for shortened URLs. User retargeting filters that reference shortened SMS links don’t apply to card button interactions.
For user-level interaction data, export RCS Click events (users.messages.rcs.Click) through Currents. These events include fields such as interaction_type and element_type to distinguish button taps from suggestions.
RCS and SMS fallback metrics
Braze reports RCS separately from SMS and MMS throughout the dashboard. If an RCS message can’t be delivered and falls back to SMS, Braze records the RCS attempt and the fallback SMS separately, so you can see how many recipients received each.
You can find RCS metrics in:
- SMS/MMS/RCS Performance: RCS and SMS fallback metrics, the Performance Over Time chart, and opt-in and opt-out tiles.
- Home page: the Performance Over Time chart.
- Campaign Analytics: the Performance Over Time chart, the Statistics filter for comparing SMS and RCS variants, and the SMS/MMS/RCS Performance table with separate RCS and SMS fallback rows.
- Canvas: the message step Details page and the step summary.
- Messaging History: RCS events and fallback SMS on the user profile.
- Report Builder: RCS metrics alongside SMS.
For event-level behavior (including IS_SMS_FALLBACK=TRUE), see How SMS fallback works with events and segmentation.
How metrics treat SMS fallback
| Metric | Includes SMS fallback? |
|---|---|
| Sends | No. Sends counts the RCS send attempt. The fallback SMS is counted separately as an SMS send. |
| Deliveries | Yes. RCS Delivery Rate includes messages delivered as SMS fallback, divided by total RCS Sends. |
| Rejections | Yes. RCS Rejection Rate includes SMS fallback rejections, divided by total RCS Sends. |
| Clicks | Click Rate uses RCS Clicks divided by RCS Deliveries. |
| Reads | No. Read Rate counts RCS messages only. |
RCS Delivery Rate and Rejection Rate include messages that were delivered or rejected as SMS fallback. Read Rate counts RCS messages only. For tile-level formulas, see the SMS/MMS/RCS performance dashboard.
Rejections and delivery failures
RCS and SMS don’t split failure outcomes the same way:
- For RCS, failed or undelivered provider statuses increment Rejections. Braze doesn’t report those carrier outcomes as Delivery Failures for RCS.
- For SMS and SMS fallback, Delivery Failures still cover failures before the provider accepts the message, such as queue overflow, and Rejections cover provider rejection receipts.
When a campaign or Canvas table shows RCS and SMS fallback sub-rows, expect rejections on the RCS row for failed RCS sends, and delivery-failure or rejection metrics on the SMS fallback row for the fallback SMS outcome.
Dashboard campaign analytics and Snowflake exports can differ slightly in timing and aggregation. For warehouse reconciliation, treat Snowflake or Currents event streams as the more granular source when metrics do not match the dashboard exactly.
Reconcile Rejections with Snowflake or Currents
The Rejections metric in the dashboard is an aggregate workspace count. It isn’t a row-level export, so you can’t always match each rejection to a single row in Snowflake or a single users.messages.sms.Rejection event in Currents. For example, if the user profile was deleted before Braze finished processing the rejection for warehouse export, that rejection doesn’t appear in your USERS_MESSAGES_SMS_REJECTION_SHARED table or Currents payload, while aggregate SMS reporting can still reflect the outcome. For more information, see the SQL table reference and SMS Rejection events in the Currents event glossary.
Webhook reporting
Control groups
To measure the impact of an individual webhook message, you can add a control group to an A/B test. The top-level Campaign Details panel doesn’t include metrics from the Control Group variant.
Webhook Performance
The Webhook Performance panel outlines how well your message has performed across various dimensions. The metrics in this panel vary depending on your chosen messaging channel, and whether or not you are running a multivariate test. You can click on the Preview icon to view your message for each variant or channel.

If you want to simplify your view, click Add/Remove Columns and clear any metrics as desired. By default, all metrics are displayed.
Webhook metrics
Here are some key webhook metrics you may see in your analytics. To see th full definitions of all webhook metrics used in Braze, refer to our Report Metrics Glossary.
| Metric | Definition |
|---|---|
| Unique Recipients | Unique Recipients is the number of unique daily recipients, or users who received a new message in a day. For this count to increment for a user more than once, the user must receive a new message on a different day. |
| Sends | Sends is the total number of messages sent in a campaign. After launching a scheduled campaign, this metric will include all messages sent, regardless of whether they have been sent out yet due to rate limiting. This doesn’t mean the message was received or delivered to a device, only that the message was sent. |
| Errors | Errors is the number of errors returned by webhook events (incremented during the sending process). |
WhatsApp reporting
The WhatsApp channel includes read rate. This metric is only delivered for users with read receipts on, which can vary.
Control groups
To measure the impact of an individual WhatsApp message, you can add a control group to an A/B test. The top-level Campaign Details panel doesn’t include metrics from the Control Group variant.
WhatsApp Performance
The WhatsApp Performance panel outlines how well your message has performed across various dimensions. The metrics in this panel vary depending on your chosen messaging channel, and whether or not you are running a multivariate test. You can click on the Preview icon to view your message for each variant or channel.

Credits versus send counts
WhatsApp send counts in campaign analytics reflect delivery attempts. Credits consumed may differ when Meta bills by message category (marketing, utility, authentication, service).
- Starting October 1, 2026, response messages composed in Braze consume Action Credits. Meta classifies them as service messages.
- Use Analytics > Daily Stats for directional send volume. Credit breakdowns per campaign or Canvas aren’t available.
If you want to simplify your view, click Add/Remove Columns and clear any metrics as desired. By default, all metrics are displayed.
WhatsApp metrics
Here are some key WhatsApp metrics you may see in your analytics. To see the full definitions of all WhatsApp metrics used in Braze, refer to our Report Metrics Glossary.
| Metric | Definition |
|---|---|
| Sends | Sends is the total number of messages sent in a campaign. After launching a scheduled campaign, this metric will include all messages sent, regardless of whether they have been sent out yet due to rate limiting. This doesn’t mean the message was received or delivered to a device, only that the message was sent. |
| Deliveries | Deliveries is the total number (or percentage) of message requests that are accepted by the receiving server. This doesn’t mean the message was delivered to a device, only that the message was accepted by the server. |
| Reads | Reads is when the user reads the message. The user’s read receipts must be “On” for Braze to track reads. |
| Failures | Failures are when the WhatsApp message couldn’t send because the internet service provider returned a hard bounce. A hard bounce signifies a permanent deliverability failure. |
If failures are elevated, see Investigate WhatsApp send failures.
End-user blocking and reporting metrics
Additional metrics may be accessed via the WhatsApp Manager dashboard, though confirmation of your access is necessary to access all available insights.
Meta analytics
In addition to Braze analytics, template-level analytics can be accessed in the WhatsApp Business Manager. For information, check out Meta’s documentation.
Historical performance
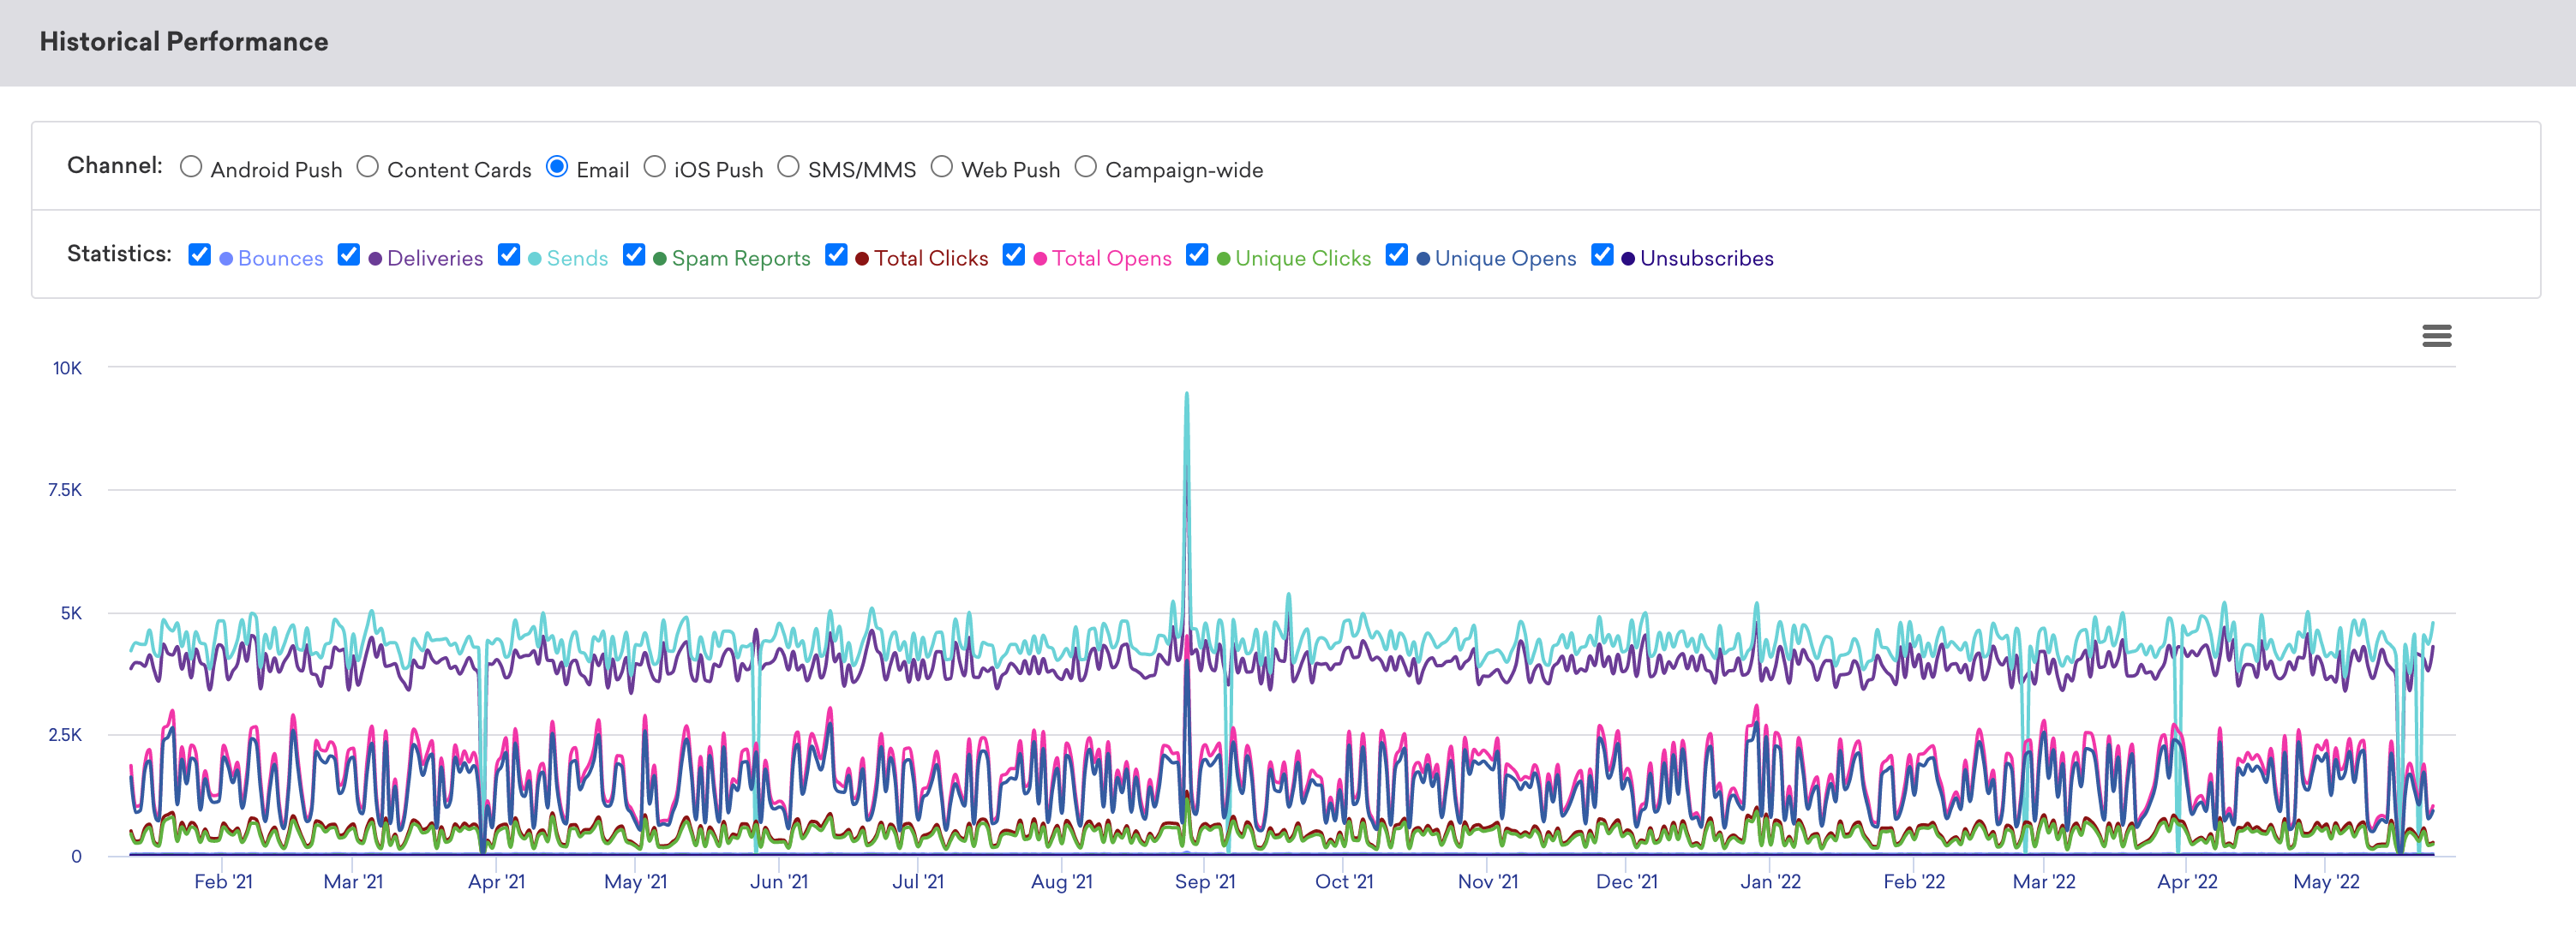
The Historical Performance panel allows you to view the metrics from the Message Performance panel as a graph over time. Use the filters at the top of the panel to modify the stats and channels shown in the graph. The time range of this graph will always mirror the time range specified at the top of the page.
To get a day-by-day breakdown, click the hamburger menu and select Download CSV to receive a CSV export of the report.
Conversion event details
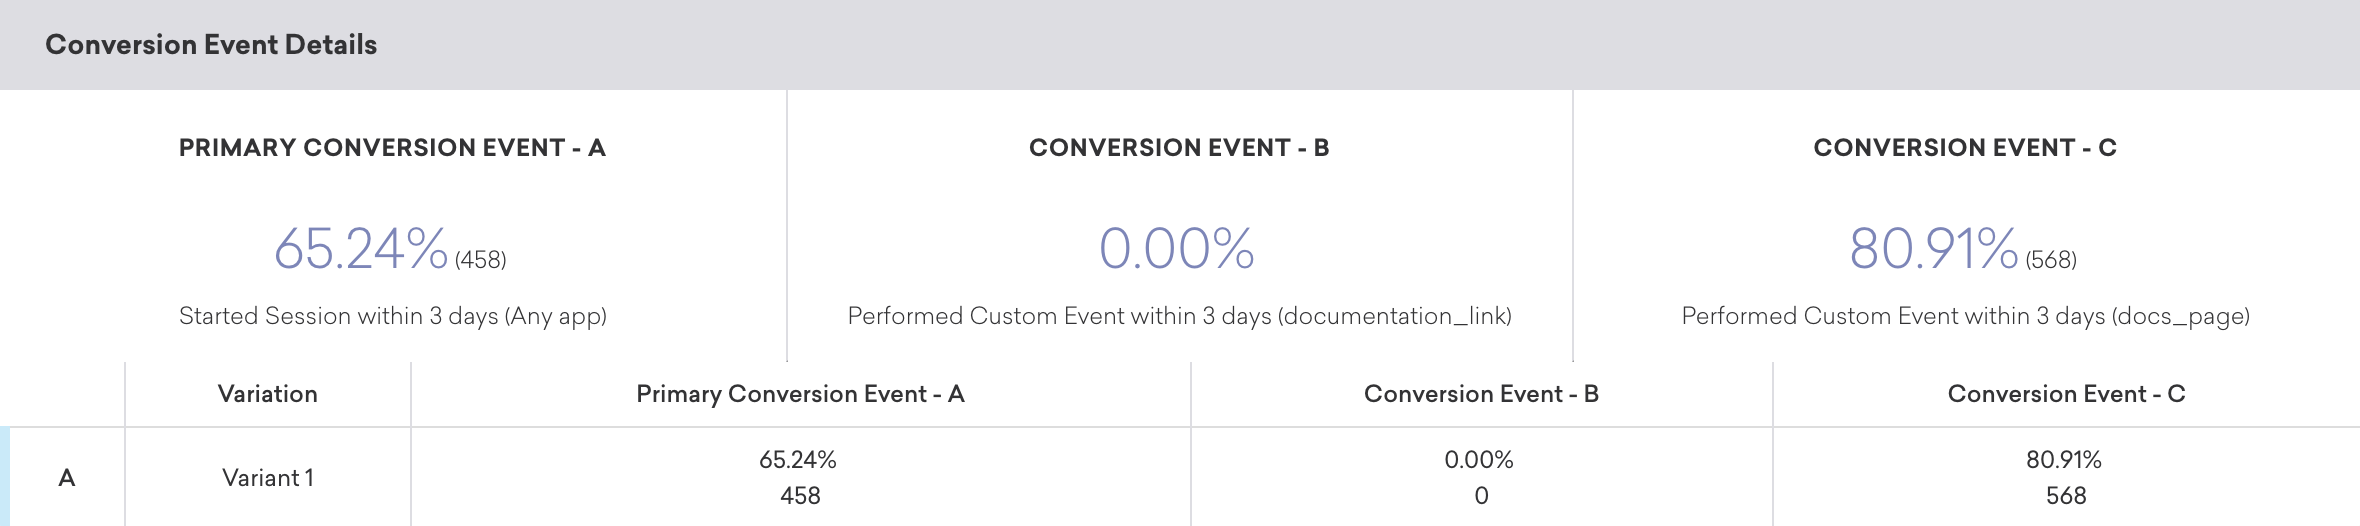
The Conversion Event Details panel shows you the performance of your conversion events for your campaign. For more information, refer to Conversion Events.
Conversion correlation
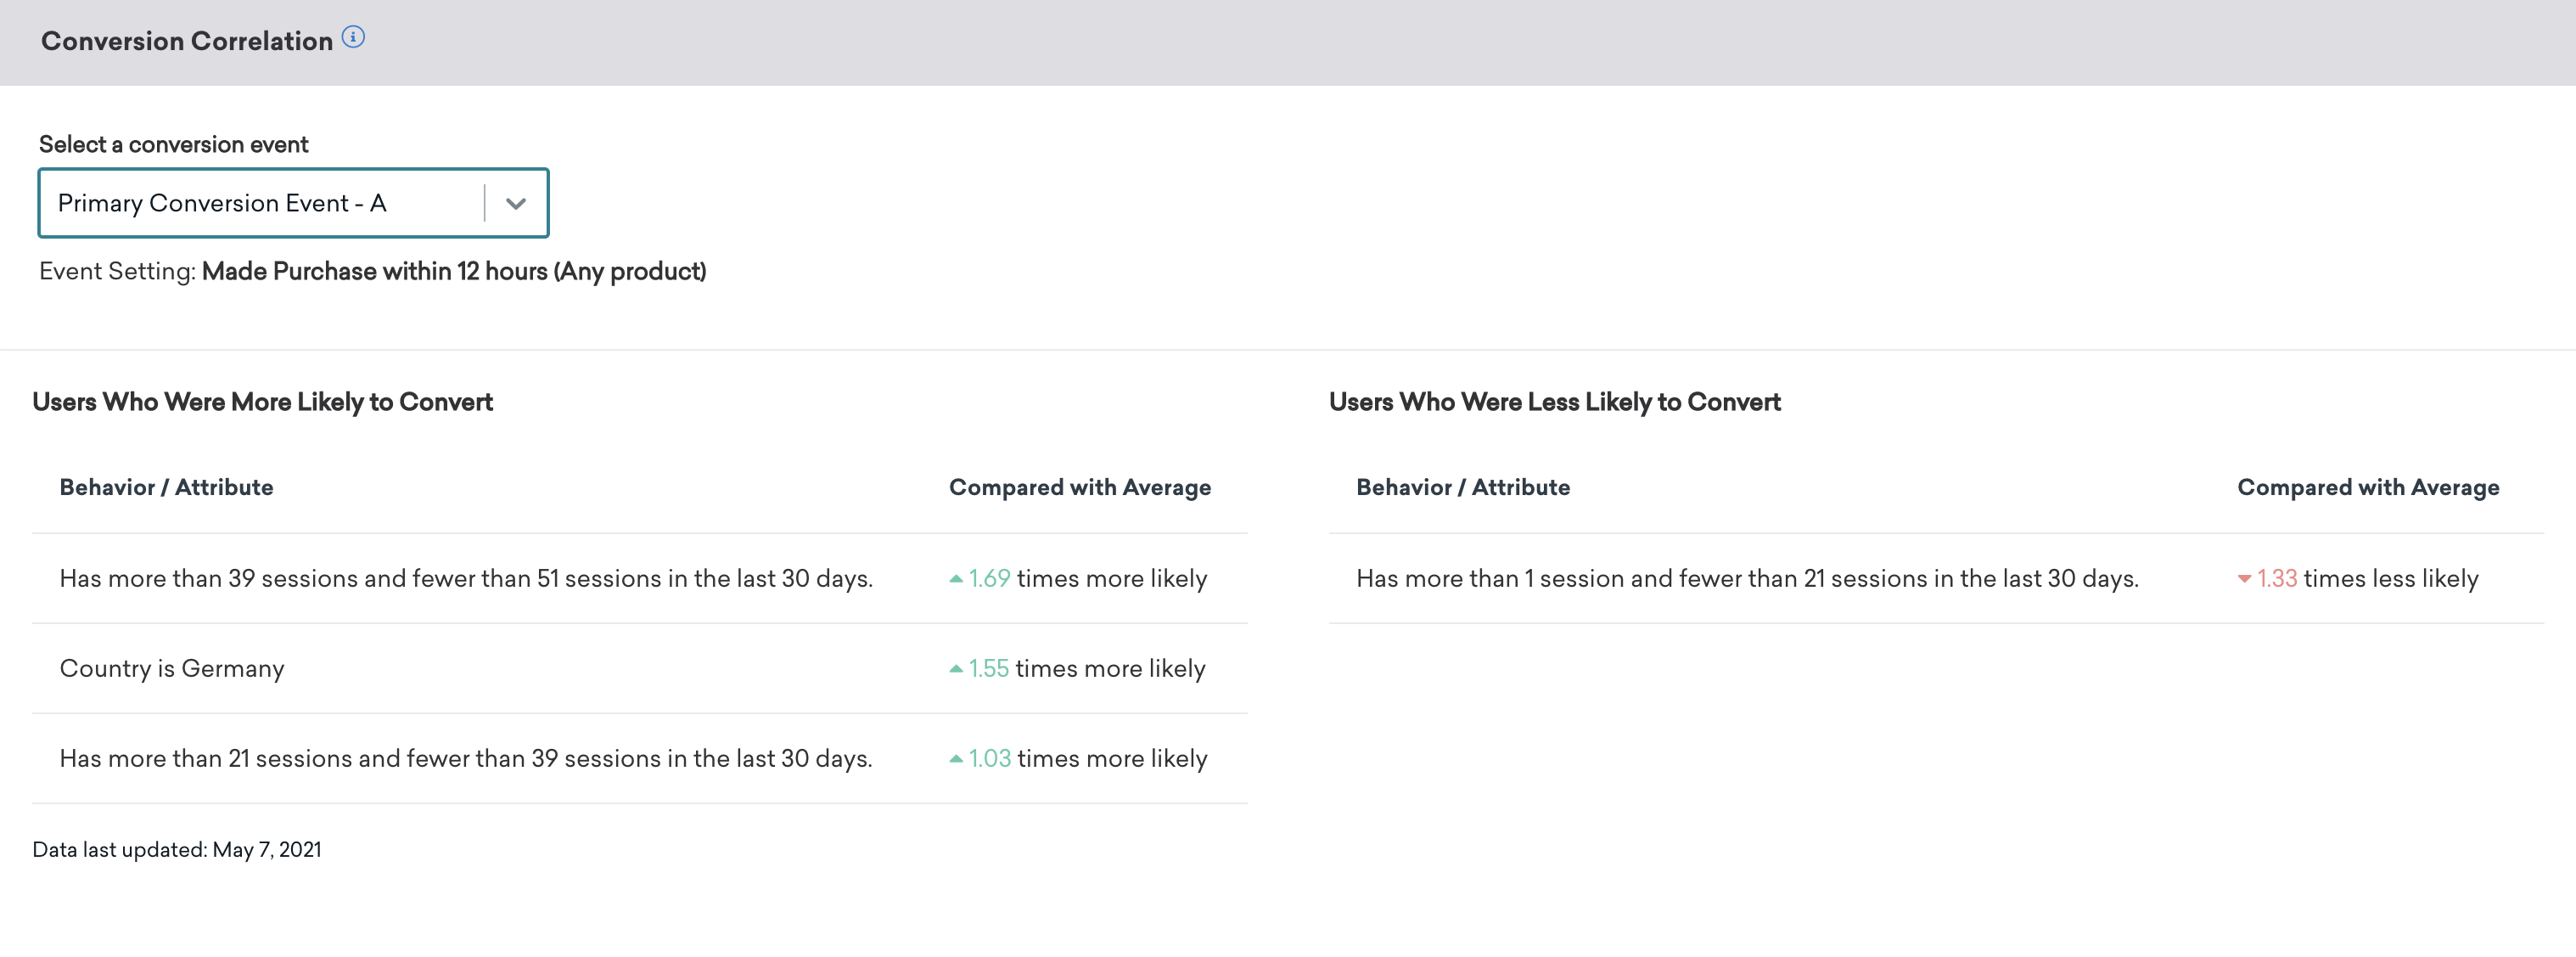
The Conversion Correlation panel gives you insight into what user attributes and behaviors help or hurt the outcomes you set for campaigns. For more information, refer to Conversion correlation.
Retention report
Retention reports show you the rates at which your users have performed a selected retention event over time periods in a specific campaign or Canvas. For more information, refer to Retention reports.
Funnel report
Funnel reporting offers a visual report that allows you to analyze the journeys your customers take after receiving a campaign or Canvas. If your campaign or Canvas uses a control group or multiple variants, you will be able to understand how the different variants have impacted the conversion funnel at a more granular level and optimize based on this data.
For more information, refer to Funnel reports.