 Segment Insights
Learn how to how to use, interpret, and share Segment Insights.
Segment Insights allows you to quickly see how one segment is performing compared to another across a set of pre-selected KPIs.
Viewing Segment Insights
Go to the Segment Insights page of your dashboard, under Analytics, and click Add Segment to view up to four different segments compared against a baseline.
If you are using the older navigation, you can find this page at Engagement > Segments > Segment Insights.
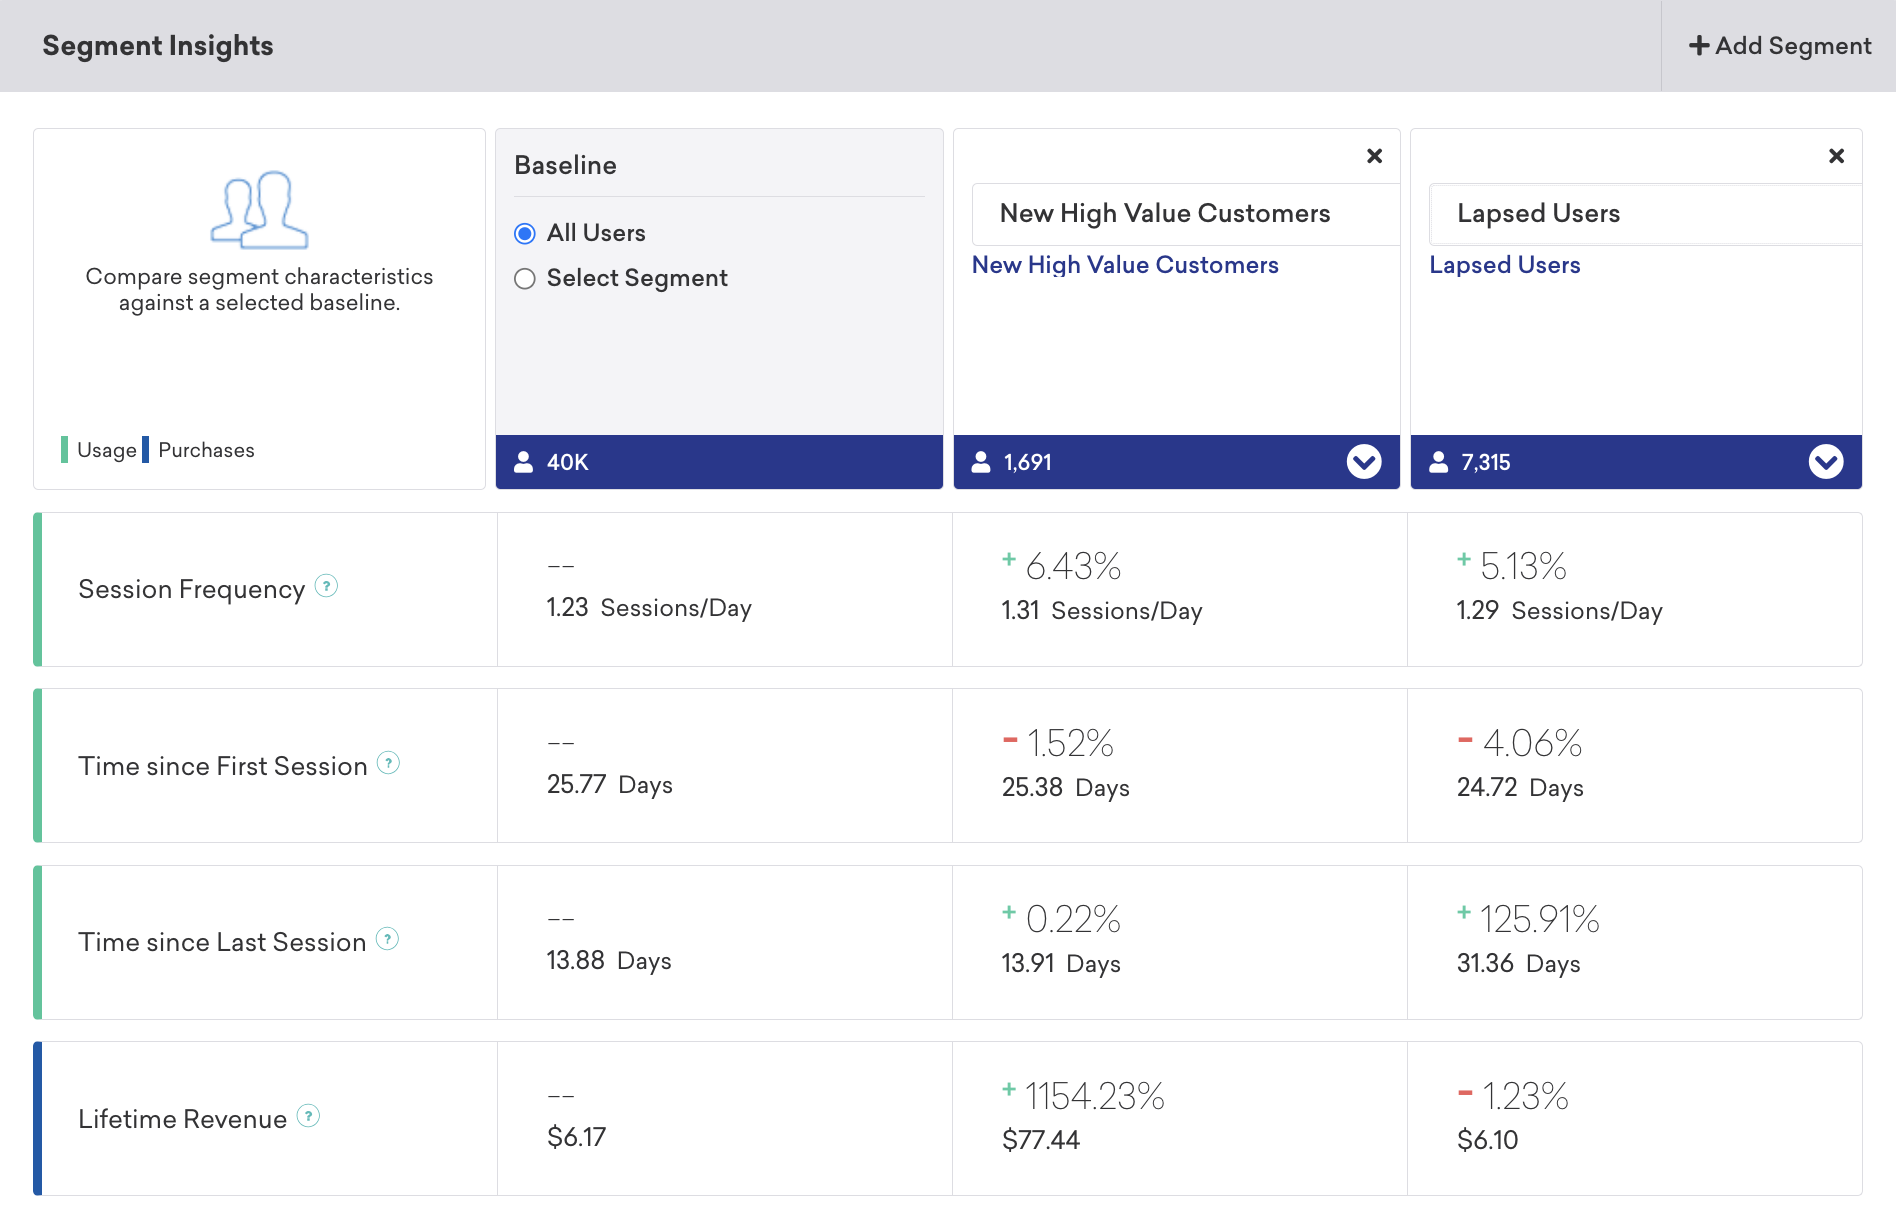
The baseline segment can either be a specific segment you select, or a segment containing all of your users. You can compare the following statistics using Segment Insights:
| Measurement | Description | Formula |
|---|---|---|
| Session Frequency | Average number of segment users’ sessions per day | (total # of sessions) / (# days since first session) |
| Time Since First Session | Average time between segment users’ first session and now | today – date of first session |
| Time Since Last Session | Average time between segment users’ last session and now | today – date of last session |
| Lifetime Revenue | Average lifetime revenue for segment users | user lifetime spend |
| Time to First Purchase | Average time between segment users’ first session and first purchase | date of first purchase – date of first session |
| Time Since Last Purchase | Average time between segment users’ last purchase and now | today – date of last purchase |
You can easily share specific comparisons with your teammates using the page’s unique URL, and you can also click beneath each segment to reveal more information about that segment. These comparisons will reset when you switch between workspaces.

Segment Details page
Segment Insights have also been built right into the Segment Details view. When looking at a particular segment you’ve previously set up, you can find the same six statistics outlined within the dynamic, gray Segment Statistics box. From here, you can quickly launch the Segment Insights tool to compare this particular segment with any others you’ve previously set up, but note that this will overwrite any segments you’ve previously selected within the Segment Insights tool.
Sample use cases
Comparing demographic usage and purchasing patterns
One of the best usages of Segment Insights is answering questions about the impact of user demographics on app usage and campaign effectiveness, such as:
- Are certain user demographics performing significantly better or worse than average?
- Should I rethink the localization of a particular campaign?
- Is a campaign engaging a certain demographic?
- What goals should I set for a campaign aimed at a certain demographic?
Segment Insights can help uncover differences between user demographics. The following example shows a comparison of an app’s user base by their language, illustrating how English speakers tend to have higher LTV and activity levels than speakers of other languages.
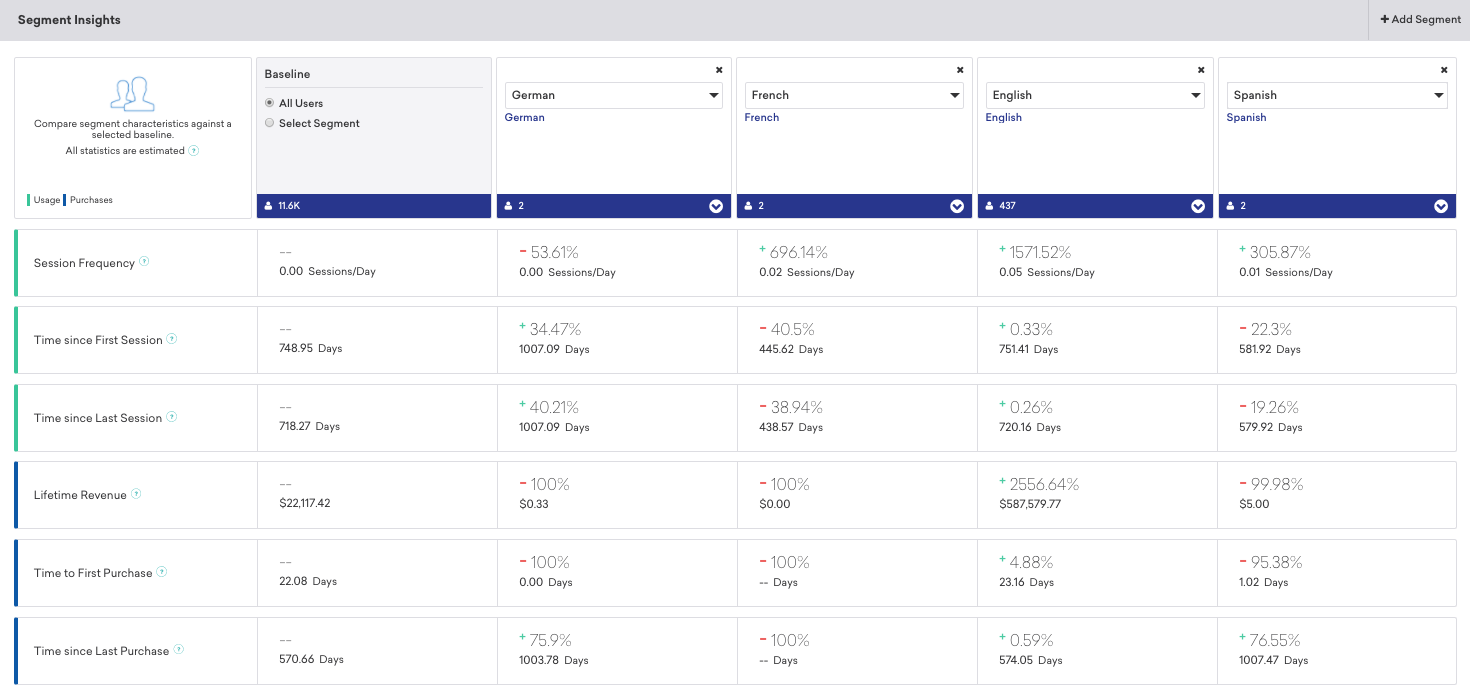
In this example, German speakers signed up longer ago on average, which might explain why they’re no longer as active. This could be due to a multitude of factor. For example if the app first launched in Europe but is now more popular in the US, where most people speak English or Spanish. For more robust findings, when analyzing KPIs across demographics, it’s sensible to test the findings from a general study of demographics (for example, if language impacts LTV in all users) by looking at a smaller, more similar population and seeing if the findings persist.
To improve conversions among speakers of languages other than English, a good first step would be to localize campaigns to the user’s device language and making sure that the copy of those messages is engaging users by using a multivariate campaign to test different versions of the foreign language copy.
Understanding indicators of higher revenue
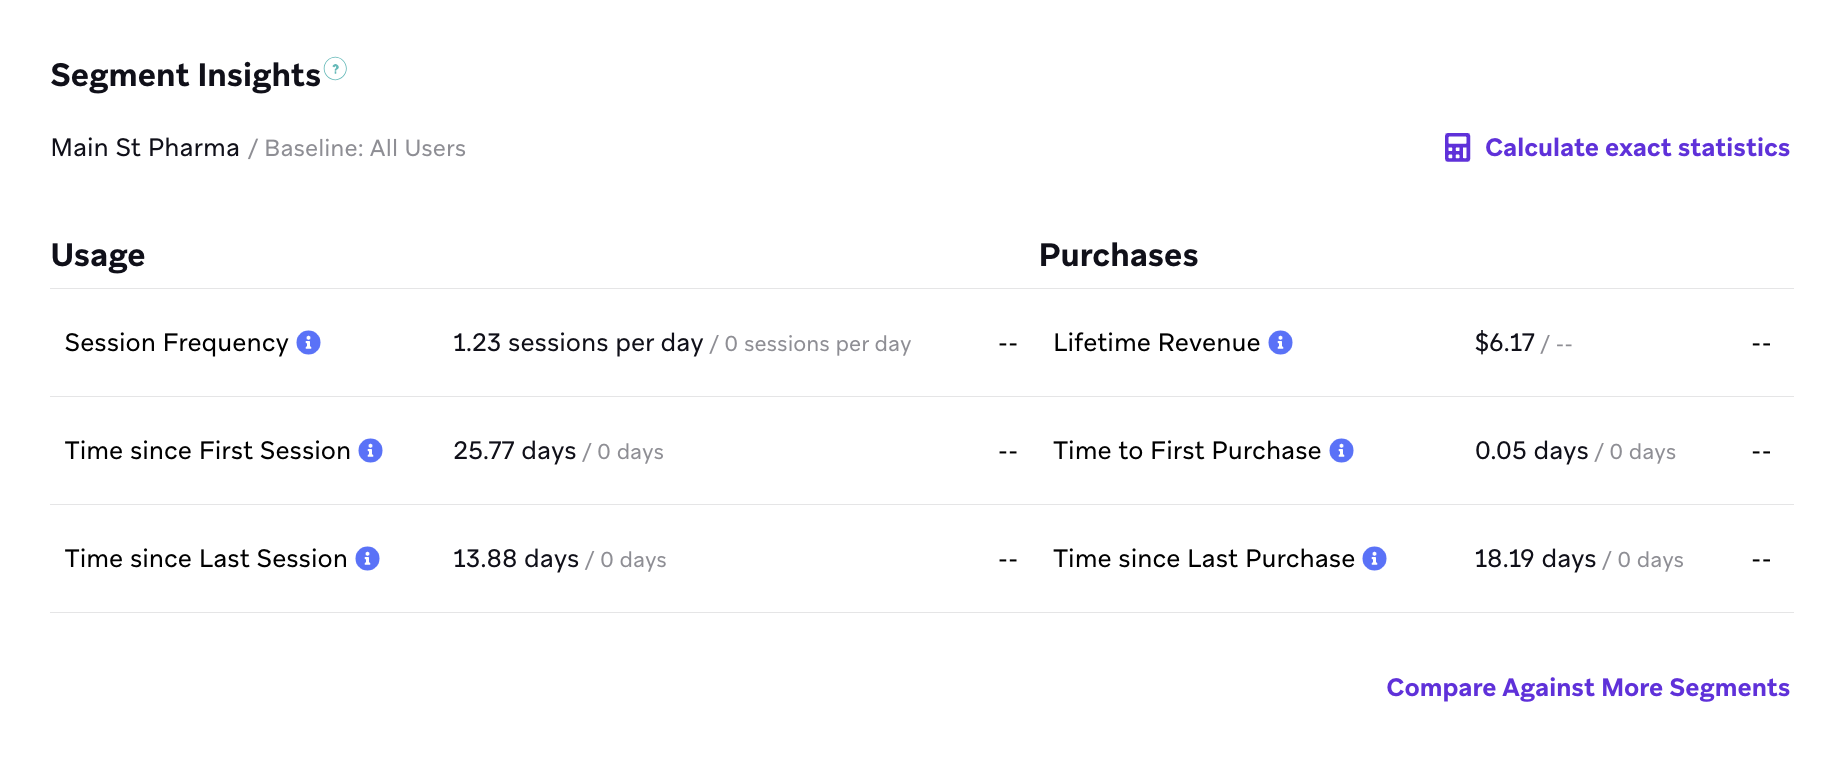
Getting users to convert to purchasers can be difficult, and trying to push new, inactive or disengaged users directly toward purchasing may lead the user to uninstall your app. Segment Insights can help you discover actions that lead users further down the purchase funnel without requiring them to purchase just yet, for example, adding items to their wish list, sharing on social media or favoriting content. For example, you can chart out the impact on purchases different behaviors within an ecommerce app.
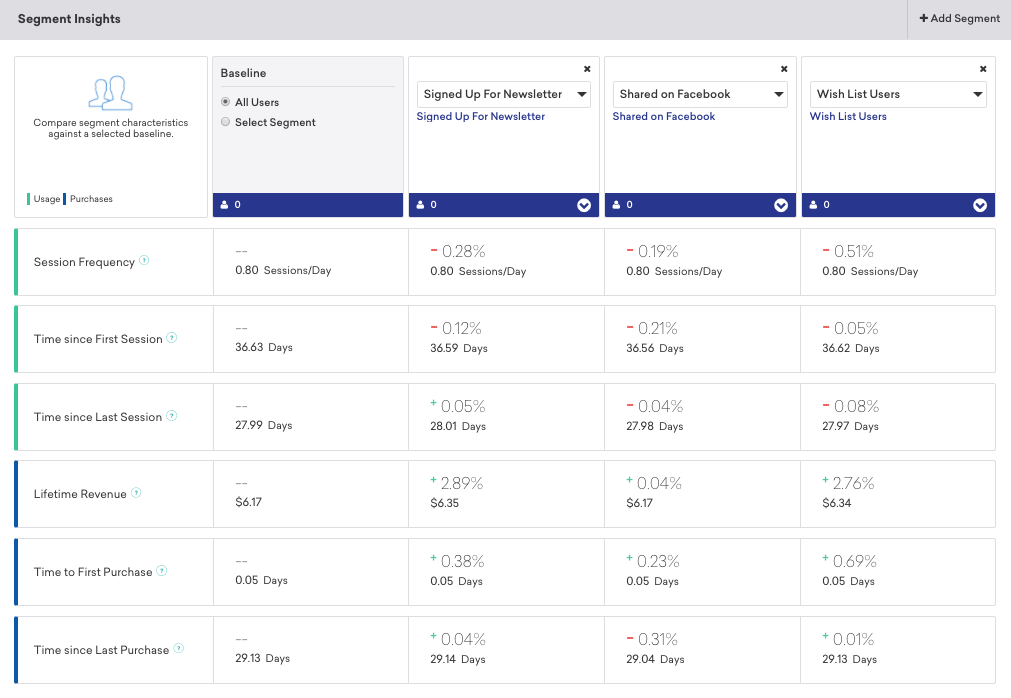
In this case, relatively few users are currently signed up for the newsletter, but these users are generally more active. To keep new users engaged, it would be a good idea to include an invitation to order the newsletter in onboarding campaigns. To re-engage lapsed users, a good plan would be to send out a typical lapsed user campaign and target users who converted with a subsequent campaign to sign up for the newsletter.
 Edit this page on GitHub