Global Control Group Report
The Global Control Group Report allows you to compare your group against a treatment sample. Your treatment sample is a random selection of non-control users, approximately the same number of users as your control, generated using the Random Bucket Number method.
To view a report for your Global Control Group from the dashboard, navigate to Analytics > Global Control Group Report.
If you are using the older navigation, this page can be found under Data.
Next, select the parameter you wish to run your report with (sessions or a particular custom event) and click Run Report.
About your report
When generating your report, choose an event—either sessions or any custom event—to compare across your treatment and control groups. Then choose a time period for which to view data for. Keep in mind that if you’ve saved multiple control group experiments at different time periods, you should avoid including data from more than one experiment in your report.
Keep in mind that the percentage metrics in your report are rounded. For instance, in cases where the number of conversions is a very low percentage of your overall control or treatment group, the conversion rate may round to 0%.
Lastly, as with several other reports on our platform, this report displays a confidence percentage for your change from control metric. Note that in cases where the conversion rate between your control and treatment are identical, a confidence of 0% is to be expected; this indicates that there is a 0% chance that there is a difference in performance between the two groups.
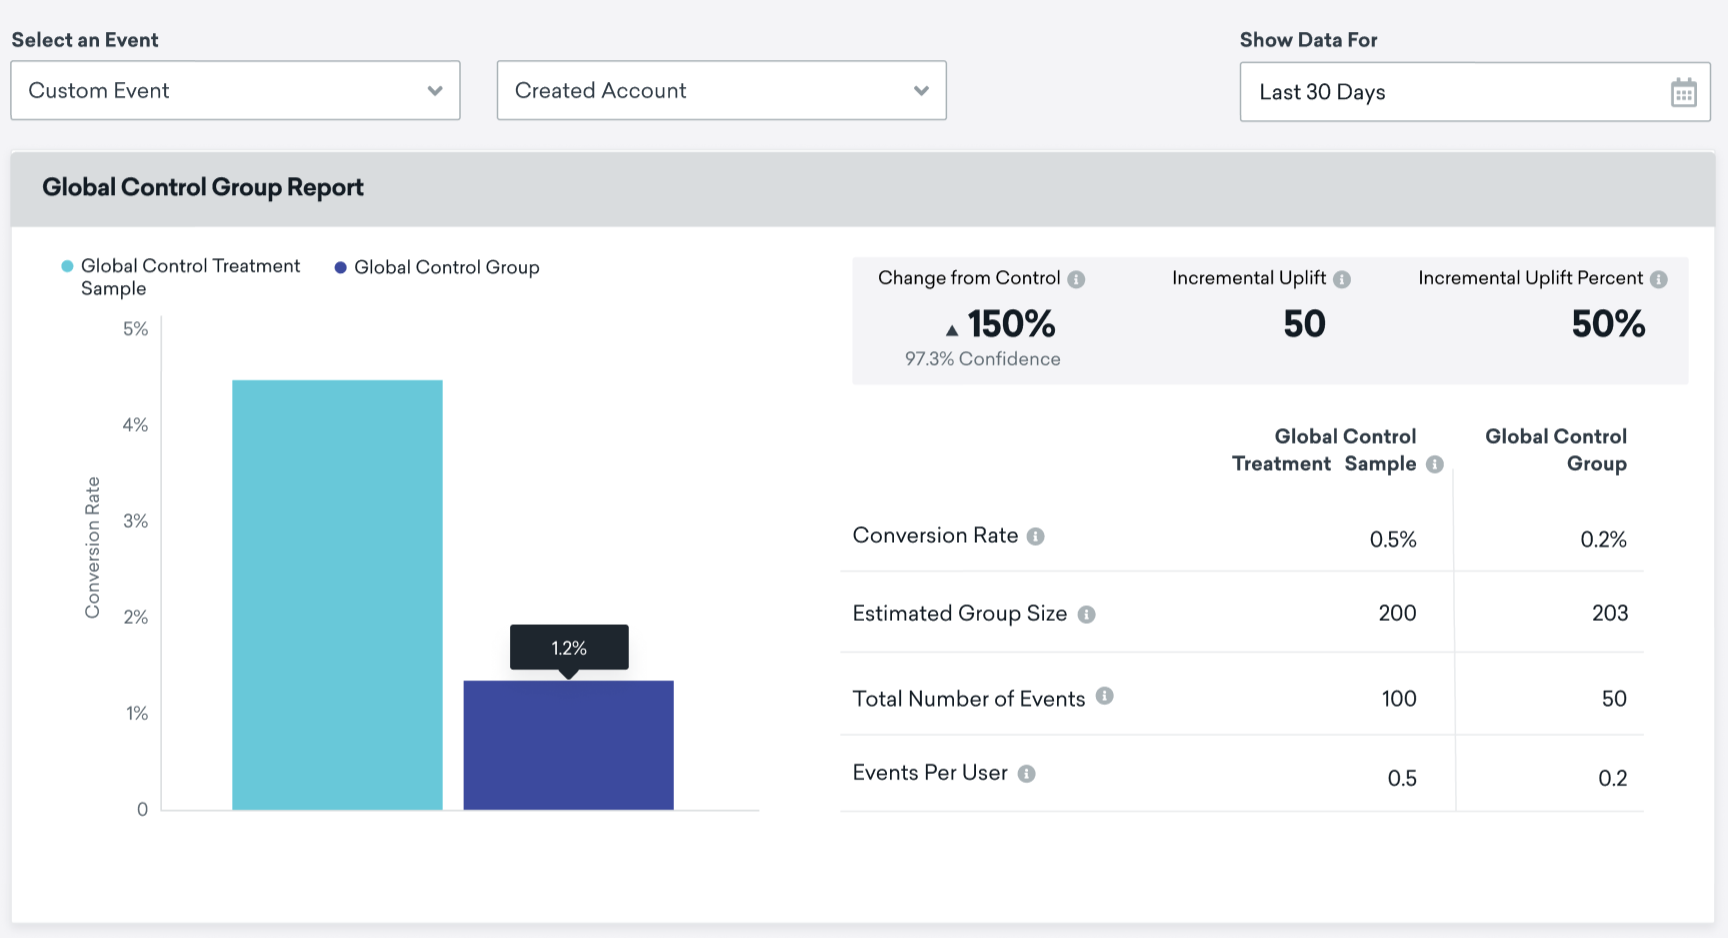
Report metrics
| Metric | Definition | Calculation |
|---|---|---|
| Change from Control | This calculates the uplift between the conversion rate for your treatment and control groups. | ((Treatment conversion rate – control conversion rate) ÷ control conversion rate) * 100 |
| Incremental Uplift | The difference in total events between your treatment and control groups. This metric seeks to answer the question of “How many more conversion events did the treatment group achieve?”. | Total events for treatment – total events for control |
| Incremental Uplift Percent | The percentage of your treatment’s total events that can be attributed to your treatment (versus natural user behavior). This is calculated by dividing incremental uplift (number) by the total number of events for your treatment group. | Incremental uplift (number) ÷ Total events for treatment group |
| Conversion Rate | On average, the percentage of users in your control or treatment group that complete your selected event each day during the chosen time period. If the number of conversions is very small and your control or treatment groups are very large, then the conversion rate may round to 0%. | Average (mean) of the percent of users that perform your selected event each day during the chosen time period. |
| Estimated Group Size | The estimated number of users in your control and treatment groups during selected time period. | The maximum membership size your control and treatment groups reached during the time period you chose for the report. |
| Total Number of Events | The total number of times the selected event occurred during the chosen time period. This is not unique (for example, if a user performs an event twice during the time period, the event gets incremented twice). | Sum of the number of times an event occurred each day during the chosen time period. |
| Events Per User | The estimated average number of times users in each group completed your conversion events during the selected time period. | Total events ÷ estimated group size. |
 Edit this page on GitHub