Canvas analytics
You need to know if what you’re building is moving the needle. With Canvas analytics, you can build a complete picture to understand how the experiences you’re building are impacting your goals.
Once you build your Canvas and set it live, navigate to the Canvas page and select your Canvas to open the details page. Here, you can measure and test the performance of your Canvas.
Canvas overview
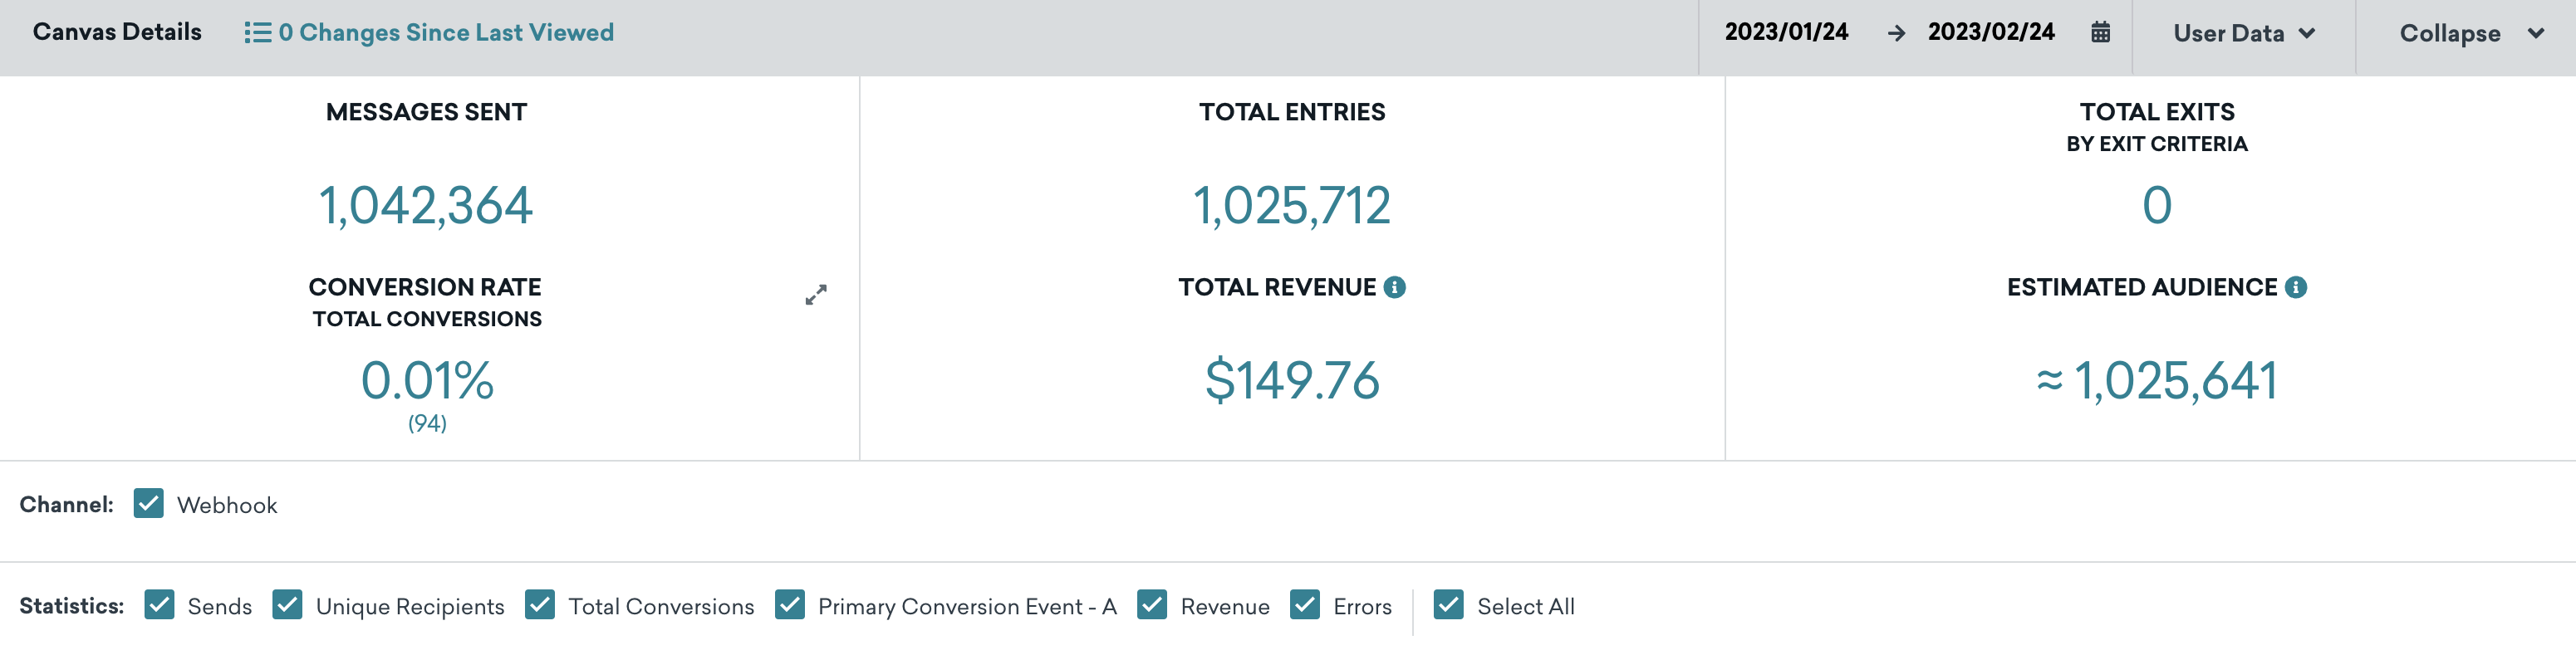
The top of the Canvas Details page contains top-line Canvas statistics. These include the number of messages sent within the Canvas, the total number of times customers have entered the Canvas, how many have converted and your total rate, the revenue generated by the Canvas, and the estimated total audience.
This is a great place to get a high-level overview to check how your Canvas is performing against your goal.
Changes Since Last Viewed
The number of updates to the Canvas from other members of your team is tracked by the Changes Since Last Viewed metric on the Canvas overview page. Select Changes Since Last Viewed to view a changelog of updates to the Canvas name, schedule, tags, message, audience, approval status, or team access configuration. For each update, you can see who performed the update and when. You can use this changelog to audit changes to your Canvases.
Performance visualization
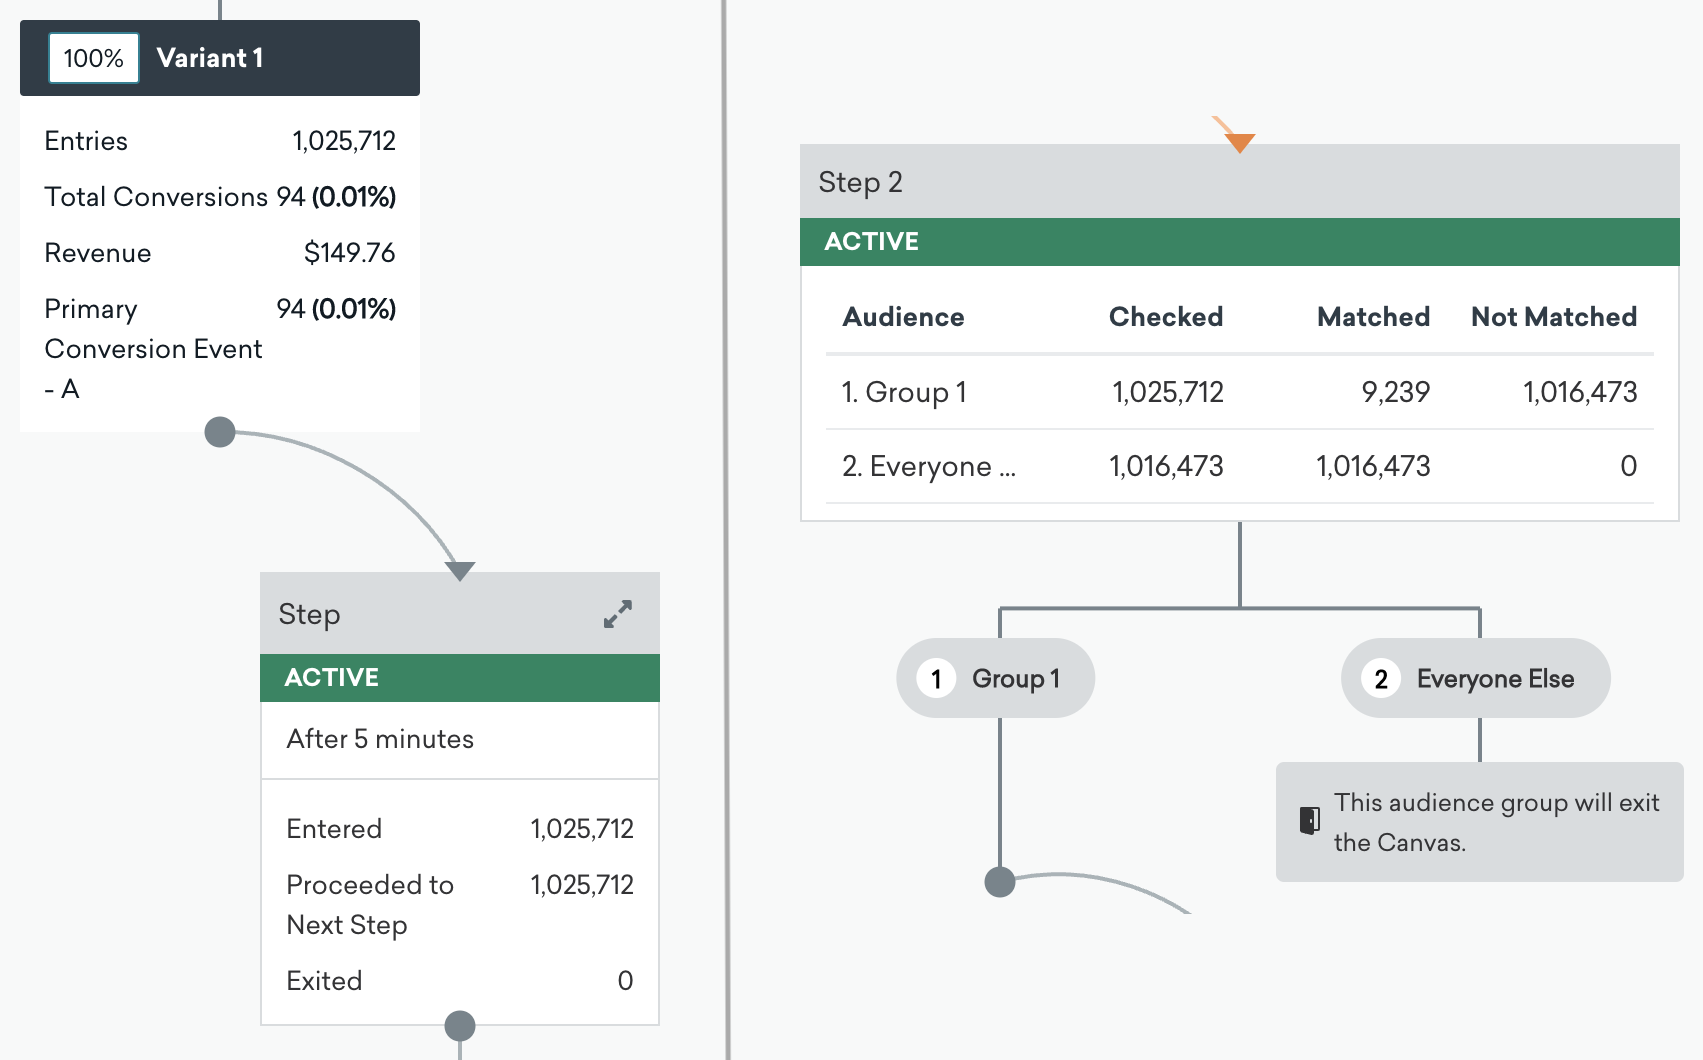
As you move down the Canvas Details page, you can see the performance for each component such as how many users entered, proceeded to the next step, or exited the Canvas.
For Canvas Flow, a user will exit the Canvas after entering and receiving the message payload in the last step of the user journey.
The metrics also include impressions, unique recipients, conversion count, and revenue generated. You can click on a component to further breakdown your data and see channel-specific performance.
Performance breakdown by variant
At the bottom of the Canvas Details page, click Analyze Variants to open the Analyze Canvas modal. This modal contains three tabs:
- Analyze Variants
- Canvas Funnel Report
- Canvas Retention Report
Analyze Variants
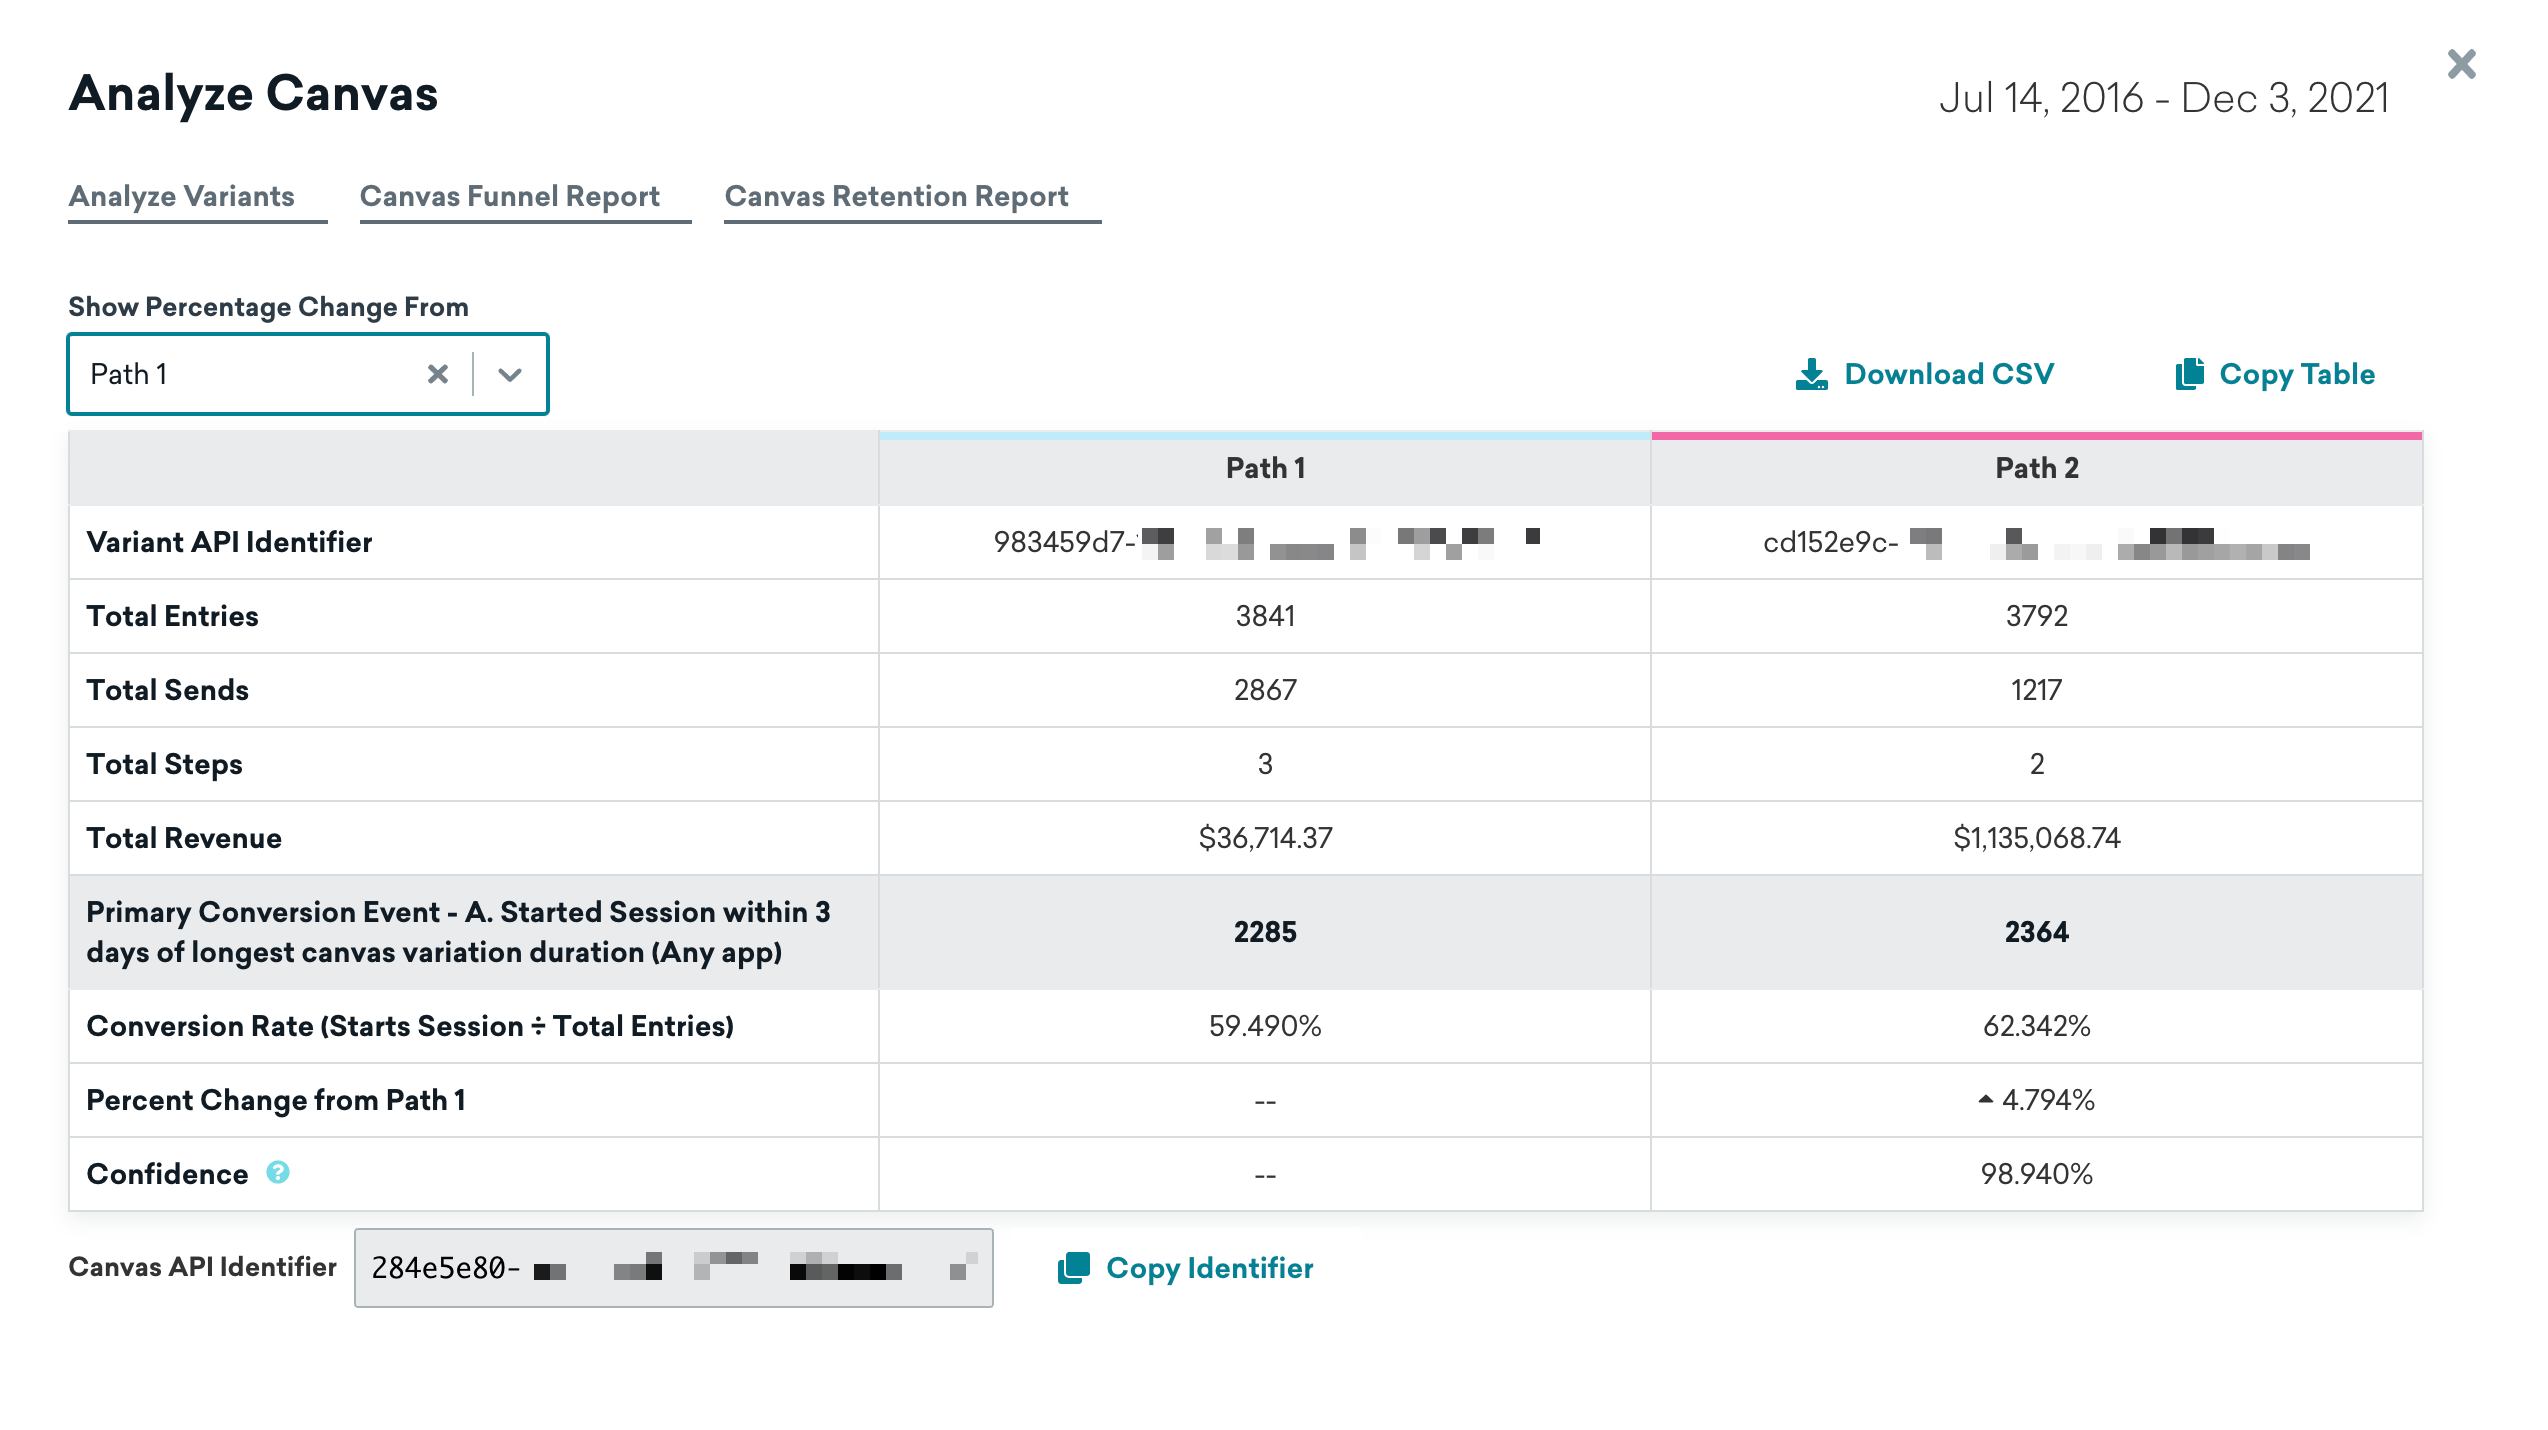
In the Analyze Variants tab, you can see a breakdown of performance by variant and control group, if you have more than one. You can also copy the Canvas API identifier, download a CSV file of the metrics, and copy the cells. The Analyze Variants tab contains a table which shows you a breakdown of each variant at several levels.
You can quickly infer effective variants and identify the right cadences, content, triggers, timing, and more.
Basic metrics include the following:
- Variant API Identifier: The API identifier of your variant, which you can use in your API calls.
- Total Entries: The total number of users that have entered the Canvas variant.
- Total Sends: The total number of messages sent in the Canvas variant.
- Total Steps: The total number of steps in the Canvas variant.
- Total Revenue: The total revenue in dollars from Canvas recipients within the set primary conversion window.
Like conversions, revenue is technically tracked at the Canvas level, but is attributed to the most recent component and most recent variant from which the user has received a message (or entered, if they haven’t received a message yet).
For example, if a user completes two steps and then makes a purchase, that revenue is attributed to the second component, and to the variant they entered. If they enter the Canvas but make a purchase before receiving the first Canvas component, that revenue is attributed to the variant they entered, but not to any component.
Beyond that, you can see a more explicit breakdown of conversion events, including the following:
- Conversion totals and conversion rates for each conversion event
- Uplift against the control variant
- Statistical confidence for each conversion event
Funnel report
Funnel reporting offers a visual report that allows you to analyze the journeys your customers take after receiving a Canvas. If your Canvas uses a control group or multiple variants, you’ll be able to understand how the different variants have impacted the conversion funnel at a more granular level and optimize based on this data. For more information on funnel reports, see Funnel reports.
Retention report
User retention is one of the most important metrics for any marketer. Keeping engaged users coming back for more indicates that business is healthy. Braze now allows you to measure user retention right on the Canvas Analytics page. For more information on how to read and interpret your retention report, check out Retention reports.
 Edit this page on GitHub