Funnel reports
Funnel reporting offers a visual report that allows you to analyze the journeys your customers take after receiving a campaign or Canvas.
If your campaign or Canvas uses a control group or multiple variants, you can understand how the different variants have impacted the conversion funnel at a more granular level and optimize based on this data.
Funnel report setup
You can run Funnel Reports for existing active campaigns and Canvases. These reports show a series of events that a campaign recipient progresses through over a period of 1–30 days from the date they received the message. A user is considered converted through a step in the funnel if they perform the event in the specified order.
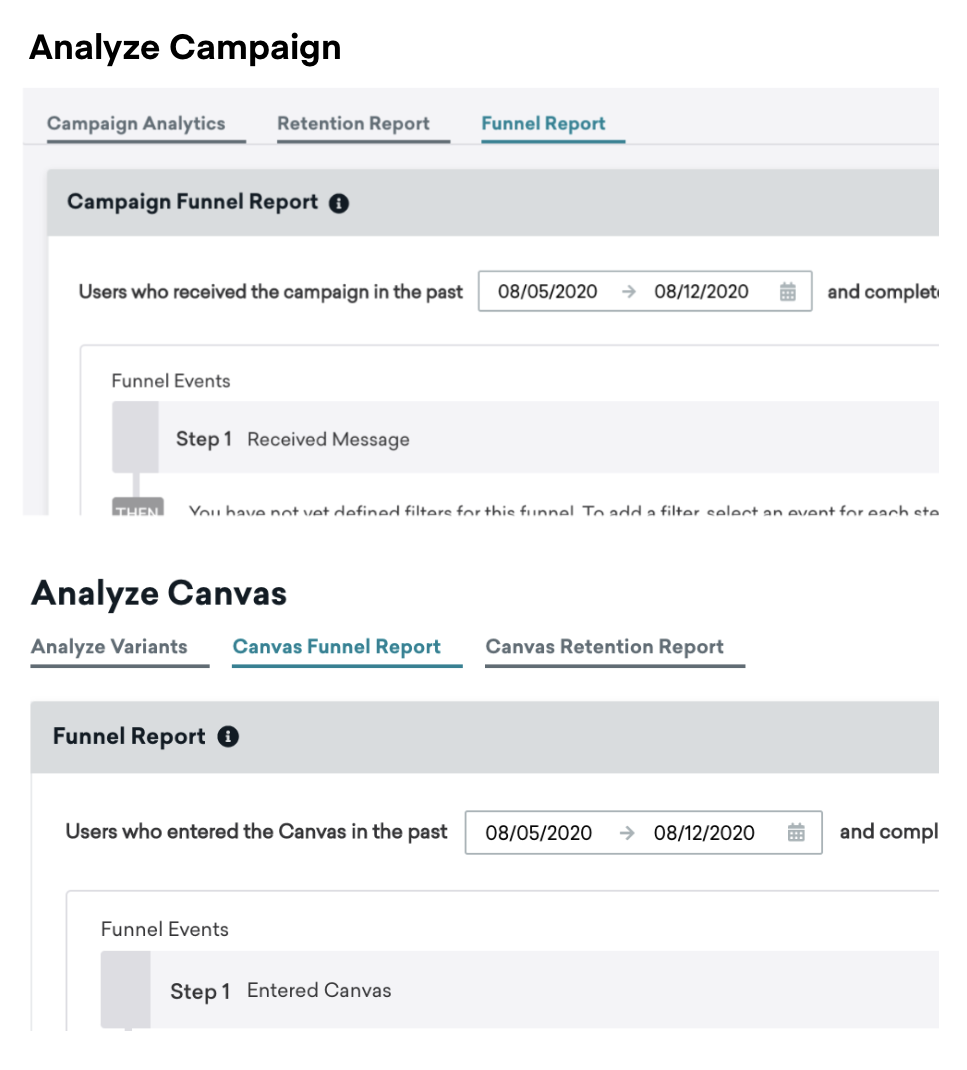
Funnel reporting is available from the following locations in the dashboard:
- The Campaign Analytics page for a specific campaign
- The Canvas Details page for a specific Canvas, via the Analyze Variants button
Funnel Reports are not available for API campaigns.
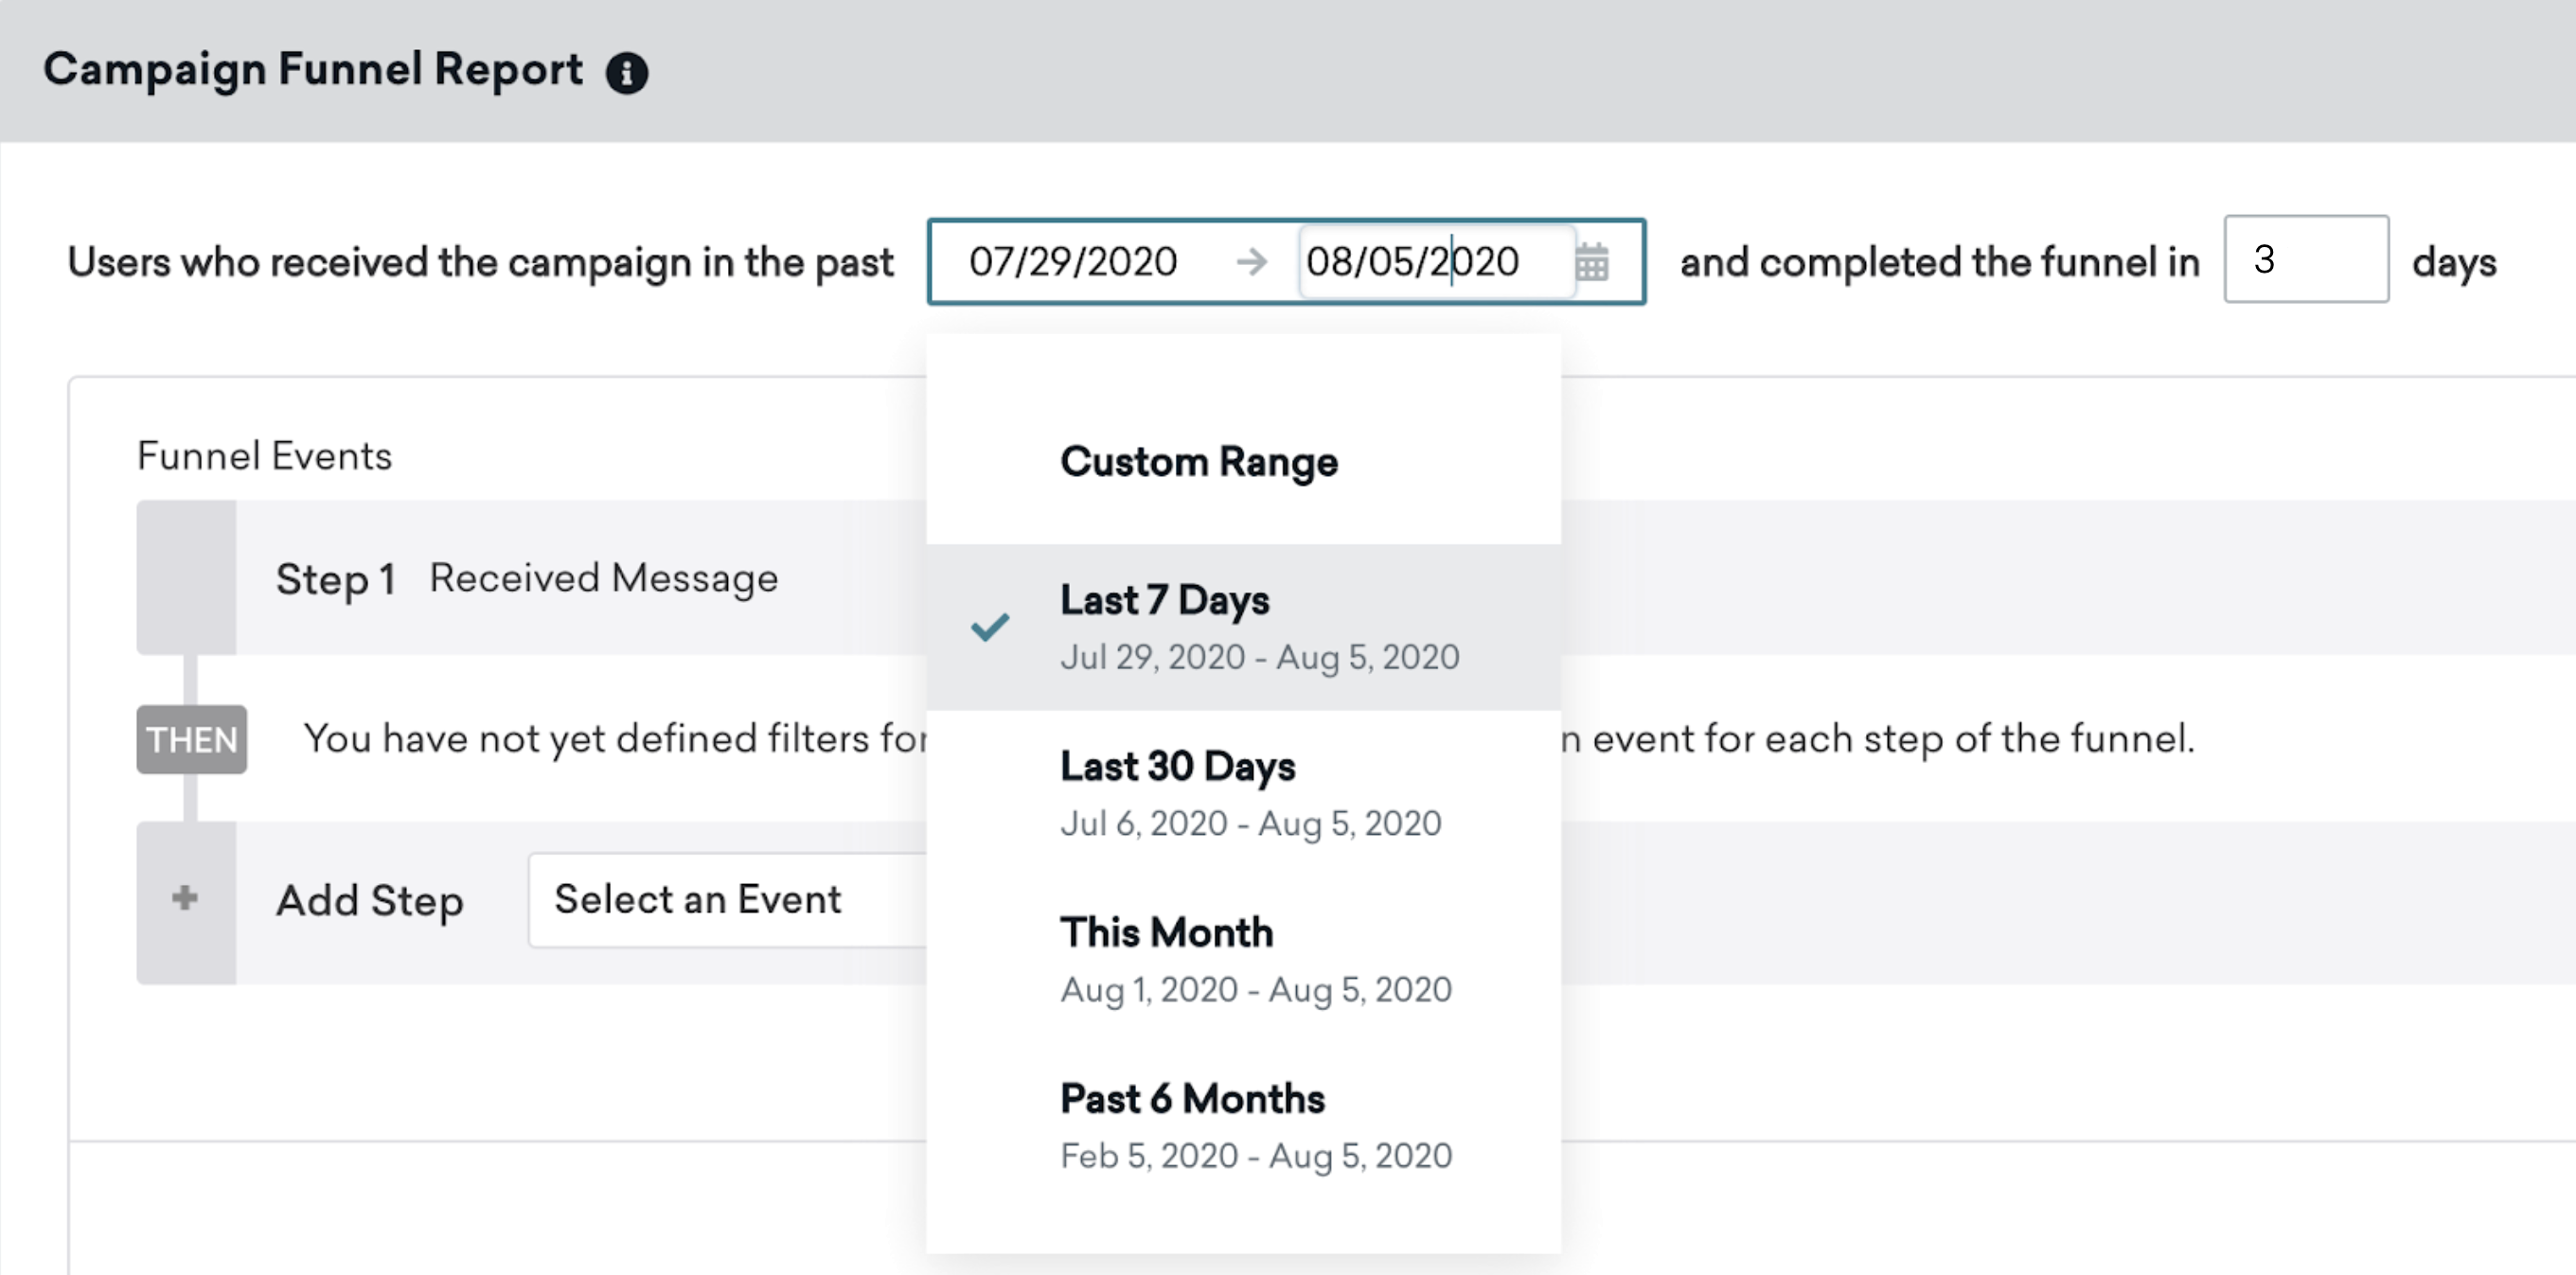
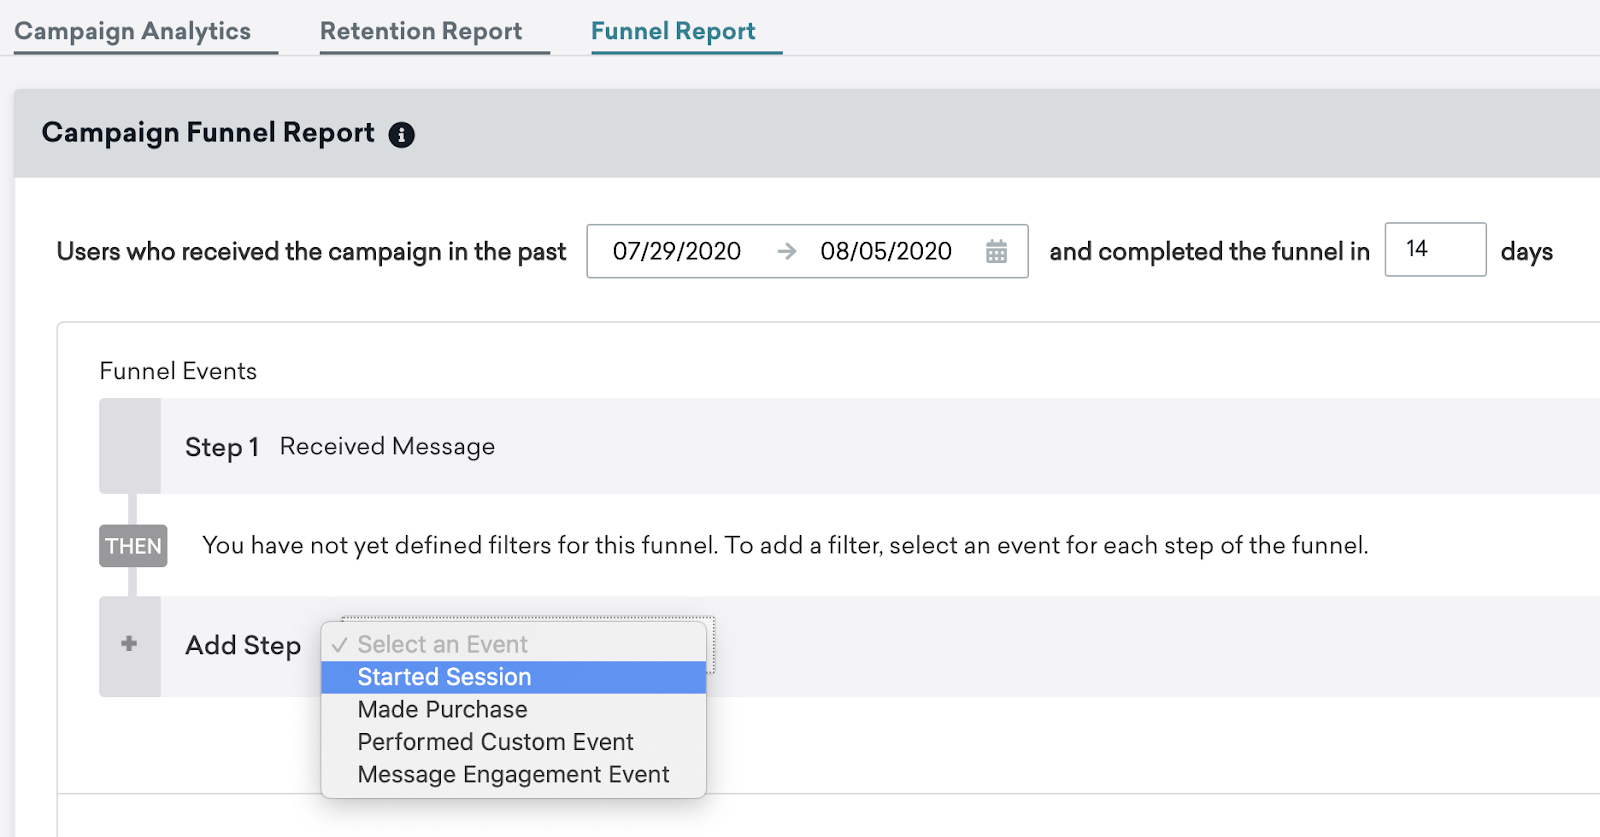
Step 1: Select a date range
You can select a time frame for your report (within the past 6 months), and refine the data to see users who, upon entering the campaign or Canvas, completed the funnel events within a set window (maximum of 30 days). In the following example, your funnel would look for users who received this campaign or Canvas in the last 7 days and completed the funnel within 3 days.
If you set the window to complete the funnel to 1 day, then the funnel event must occur within 24 hours of message receipt. However, if you select multiple days, the timing window is then counted as calendar days in the company time zone.
Step 2: Select events for funnel steps
For every funnel report, the first event is when the user receives your message. From there, the subsequent events you choose funnel the number of users who performed those events, as well as the previous events. Funnel report events for both campaign and Canvases funnels allow for start session, make a purchase, and custom events, while only campaign funnels include message engagement events.
Funnel reports allow you to compare the success of your messages beyond just the conversion events or message engagement events you initially set up. So if there’s a conversion event you didn’t add initially, you can still track conversions for that event using a funnel.
For example, if you select a 14-day report time window, followed by the events Added to cart and Made purchase, you will see both the number of users who added to cart within 14 days of receiving the message and the number of users who added to cart and then made a purchase within 14 days of receiving the campaign.
As another example, you may want to see the percentage of users that converted on an email after clicking on it. To calculate this, you could create a report where the second event is clicking your email and the third event is performing your conversion event.
After clicking Build Report, the funnel report may take several minutes to generate. During this time, you can navigate away from the report to other pages in the dashboard. You’ll receive an in-dashboard notification when your report is ready.
Interpreting your funnel report
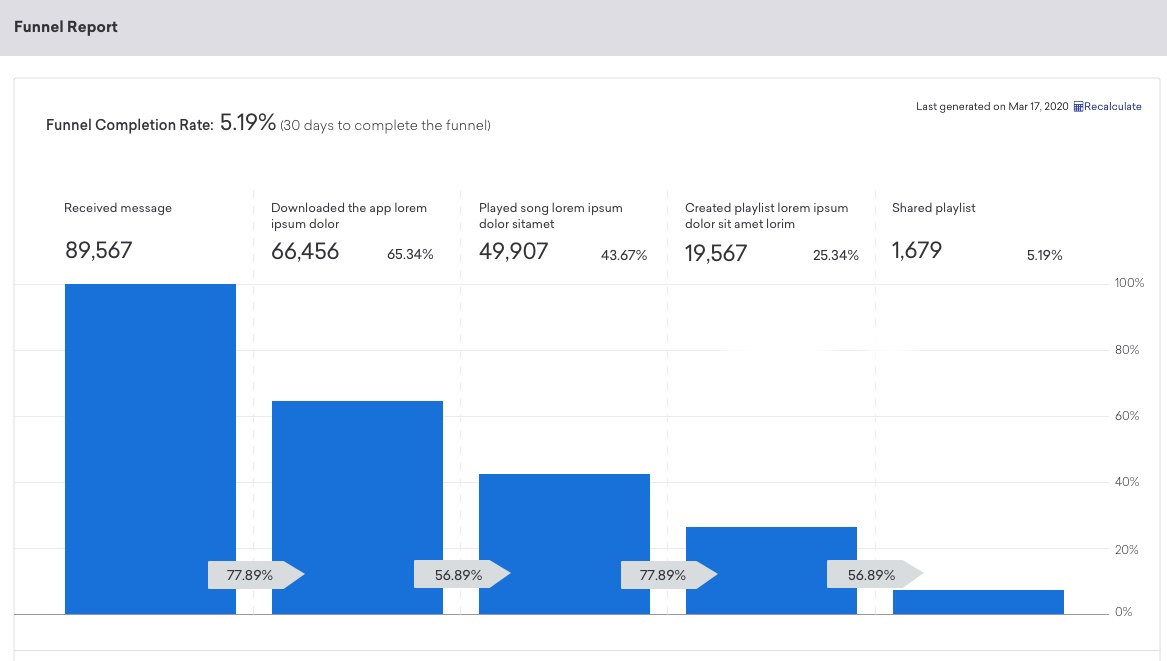
In your funnel report, you can directly compare the control group alongside the variants you have set up. Each consecutive event will show what percentage of the previous users completed that action and converted through the funnel.
Funnel report components
- Horizontal axis: Displays the percentage of message recipients who performed those actions.
- Chart: Displays the number of received messages, the number of users that performed the prior actions as well as the action you chose, the conversion rate, and the percentage change from control.
- Regenerate Option: Allows you to regenerate your report and notes when the current report was last generated.
- Variants: Denoted by colored columns, funnel reporting allows up to 8 variants and a control group. By default, the chart will only show three variants. To see more, you can manually select the rest of the variants.
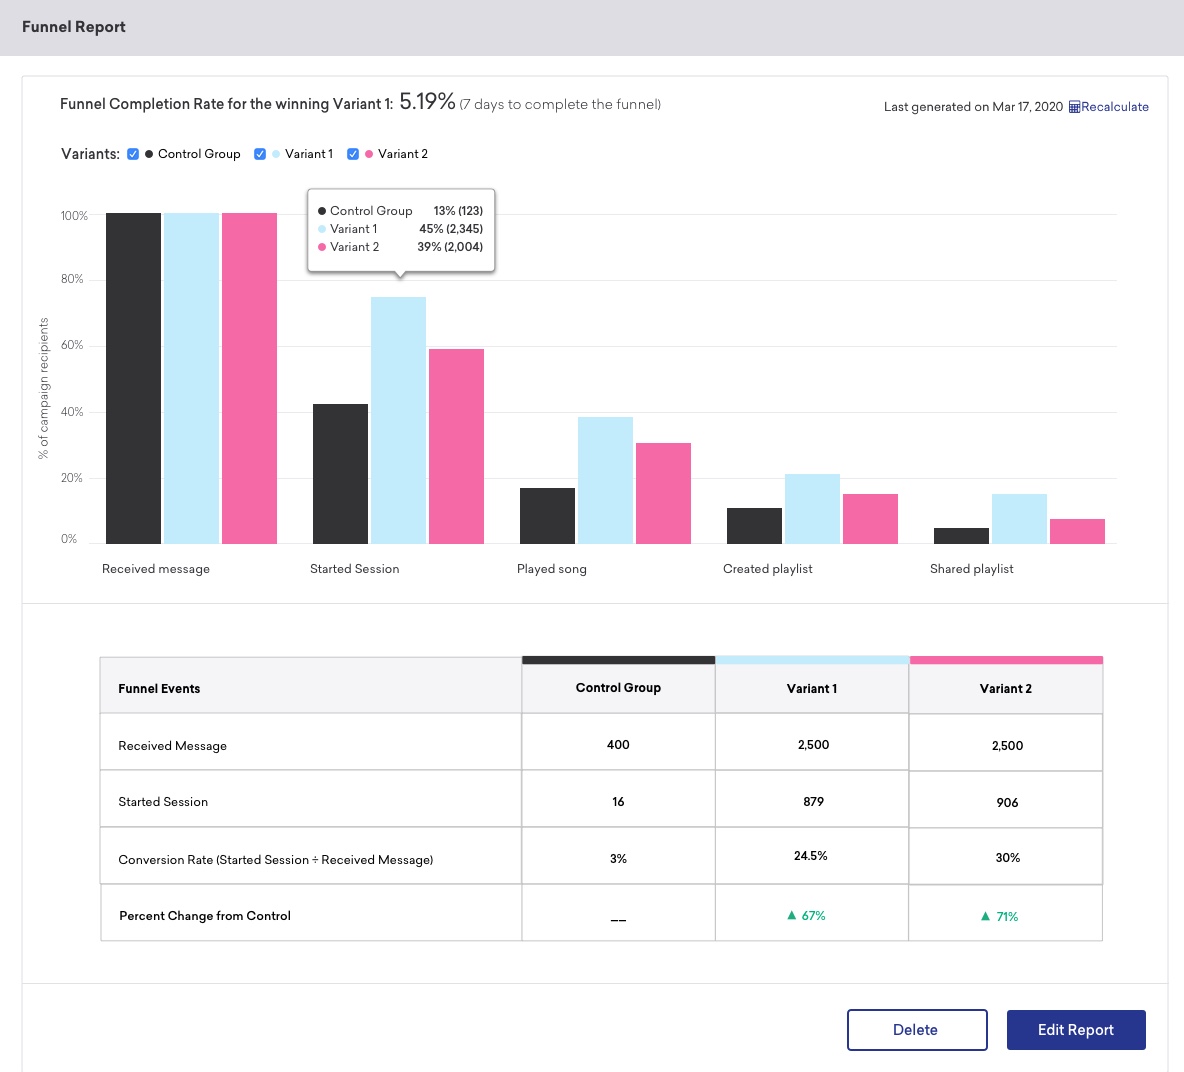
For campaigns with multiple variants: Braze will show a table that displays metrics for each event and variant, as well as the percentage change from control. The conversion rate is the number of users who performed the event (and subsequent ones) per message recipients.
For campaigns with re-eligibility: If a user receives the campaign more than once in the report time window, Braze will determine whether the user should be included in the funnel based on the actions this user took after the first time they received the campaign within the time window.
- Note that there may be a discrepancy between funnel and standard conversion values, as users can convert more than once with re-eligibility, but Funnel Reports will convert a maximum of one time even if a user performs the event more than once.
For multivariant campaigns with re-eligibility: If a user receives multiple variants from the campaign during the report time window, Braze will determine whether they should be included in the variant funnel based on the actions this user took after the first time they received the campaign variant. This means that the same user could count toward multiple different variants if they received multiple variants during the time window for the funnel.
 Edit this page on GitHub