Segment data
This reference article explains the segments section of your Braze dashboard, and includes a summary of the statistics provided.
Accessing data about your segments and membership
The Segments page of your Braze dashboard contains a summary of all of your segments and allows you to examine detailed data for each one. On this page, search for and click the name of a segment to edit and view its data. To learn how to create a segment, check out Creating a Segment.
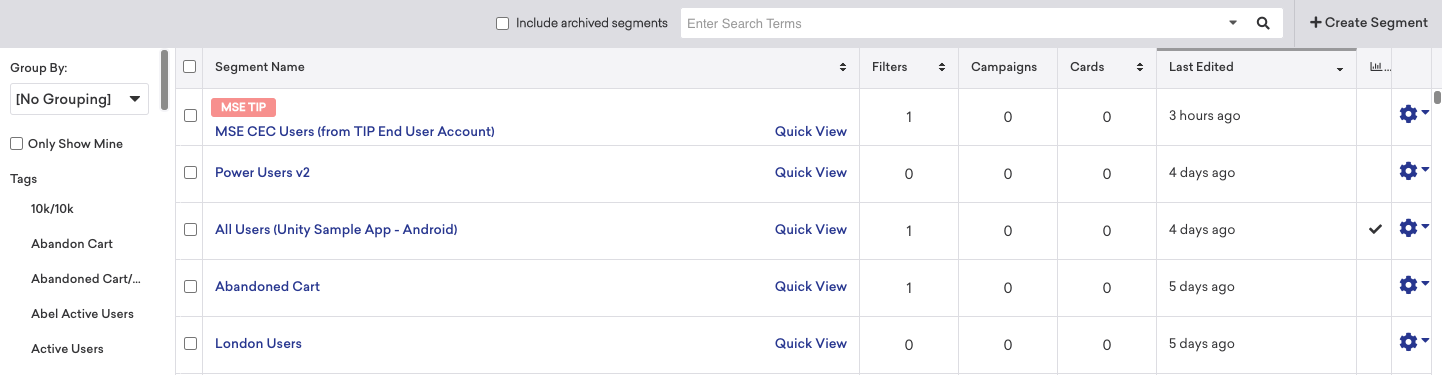
After clicking on the name of a segment, you’ll be able to view segment statistics and filters. You can edit your segment by adding or deleting filters. Be sure to save any changes!
![]()
When you turn analytics tracking on for a segment, Braze will let you view sessions, custom events, and revenue over time by this segment.
Segment statistics
You will see the following segment statistics, which update in real-time as you add or delete filters:
| Statistic | Description |
|---|---|
| Total Users | How many users your app has in total. |
| Selected Users | How many users are in your segment and what percentage of your total user base they are. |
| LTV (Paying Users) | The lifetime value per user (LTV) in this segment and the lifetime value per paying user in this segment. The LTV is calculated by dividing your lifetime revenue by lifetime users. |
| Emailable (Opted In) | Emailable refers to all users who can be reached via email. These users have provided an email address and have not opted out. Opted In refers to users who have explicitly opted in to email. Due to spam regulations, it’s often a good idea to ask your users to explicitly opt-in by implementing a double opt-in policy where users must click a link in an initial confirmation email. To encourage more users to opt-in, you can target a message at those who have neither opted in nor out. |
| Push Enabled (Opted In) | Push enabled refers to the number of users with at least one push token. Some users may have multiple push tokens (for example, if they own an iPhone and iPad), so the number of push notifications you send to this segment may be greater than the number of “push enabled” users. Opted In refers to the number of users who have explicitly opted in to push notifications. Users must always explicitly opt-in for you to send them pushes. |
Segment Insights
You can see how one segment is performing compared to another across a set of pre-selected KPIs by visiting the Segment Insights page of your dashboard.
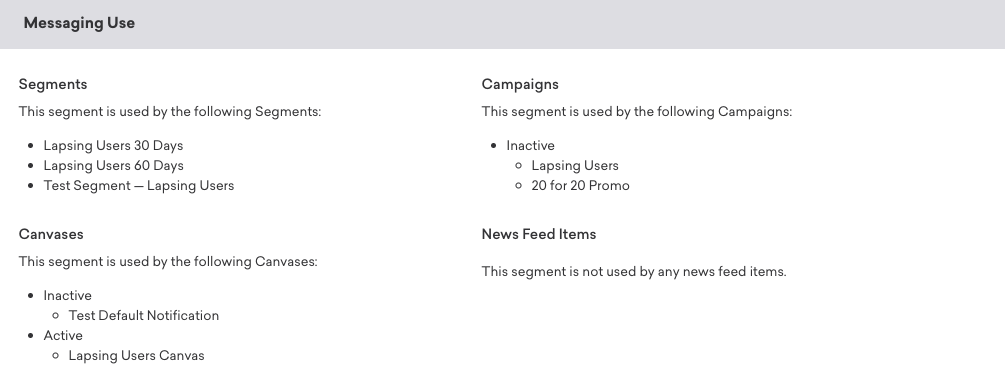
Messaging use and historical membership
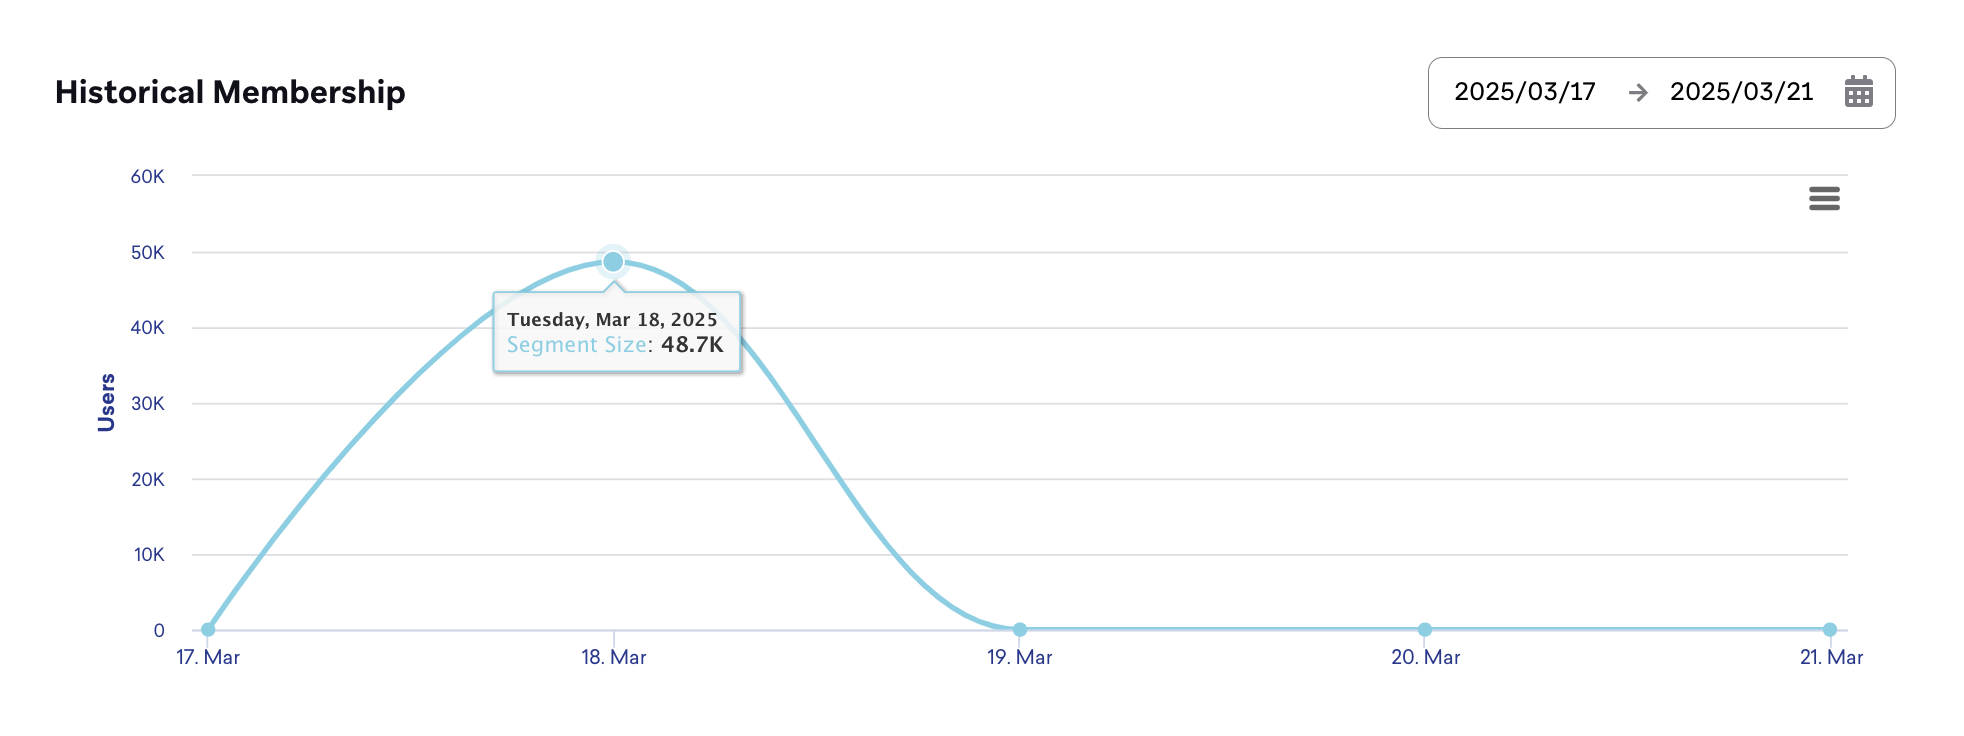
The Messaging Use section shows which campaigns have targeted your segment, while the Historical Membership section shows how the size of your segment changed over time. Use the dropdown to filter segment membership by date range.
The historical segment membership count is an estimate, similar to how the segment size is an estimate before you click Calculate Exact Statistics. Braze estimates the membership count by querying users in a random bucket range. This means that on one day, the membership count could be based on users with a random bucket number of 111–120, and on another day, users with a random bucket number of 8,452–8,455. Therefore, the graph might show slight fluctuations on each date due to different amounts of users landing within the random bucket ranges.
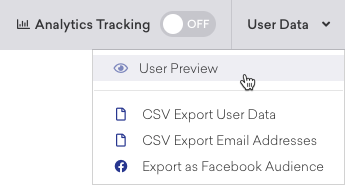
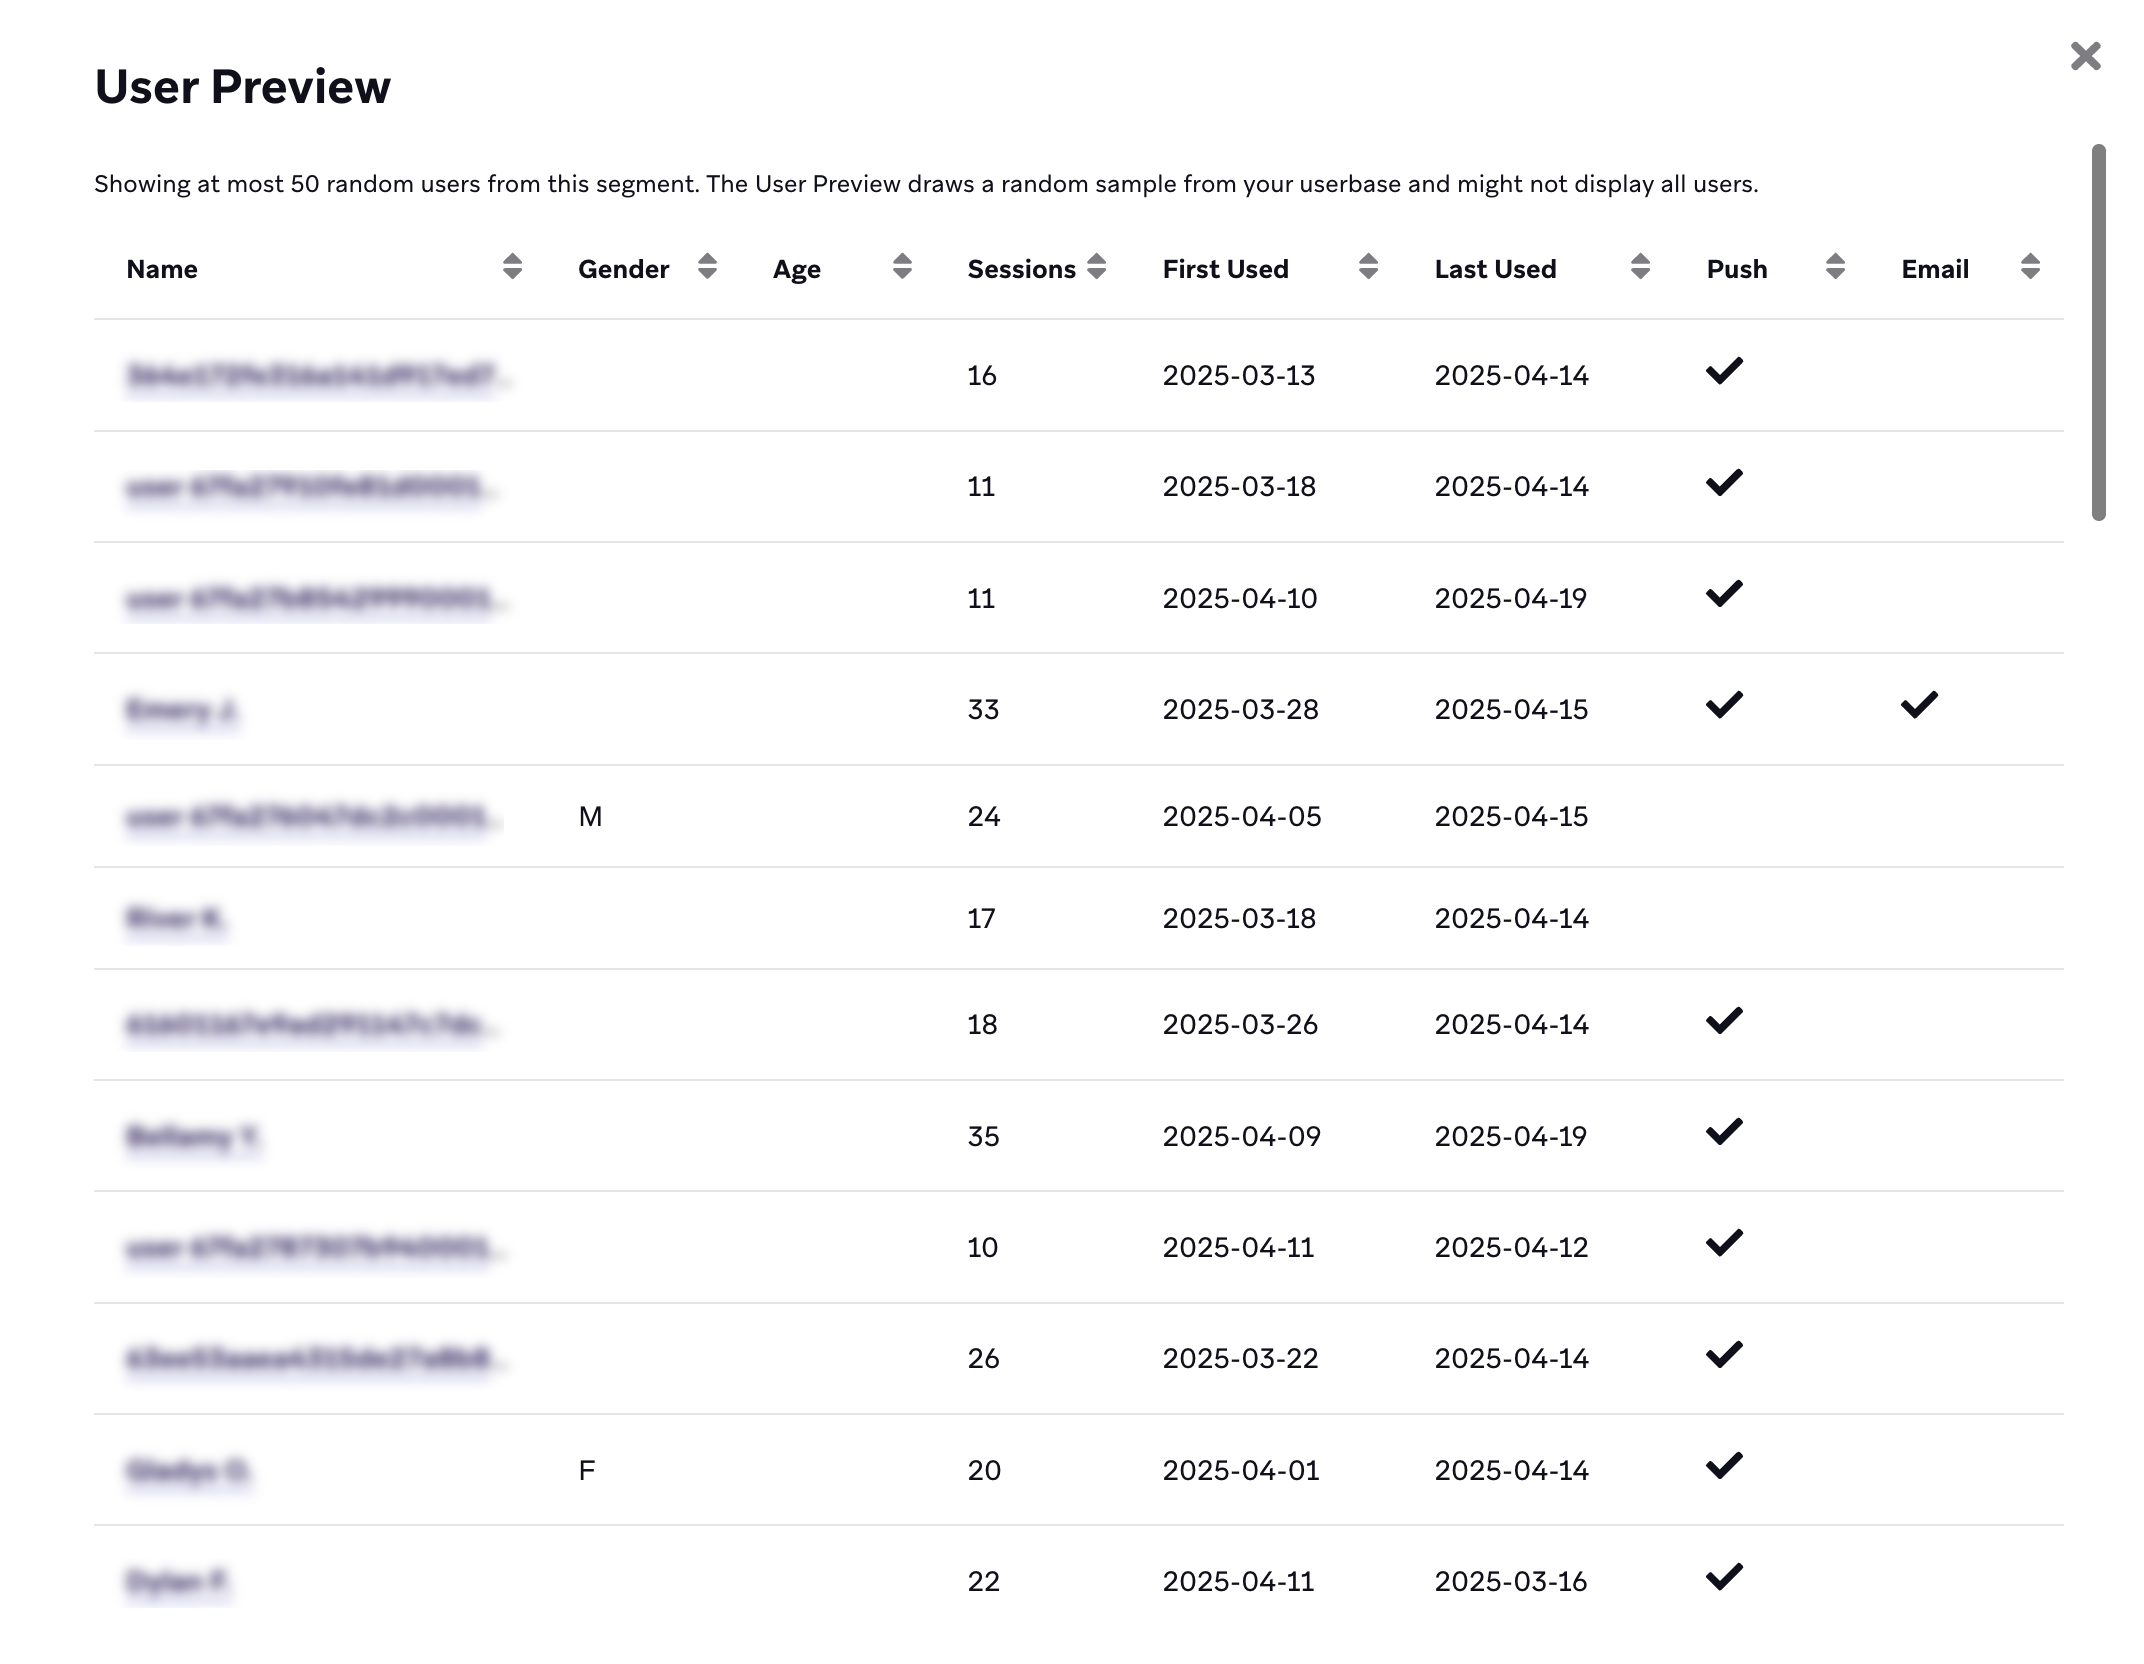
User preview
To view detailed, user-specific information about your segments, click User Data and select User Preview.
On this page, you can view a number of user-specific attributes, such as gender, age, number of sessions, and whether they have opted into push and email.
Performance data by segment
Your results will show the top (or bottom) campaigns, Canvases, or Canvas steps that you selected. For example, if you selected the top 10 campaigns for click rate, your results will show the top 10 campaigns ordered from highest to lowest click rate. Your columns will display all of the email engagement metrics for each row (campaigns, Canvases, or message steps).
You can use Query Builder report templates to break down performance metrics for campaigns, Canvas, variants, and steps by segments. Analytics tracking must be turned on for the segments you want to access metrics for.
To run these reports, do the following:
- In Query Builder, choose to create a new SQL report via a template.
- Filter templates for those where the metrics include “segment breakdowns”, which are:
- Email performance metrics by segment
- Email engagement metrics for variants or steps, by segment
- Purchases and revenue by segment
- Purchases and revenue for variants or steps, by segment
See below for details on each templated report.
Viewing metrics for campaigns or Canvases
To view email performance metrics broken down by segment at the campaign or Canvas level, use the Variables tab to specify the campaigns or Canvases and a time frame for pulling data. If no campaigns or Canvases are specified, the report will include emails from all campaigns and Canvases from the specified time frame. You can also opt to view all campaigns and Canvases with certain tags.
The following email metrics are available in this report:
- Sends
- Deliveries
- Complaints
- Unique opens
- Unique machine opens
- Unique non-machine opens
- Unique clicks
- Unsubscribes
- Bounces
- Soft bounces
- Deferred
Metrics from non-email channels are not yet available.
Results
Your results will show email engagement metrics by segment for the campaigns or Canvases you selected. If you didn’t select specific campaigns or Canvases, your report will show the email metrics for each segment across all email campaigns and Canvases within your report’s time frame.
- Rows: Segments
- Columns: Email engagement metrics
Viewing metrics for variants or steps
To view email performance broken down by segment at the campaign variant level, Canvas variant level, or Canvas step level, first choose a variant or step-level report (these are reports that have “for variants or steps” in the title), and then use the Variables tab to specify the following:
- Specific campaign or Canvas (required if using a variant or step-level report)
- Variants (required if using a variant or step-level report)
- Canvas step (optional)
The metrics are the same as those offered for the campaign or Canvas level template. If you choose multiple variants, your results will be grouped by variant.
Results
Your results will show email engagement metrics by segment for your selected variants or steps.
- Rows: Segments
- Columns: Email engagement metrics
Viewing metrics for campaigns or Canvases
To view purchase and revenue metrics broken down by segment for a specific campaign or Canvas, use the Variables tab to specify the following:
- Conversion window (the number of days after email receipt or click that Braze should attribute purchases or revenue to)
- Specific product (optional)
In addition, use the Variables tab to specify whether to run the report for one or more campaigns or Canvases, or one or more tags. If no campaigns, Canvases, or tags are chosen, then the report will run for all emails from campaigns or Canvases during your chosen time frame.
Currently, this report pulls metrics from only the email channel. Any revenue or purchase data from channels besides emails will not be reflected in the report.
The following metrics are available for emails:
- Unique purchases upon receipt
- Revenue upon receipt
- Unique purchases upon click
- Revenue upon click
- Unique recipients
- Unique email clicks
All rate metrics use unique email recipients as the denominator.
Definitions
-
“Upon receipt” refers to purchase events or revenue that occurred within your specified conversion window, after users received the specified campaigns or Canvases.
-
“Upon click” refers to the purchase events or revenue that occurred after the purchase events, within your specified conversion window, after users clicked the specified campaigns or Canvases.
For example, let’s say a segment contains 10 users and five of them made a purchase after receiving your email. If one of those five made a purchase after clicking your email, your “unique purchases upon receipt” rate would be 50% and your “unique purchases upon click” rate would be 10%.
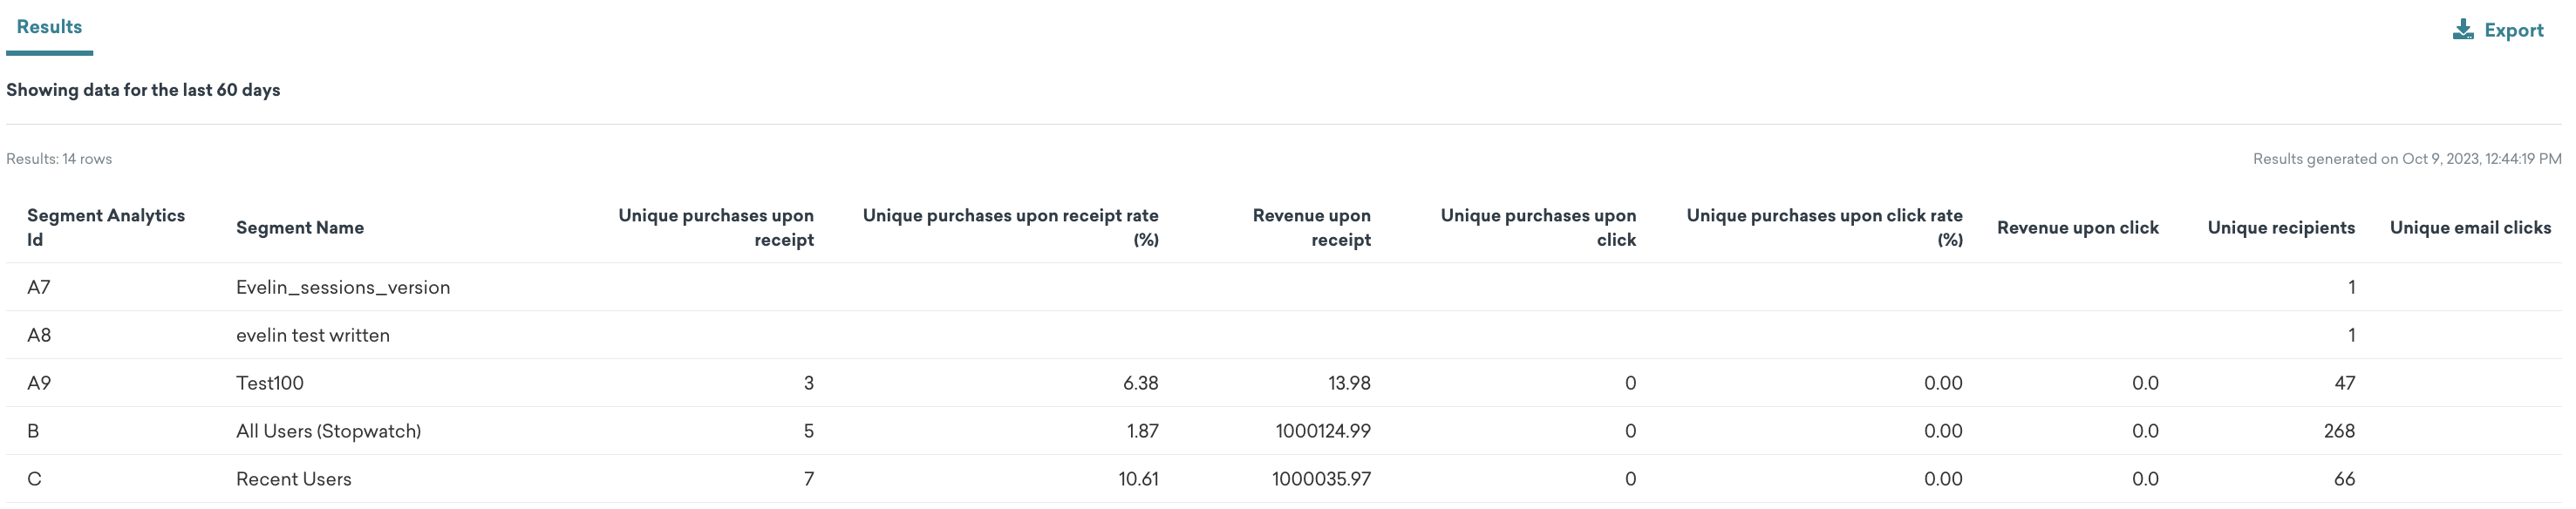
Results
Your results will show purchase metrics by segment for your selected campaigns or Canvases. If you didn’t select specific campaigns or Canvases, your report will show the purchase metrics for each segment across all email campaigns or Canvases within your report’s time frame.
- Rows: Segments
- Columns: Purchase metrics
Viewing metrics for variants or steps
To view purchase and revenue metrics broken down by segment for a specific campaign variant, Canvas variant, or Canvas step, use the Variables tab to specify the following:
- Specific campaign or Canvas
- Variants
- Canvas step (optional)
- Time range
- Specific product (optional)
Results
Your results will show purchase metrics by segment for the variants or steps you selected.
- Rows: Segments
- Columns: Purchase metrics
Viewing metrics for the top or bottom performers
This report in the Variables tab displays the campaigns, Canvases, or Canvas steps that were the highest or lowest performers for a specified email engagement metric.
Use cases include:
- 10 campaigns with the highest unique email open rates
- 25 Canvases with the most email unsubscribes
- 50 Canvas steps with the highest unique clicks
The following email metrics are available in this report:
- Sends
- Deliveries
- Complaints
- Unique opens
- Unique machine opens
- Unique non-machine opens
- Unique clicks
- Unsubscribes
- Bounces
- Soft bounces
- Complaints
To view this report, you must specify the following variables in the Variables tab:
- Metrics: Select one of the metrics by which to rank your results
- Number of reports: Select top or bottom results and the number of results, such as Top 10 or Bottom 15
- Message type: Specify if your results are campaigns, Canvases, or Canvas steps
Results
Your results will show the top (or bottom) campaigns, Canvases, or Canvas steps that you selected. For example, if you selected the top 10 campaigns for click rate, your results will show the top 10 campaigns ordered from highest to lowest click rate. Your columns will display all of the email engagement metrics for each row (campaigns, Canvases, or message steps).
Viewing metrics for the top or bottom performers
This report in the Variables tab displays the campaigns, Canvases, or Canvas steps that were the highest or lowest performers for a specified purchase or revenue metric.
Use cases include:
- 20 campaigns with the highest purchase rates for a specific product
- 25 Canvases with the most generated revenue
- 10 Canvas steps with the lowest product purchase rate
The following email metrics are available in this report:
- Unique purchases upon receipt
- Revenue upon receipt
- Unique purchases upon click
- Revenue upon click
- Unique recipients
- Unique email clicks
To view this report, you must specify the following variables in the Variables tab:
- Metrics: Select one of the metrics by which to rank your results
- Number of reports: Select top or bottom results and the number of results, such as Top 10 or Bottom 15
- Message type: Specify if your results are campaigns, Canvases, or Canvas steps
- Conversion window: The number of days after email receipt or click to which Braze will attribute purchases or revenue
Definitions
-
“Upon receipt” refers to purchase events or revenue that occurred within your specified conversion window, after users received the specified campaigns or Canvases.
-
“Upon click” refers to the purchase events or revenue that occurred after the purchase events, within your specified conversion window, after users clicked the specified campaigns or Canvases.
For example, let’s say a segment contains 10 users and five of them made a purchase after receiving your email. If one of those five made a purchase after clicking your email, your “unique purchases upon receipt” rate would be 50% and your “unique purchases upon click” rate would be 10%.
Results
Your results will show the top (or bottom) campaigns, Canvases, or Canvas steps that you selected. For example, if you selected top 10 campaigns for “revenue upon click”, your results will show the top 10 campaigns ordered from highest to lowest “revenue upon click”. Your columns will display all of the purchase metrics for each row (campaigns, Canvases, or message steps).
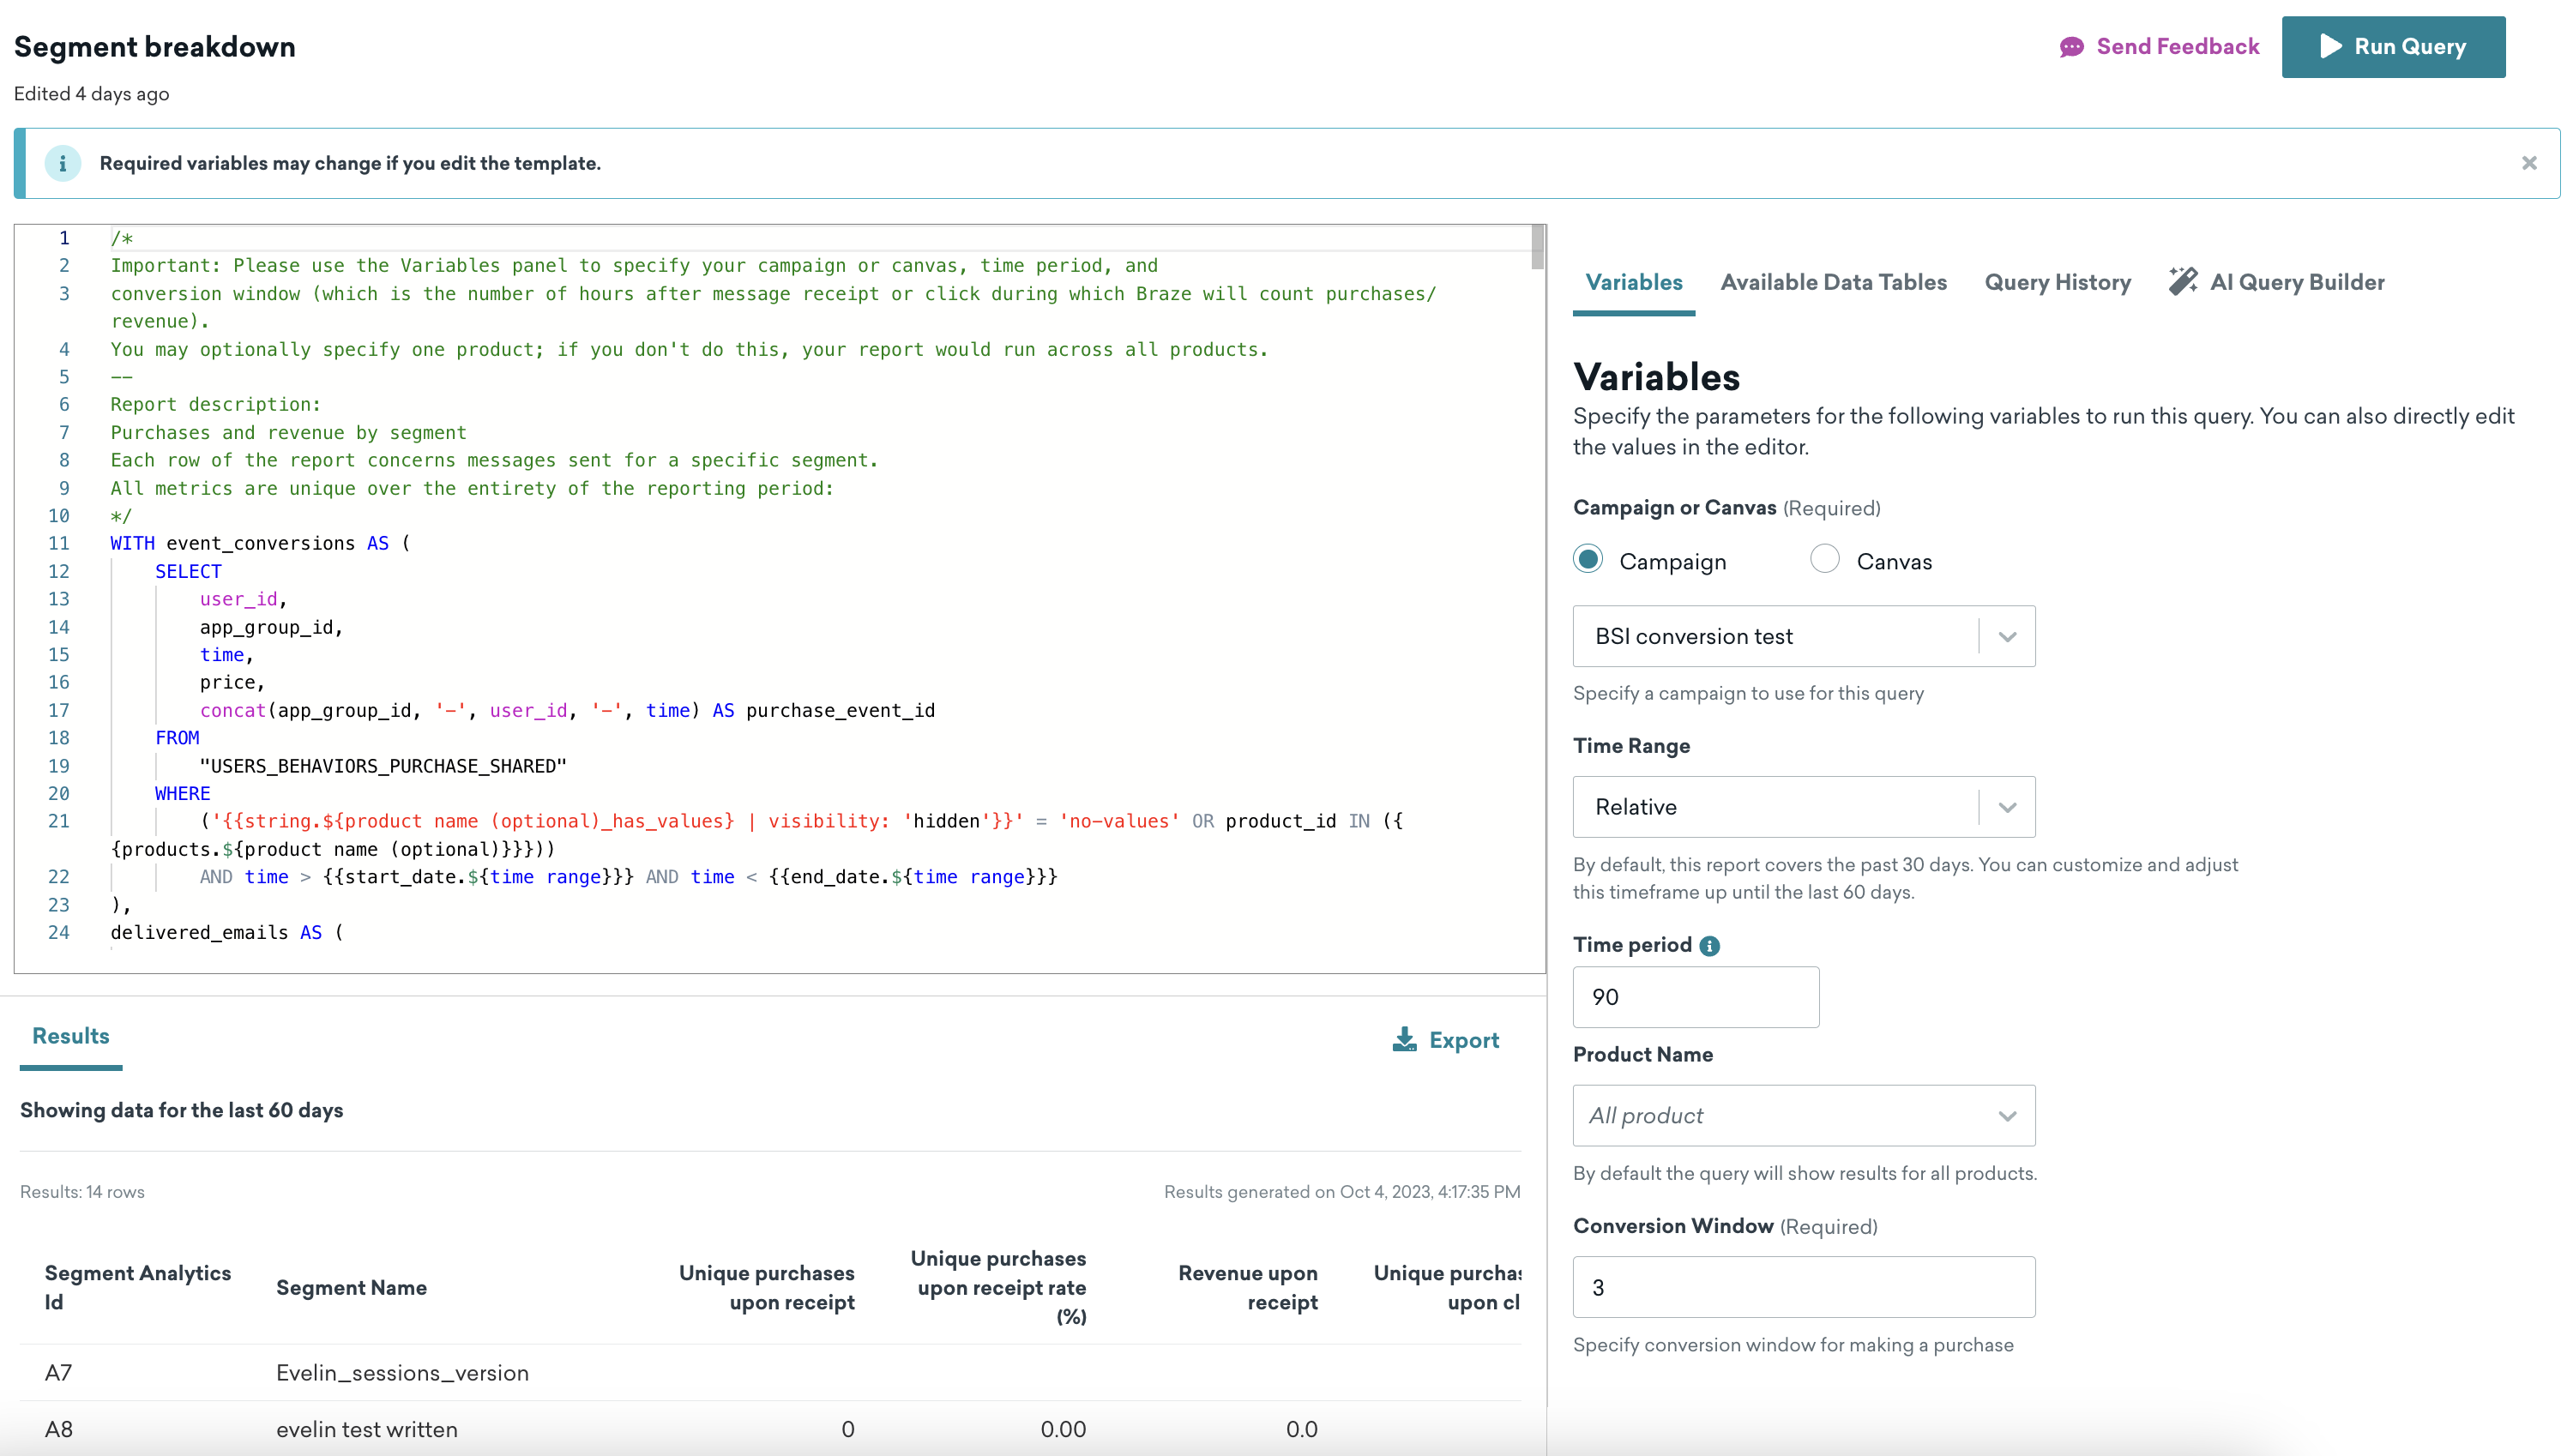
Creating a report from a Query Builder template
To create a report from a Query Builder template, go to Query Builder and do the following:
- Select Create SQL Query > Query Template.
- Filter templates for those that have metrics that include “segment breakdowns”.
- Select the template you want to use.
- Fill the variables in your SQL template in the Variables tab.
- (optional) Directly edit the SQL in the template.
- Click Run Query. Your results will display in a table.
Variables
Before generating your report, go to the Variables tab to provide information for the Report Builder template, including required variables that will vary based on report.
The variables include:
- Campaign or Canvas: You can include one or multiple campaigns or Canvases (there is no maximum for how many campaigns or Canvases you can specify). If you do not specify any campaigns or Canvases, the report will include all campaigns or Canvases from your chosen time frame.
- Variant: If using a template that offers variant-level break downs, after selecting a campaign or Canvas, you can select variants from within that campaign or Canvas. If you select multiple variants, your results will be grouped by variant.
- Step: If you select a Canvas variant, you can select a Canvas step. You cannot select a step without first selecting a Canvas variant.
- Time range: Identify the time period you want to pull data from. If no time range is specified, the time range will default to the past 30 days.
- Product name: If running a report for purchase data, you can identify a specific product to pull data for.
- Conversion window: Always required for reports with revenue and purchase data. The number of days after email receipt or click that Braze should attribute purchases or revenue to.
- Segments: Identify the segments to break down data by. If not specified, the report will run for all segments that have analytics tracking turned on.
- Tags: Specify tags in Variables to run your report for all campaigns or Canvases with certain tags. You may include multiple tags. If you add both tags and specific campaigns or Canvases to a report, your report will include data from your tags and the specified campaigns or Canvases.
Data availability
Data is available for time periods where both of these conditions are met:
- Segment analytics tracking is turned on for the segments that you want to see data for.
- The performance data by segment feature is turned on. During the early access phase, we will gradually roll this feature out to customers.
You won’t be able to access data from time periods prior to when this feature is turned on for your company. For example, if analytics tracking is turned on for Segment A on October 1 and this feature is turned on for your company on October 2, then you can only see data for Segment A for the campaigns and Canvases that recorded metrics after October 2.
If your company turned on this feature on October 2, and turned on analytics tracking for Segment B on October 3, then you can only see data for Segment B for the campaigns and Canvases that recorded metrics after October 3.
 Edit this page on GitHub