Home dashboard
Learn about the Home page (previously the Overview page) and the statistics available there.
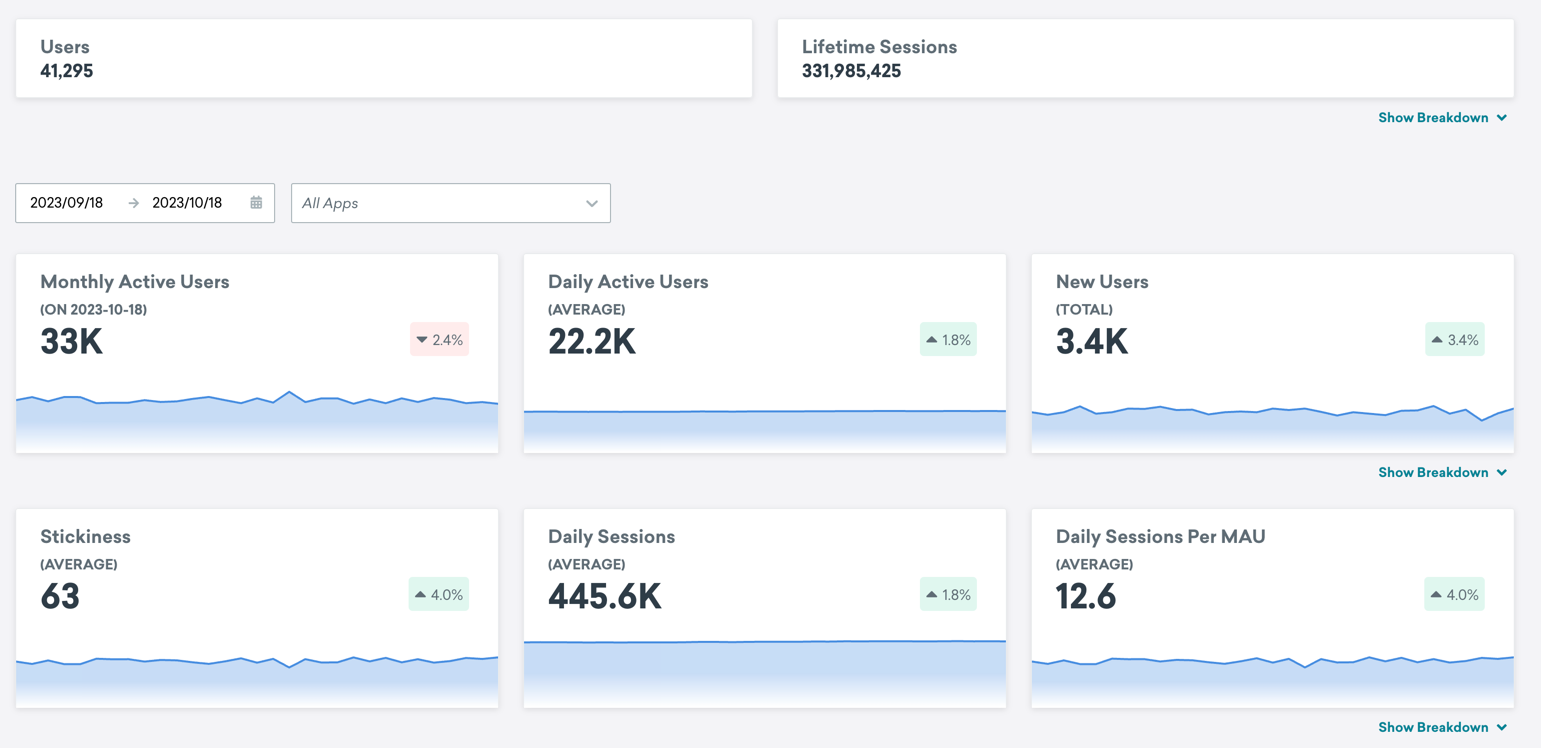
The Home page on the dashboard provides key metrics for you to track and understand the performance of your app or website, and gives you an at-a-glance high-level understanding of your userbase.
If you are using the older navigation, this is your Overview page.
Reading the dashboard
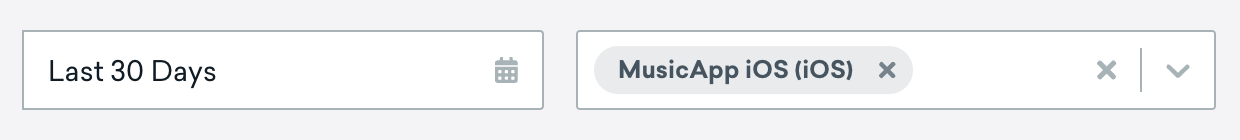
By default, the dashboard shows the last 30 days of data for all apps and sites. Your metrics are all calculated based on the selected date range.
Percentages are calculated based on the current date range as compared to the previous date range, with the exception of MAU, which uses the last day of the prior period instead of a range.
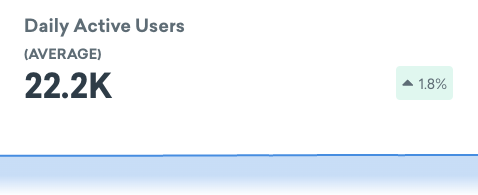
For example, if you set your date range to Last 7 Days and your Daily Active Users shows a percent increase of 1.8%, that means you had 1.8% more daily active users this week compared to last week.
Show breakdown
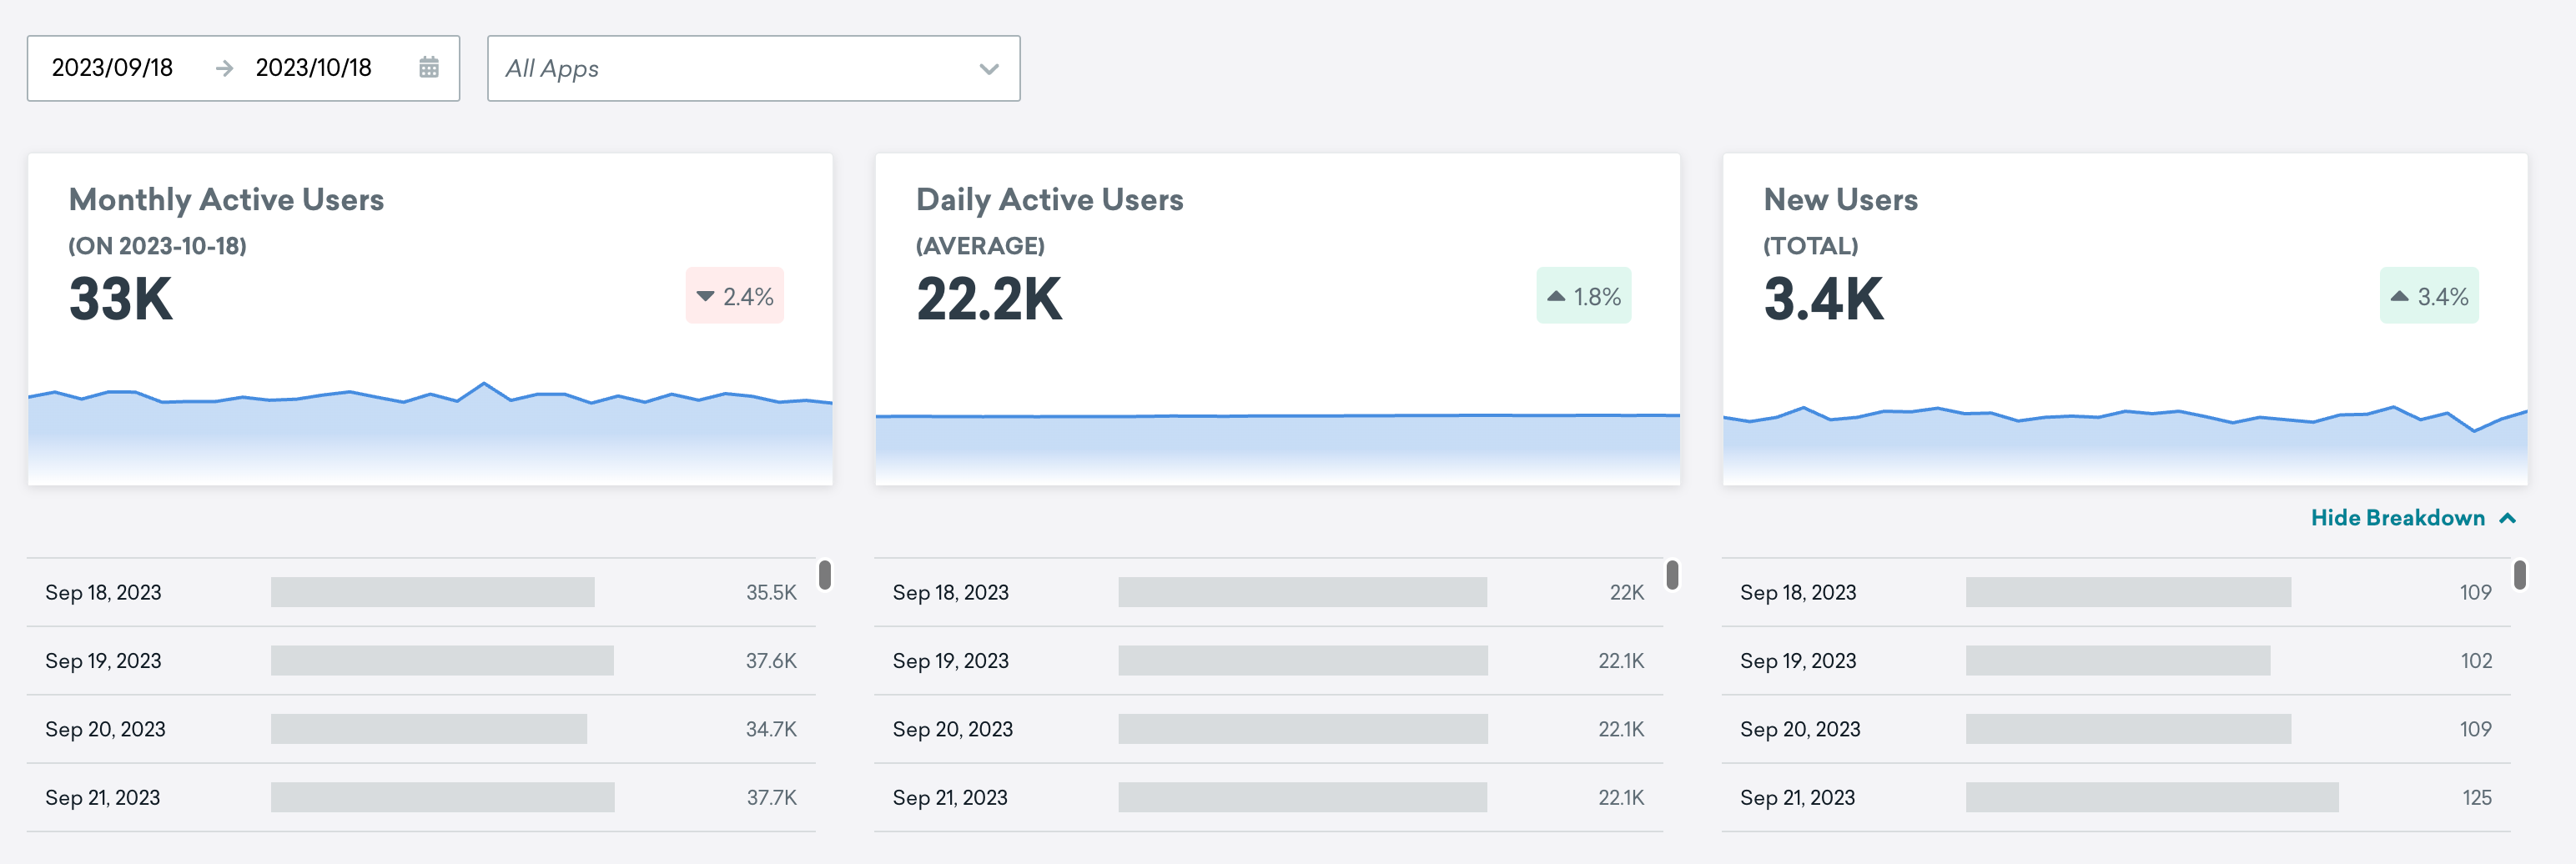
You can click Show Breakdown for each row of the dashboard statistics to view each statistic’s value per day for the date range specified.
Available statistics
The following are the definitions of these statistics, how we calculate them, and why they should be important to you.
Users
Users is the total number of users created in that workspace. This includes all users we have recorded using your app or website at any point in time, and those who might not be associated with a specific app or website. This number is the percentage of how many of your lifetime users are represented as Monthly Active Users (MAU) which is useful for seeing user retention over a long period of time.
A low MAU to user ratio may indicate that you need to diversify your messaging channels or increase your efforts in reaching out to lapsing users. See our quick win on capturing lapsing users for more info. In general, the MAU to lifetime ratio will inevitably decrease over time due to user churn, but Braze tools can help you minimize this effect by keeping users engaged longer.
Lifetime sessions
This is the total count of sessions that Braze has recorded since integration. Simply put, a session is each time a user uses the app or visits your website. For a more precise definition on how sessions are defined by platform, visit the corresponding iOS, Android and FireOS, or Web session tracking developer articles.
Monthly active users
Monthly Active Users (MAU) is the number of users that have recorded a session in your app or site in the last 30 days. MAU are calculated nightly with a rolling 30-day window. MAU provides you with a good understanding of an app or site’s health over an extended period of time as it smooths out the inconsistencies between days of varying usage intensity.
The percentage next to the MAU count shows the change in MAU for this period compared to the previous period.
\[\text{Change in MAU} = \frac{\text{MAU of last date in range} - \text{MAU of day before start date}}{\text{MAU of day before start date}}\]Anonymous users will also count toward your MAU. For mobile devices, anonymous users are device-dependent. For web users, anonymous users are browser cache-dependent.
Daily active users
Daily Active Users (DAU) displays the number of unique users who record at least one session in your app or site on a given day. DAU can be a useful statistic for examining the day-to-day variability of usage of your app or site and tailoring your messaging campaigns to be as effective as possible. For example, your app’s usage may see an appreciable spike on weekends - this would inform you that you could reach more users with in-app messages on these days as opposed to weekdays.
New users
New Users tells you how many users who have previously never recorded a session have started using your app or site. This number is a total of new users over the given time period. This statistic can be very valuable for tracking the effectiveness of your advertising efforts.
When you initially integrate Braze, all users will look like new users since Braze has never recorded a session for them before.
Stickiness
The Stickiness value is a ratio of a given periods’ DAU to MAU. In essence, stickiness measures the percentage of your MAU that come back on a daily basis.
For example, if the date range is set to 30 days, a ratio of 50% indicates that on average an active user is using the app or website for 15 out of 30 days or that about half of your active users come back on a daily basis. Stickiness is an important metric for success because most users don’t quit using an app because they actively hate it, but rather because it doesn’t become a part of their daily routine. Therefore, you can use stickiness as a proxy for measuring how well you’re engaging your users.
The percentage next to the stickiness ratio shows the change in stickiness for this period compared to the previous period.
\[\text{Change in stickiness} = \frac{\text{Stickiness of last period} - \text{Stickiness of this period}}{\text{Stickiness of last period}}\]The time frames for “last period” and “this period” are determined by the date range you select.
The MAU value is calculated nightly and will not update until the next day.
Daily sessions
Daily Sessions is the number of sessions recorded on a given day. Comparing this value to your DAU count can inform you of how many times your users open the app or visit your website on days where they record at least one session.
Daily sessions per MAU
Daily Sessions per MAU is the ratio of Daily Sessions to MAU on a given day. This statistic tells you how many sessions per day you can expect to have logged per MAU. On aggregate, this can give you an idea of the relative frequency of when your users use your app or site. That is, if your Daily Sessions per MAU were on average 0.5, then you could expect each MAU to record a session about every 2 days.
 Edit this page on GitHub