Export revenue and total revenue data
On the Revenue Report page of the dashboard you can view data on revenue over specific periods of time, a specific product revenue, and your app’s total revenue.
You can find the Revenue Report under Analytics.
If you are using the older navigation, you can find Revenue under Data.
Looking for more ways to get revenue data? Try adding purchase behavior (as well as purchase of a product) to campaigns or Canvases as conversion events.
To export your revenue data, click in the Performance Over Time graph and select your export option.
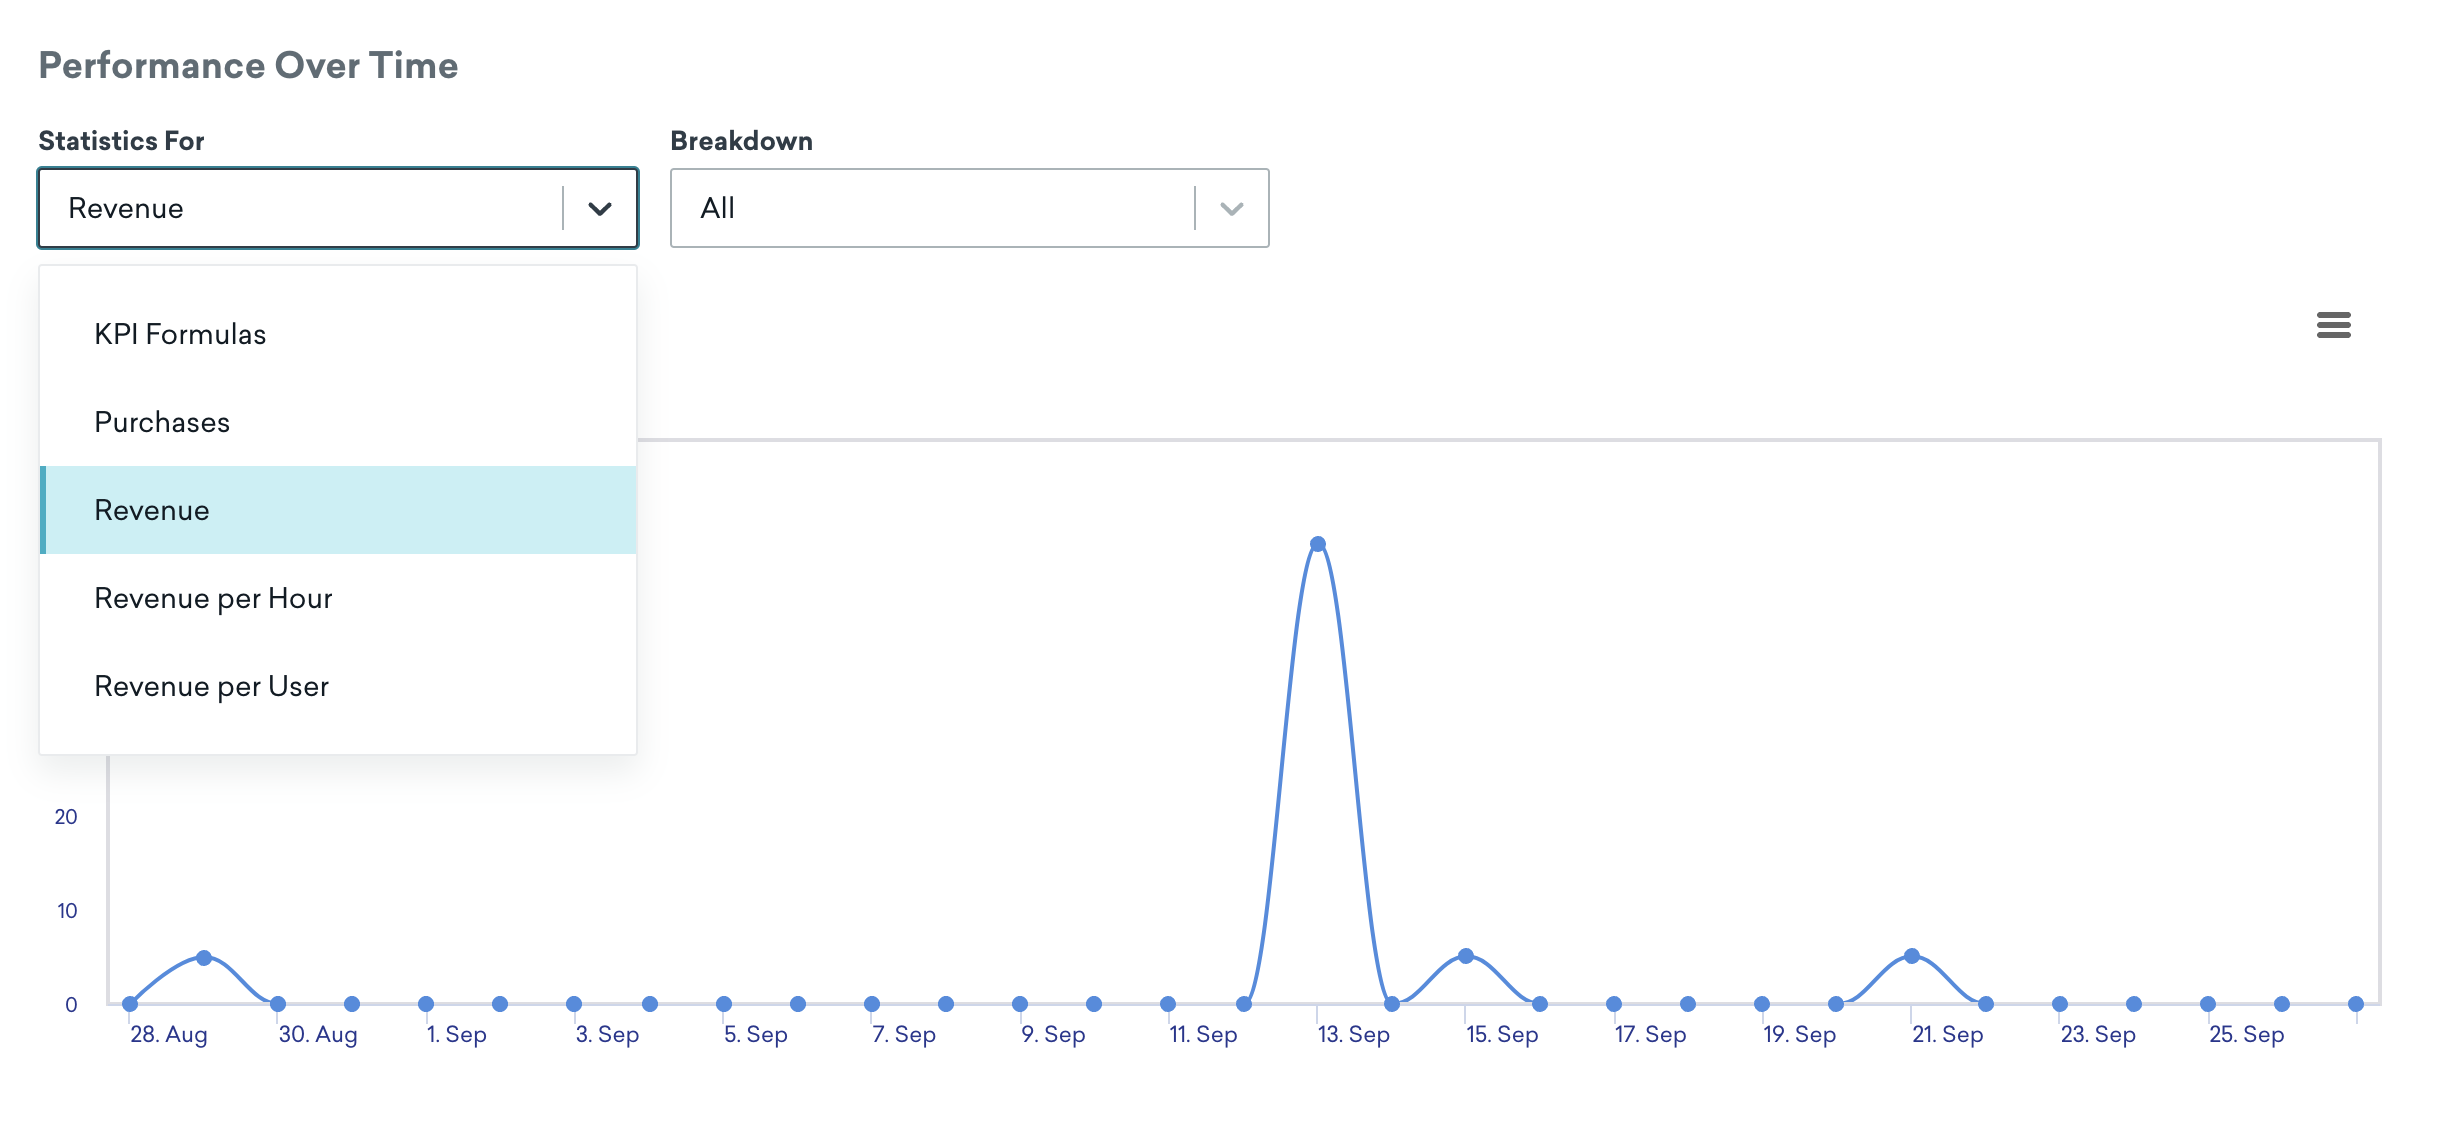
Performance Over Time graph
The following data can be accessed via the Performance Over Time graph:
- KPI Formulas
- Purchases
- (Optional) Purchases By Product
- Revenue
- (Optional) Revenue By Segment
- (Optional) Revenue By Product
- Revenue per Hour
- (Optional) Revenue per Hour By Segment
- Revenue per User
Total revenue
You can view revenue statistics on a case-by-case basis on the Campaign Analytics or Canvas Analytics pages. The Total Revenue statistic is generated from campaign recipients who have made a purchase within the campaign’s primary conversion period.
Revenue reports cannot be exported via API. For help with CSV exports, refer to export troubleshooting.
 Edit this page on GitHub