Query Builder
With the Query Builder, you can generate reports using Braze data in Snowflake. The Query Builder comes with pre-built SQL query templates to get you started, or you can write your own custom SQL queries to unlock even more insights.
Who has access
Because this feature allows direct access to some customer data, you can only access the Query Builder if you have the “View PII” permission.
Running reports in the Query Builder
To run a report:
- Go to Analytics > Query Builder.
If you are using the older navigation, you can find Query Builder under Data.
- Select Create SQL Query. If you need inspiration or help in crafting your query, select Query Template and choose a template from the list. Otherwise, select SQL Editor to head straight to the editor.
- Your report is automatically given a name with the current date and time. Hover over the name and click to give your SQL query a meaningful name.
- Write your SQL query in the editor or get help from AI from the AI Query Builder tab. If you choose to write your own SQL, see custom SQL for requirements and resources.
- Click Run Query.
- Save your query.
- To download a CSV of your report, select Export.

Results from each report can be generated once a day. If you run the same report more than once in one calendar day, you’ll see the same results in both reports.
AI Query Builder
The AI Query Builder leverages GPT, powered by OpenAI, to recommend SQL for your query.
The AI Query Builder is currently available as a beta feature. Contact your customer success manager if you’re interested in participating in this beta trial.
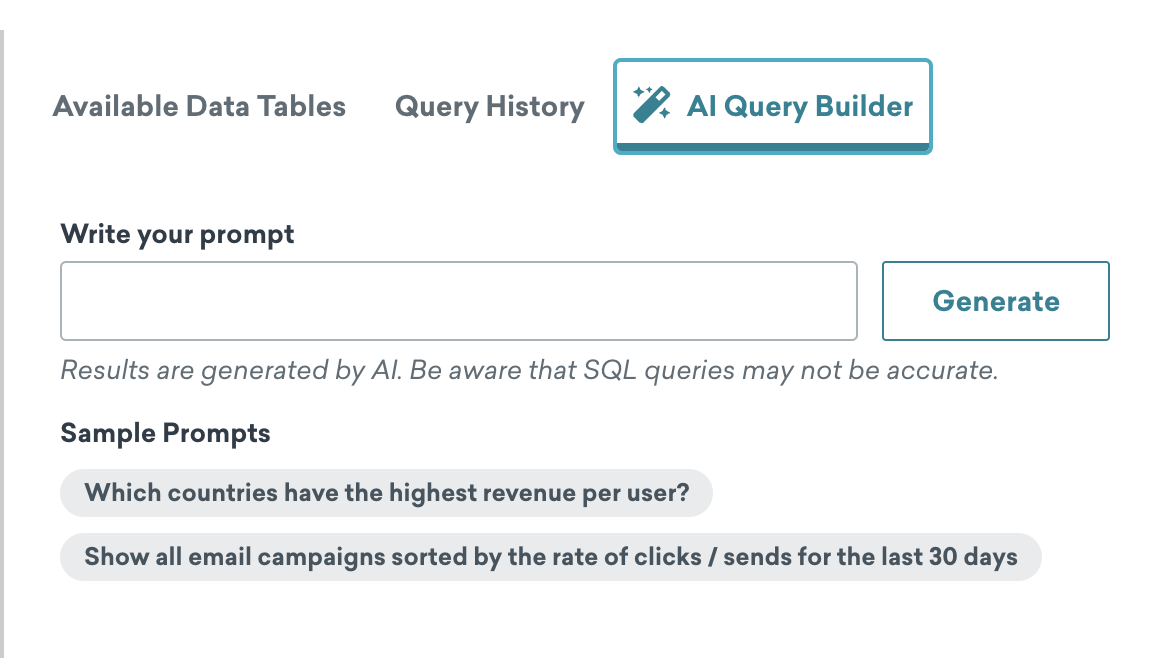
To use the AI Query Builder, do the following:
- After creating a report in the Query Builder, select the AI Query Builder tab.
- Type in your prompt or select a sample prompt and select Generate to translate your prompt into SQL.
- Review the generated SQL to make sure it looks correct, and then select Insert into Editor.
Tips
- Familiarize yourself with the available Snowflake data tables. Asking for data that doesn’t exist in these tables may result in ChatGPT making up a fake table.
- Familiarize yourself with the SQL writing rules for this feature. Not following these rules will cause an error.
- You can send up to 20 prompts per minute with the AI Query Builder.
How is my data used and sent to OpenAI?
In order to generate your SQL, Braze will send your prompts to OpenAI’s API Platform. All queries sent to OpenAI from Braze are anonymized, meaning that OpenAI will not be able to identify from whom the query was sent unless you include uniquely identifiable information in the content you provide. As detailed in OpenAI’s API Platform Commitments, data sent to OpenAI’s API via Braze is not used to train or improve their models and will be deleted after 30 days. Please ensure that you adhere to OpenAI’s policies relevant to you, including the Usage Policy. Braze makes no warranty of any kind with respect to any AI-generated content.
Report timeout
Reports that take longer than six minutes to run will time out. If this is the first query you’re running in some time, it may take longer to process and therefore has a higher likelihood of timing out. If this happens, try running the report again.
If a report times out or runs into errors even after retrying, please contact support.
Query templates
All templates surface data from the last 60 days. You can access query templates by selecting Create SQL Query > Query Template when first creating a report.
See Query templates for a list of available templates.
Custom SQL
Your SQL query should be written using Snowflake syntax. Consult the table reference for a full list of tables and columns available to be queried.
To view table details within the Query Builder:
- From the Query Builder page, open the Reference panel and select Available Data Tables to view available data tables and their names.
- Click See Details to view the table description and information about the table columns, such as data types.
- To insert the table name in your SQL, click .
To view pre-written queries provided by Braze select Query Template when first creating a report in the Query Builder.
Restricting your query to a specific time period will help you generate results quicker. The following is an example query that gets the number of purchases and the revenue generated for the last hour.
1
2
3
SELECT COUNT(*) as Purchases, SUM(price) as Revenue
FROM USERS_BEHAVIORS_PURCHASE_SHARED
WHERE to_date(to_timestamp_ntz(time)) >= DATEADD('hour', -1, date_trunc('day',CURRENT_DATE()));
This query retrieves the number of email sends in the last month:
1
2
3
SELECT COUNT(*) as Sends
FROM USERS_MESSAGES_EMAIL_SEND_SHARED
WHERE to_date(to_timestamp_ntz(time)) >= DATEADD('month', -1, date_trunc('day',CURRENT_DATE()));
Troubleshooting
Your query may fail for any of the following reasons:
- Syntax errors in your SQL query
- Processing timeout (after 6 minutes)
- Reports that take longer than 6 minutes to run will time out.
- If a report times out, try to limit the time range in which you are querying data or query a more specific set of data.
Variables
Overview
Variables allow you to use predefined variable types in SQL to reference values without needing to manually copy the value. For example, instead of manually copying a campaign’s ID to the SQL editor, you can use {{campaign.${My campaign}}} to directly select a campaign from a dropdown in the Variables tab.
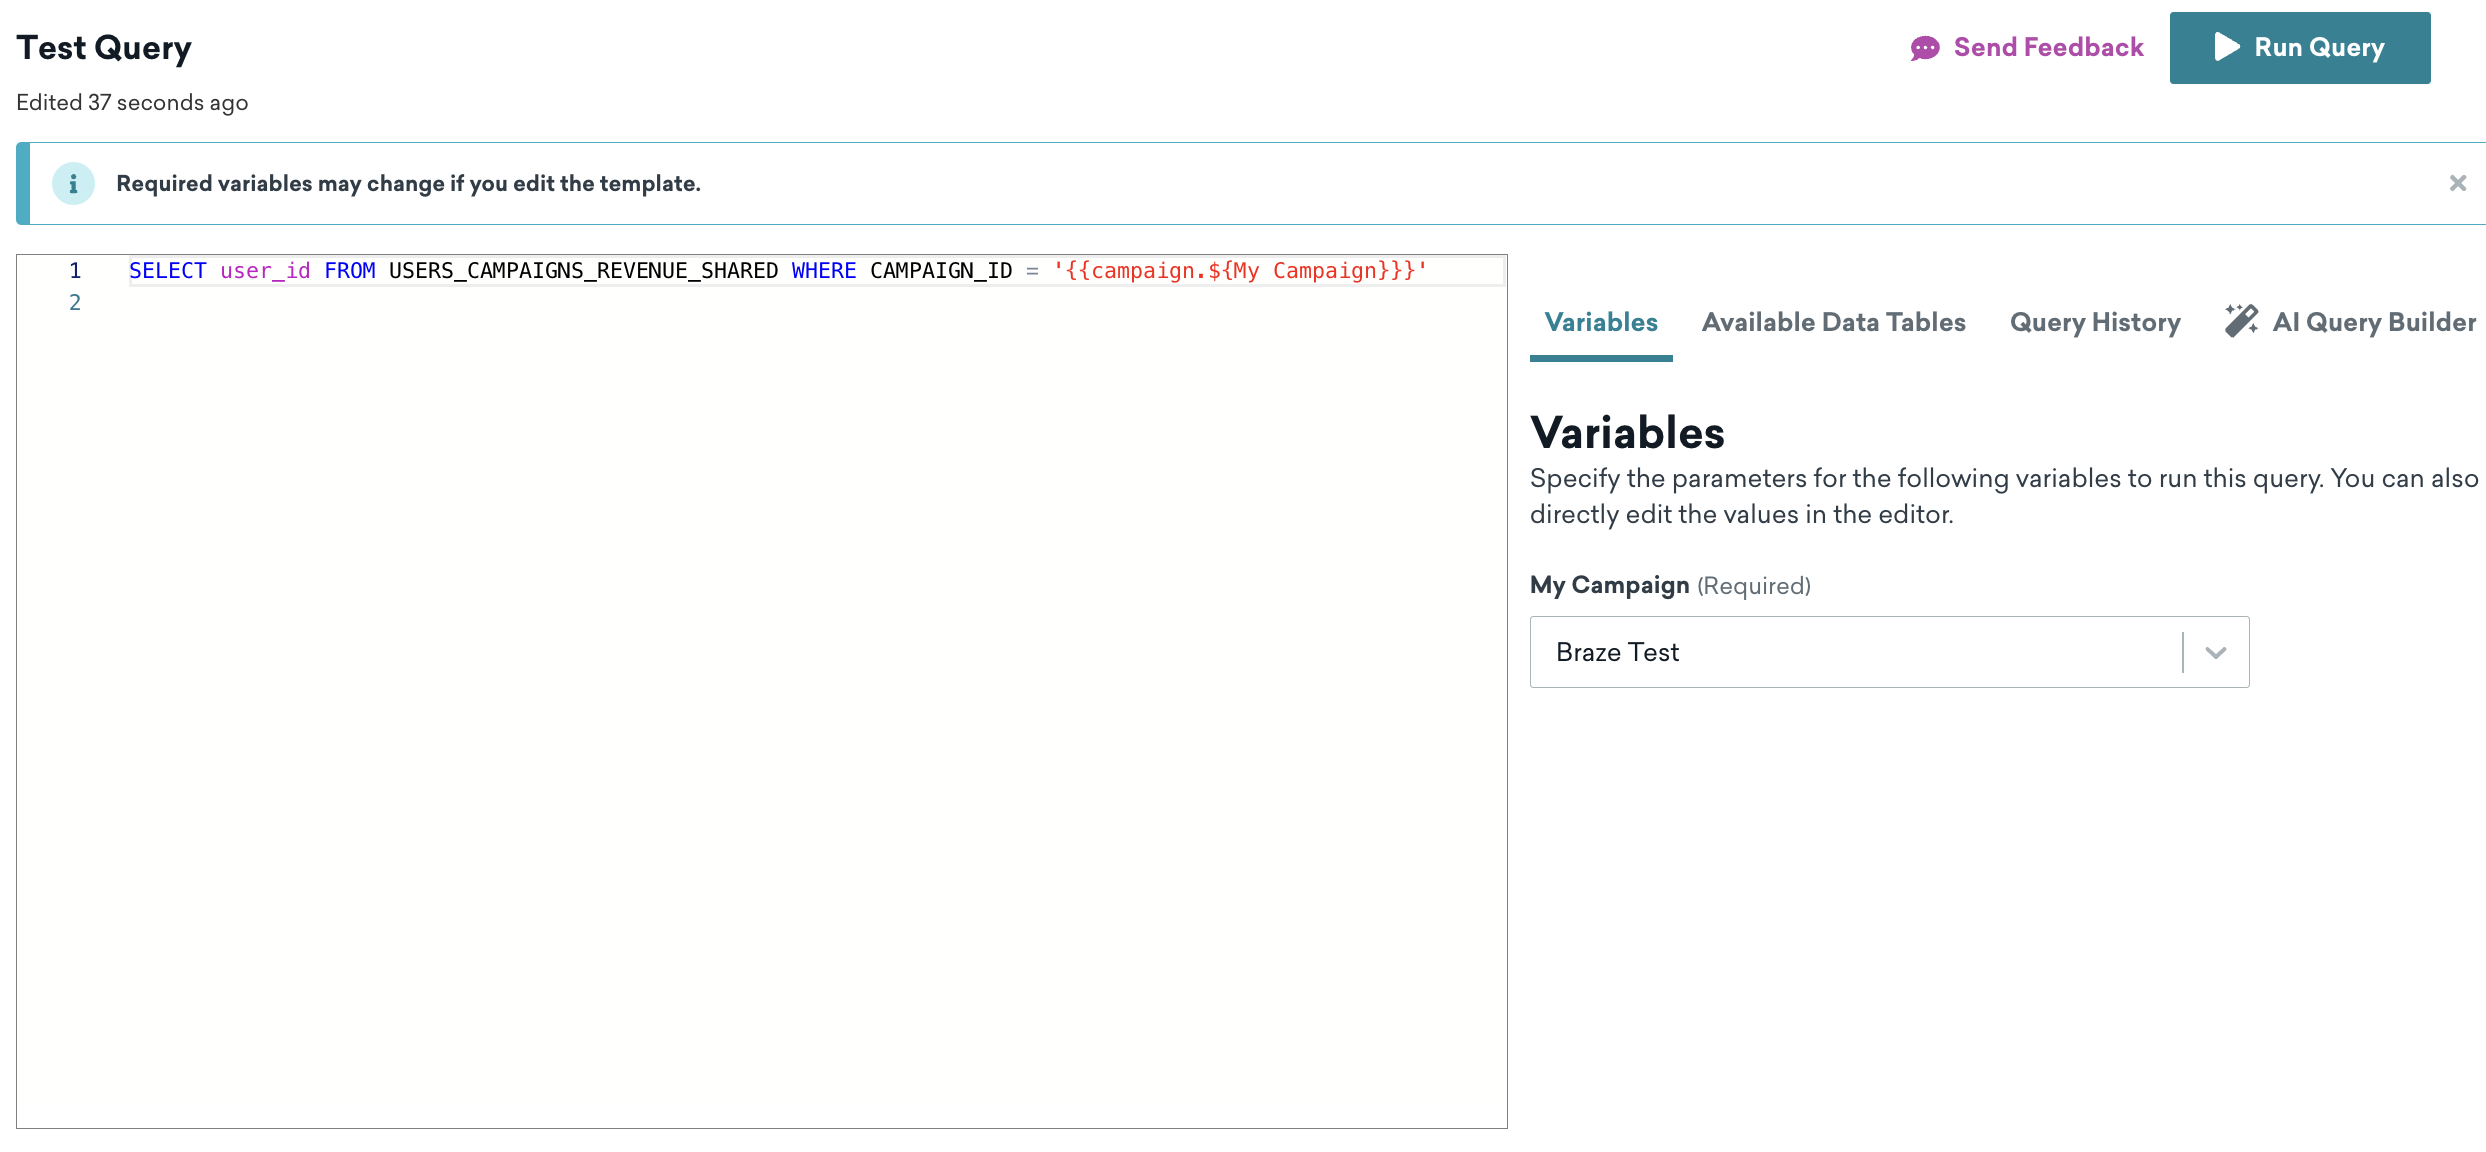
After a variable is created, it will appear in the Variables tab of your Query Builder report. Benefits of using SQL variables include:
- Save time by creating a campaign variable to select from a list when creating your report, instead of pasting in campaign IDs.
- Swap in values by adding variables that allow you to reuse the report for slightly different use cases in the future (such as a different custom event).
- Reduce user error when editing your SQL by reducing the amount of editing needed for each report. Teammates that are more comfortable with SQL can create reports that less technical teammates can then use.
Guidelines
Variables must adhere to the following Liquid syntax: {{ type.${name}}}, where type must be one of the accepted types and name can be anything you choose. The labels for these variables default to the variable name.
By default, all variables are mandatory (and your report will not run unless variable values are selected) except for the date range, which defaults to the past 30 days when the value isn’t provided.
Variable types
The following variable types are accepted:
- Number
- Date range
- Messaging
- Products
- Custom events
- Custom events properties
- Workspace
- Catalogs
- Catalog fields
- Options
- Segments
- String
- Tags
Number
- Replacement value: The provided value, such as
5.5 - Usage example:
some_number_column < {{number.${some name}}}
Date range
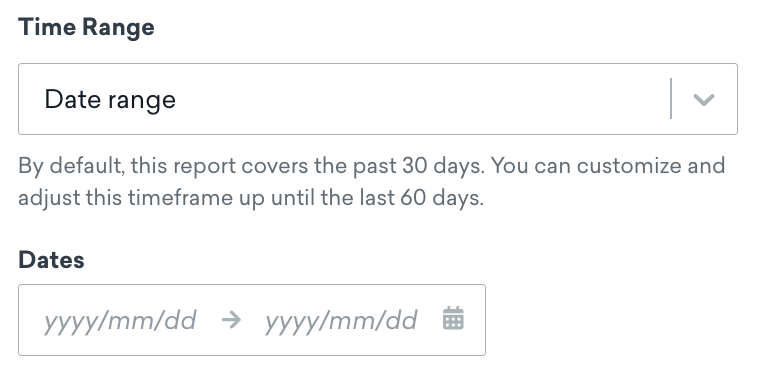
If both start_date and end_date are being used, they must have the same name so you can use them as a date range.
Example values
The date range type can be relative, start date, end date, or date range.
All four types are shown if both start_date and end_date are used with the same name. If only one is used, then only the relevant types will show.
| Date range type | Description | Required values |
|---|---|---|
| Relative | Allows you to specify the past X days | Requires start_date |
| Start date | Allows you to specify a start date | Requires start_date |
| End date | Allows you to specify an end date | Requires end_date |
| Date range | Allows you to specify both a start and end date | Requires both start_date and end_date |
- Replacement value: Replaces
start_dateandend_datewith a Unix timestamp in seconds for a specified date in UTC, such as1696517353. - Usage example: For all of relative, start date, end date, and date range variables:
time > {{start_date.${some name}}} AND time < {{end_date.${some name}}}- You can use either
start_dateorend_dateif you don’t want a date range.
- You can use either
Messaging
All messaging variables must share the same identifier when you want to tie their state together in one group.
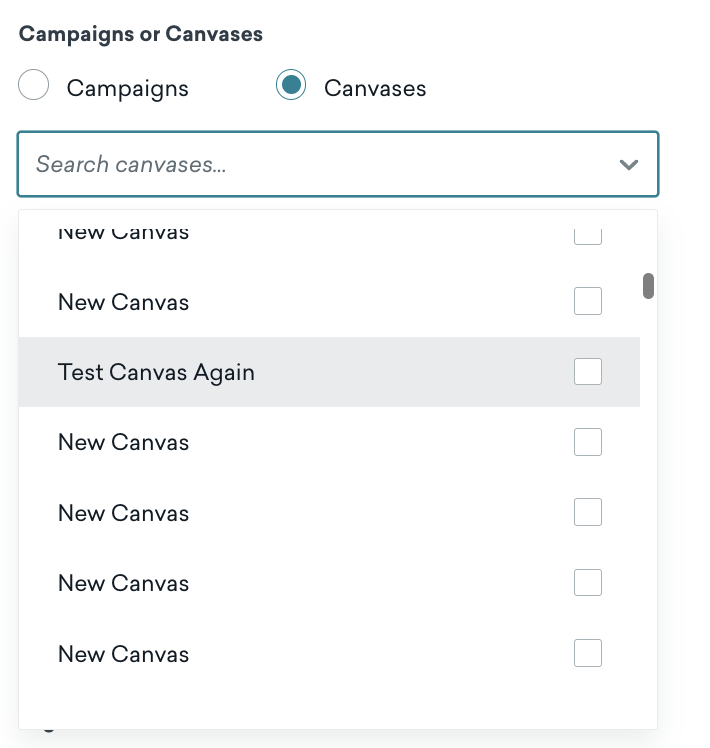
Canvas
For selecting one Canvas. Sharing the same name with a campaign will result in a radio button within the Variables panel that enables you to select either Canvas or campaign.
- Replacement value: Canvas BSON ID
- Usage example:
canvas_id = ‘{{canvas.${some name}}}’
Canvases
For selecting multiple Canvases. Sharing the same name with a campaign will result in a radio button within the Variables tab that allows you to select either Canvas or campaign.
- Replacement value: Canvases BSON IDs
- Usage example:
canvas_id IN ({{canvases.${some name}}})
Campaign
For selecting one campaign. Sharing the same name with a Canvas will result in a radio button within the Variables tab that allows you to select either Canvas or campaign.
- Replacement value: Campaign BSON ID
- Usage example:
campaign_id = ‘{{campaign.${some name}}}’
Campaigns
For multi-selecting campaigns. Sharing the same name with a Canvas will result in a radio button within the Variables tab that allows you to select either Canvas or campaign.
- Replacement value: Campaigns BSON IDs
- Usage example:
campaign_id IN ({{campaigns.${some name}}})
Campaign variants
For selecting campaign variants that belong to the selected campaign. It must be used in conjunction with a campaign or campaigns variable.
- Replacement value: Campaign variants API IDs, strings delimited by commas such as
api-id1, api-id2. - Usage example:
message_variation_api_id IN ({{campaign_variants.${some name}}})
Canvas variants
For selecting Canvas variants that belong to a chosen Canvas. It must be used in conjunction with a Canvas or Canvases variable.
- Replacement value: Canvas variants API IDs, strings delimited by commas such as in
api-id1, api-id2. - Usage example:
canvas_variation_api_id IN ({{canvas_variants.${some name}}})
Canvas Step
For selecting a Canvas step that belongs to a chosen Canvas. It must be used with a Canvas variable.
- Replacement value: Canvas step API ID
- Usage example:
canvas_step_api_id = ‘{{canvas_step.${some name}}}’
Canvas Steps
For selecting Canvas steps that belong to chosen Canvases. It must be used in conjunction with a Canvas or Canvases variable.
- Replacement value: Canvas steps API IDs
- Usage example:
canvas_step_api_id IN ({{canvas_steps.${some name}}})
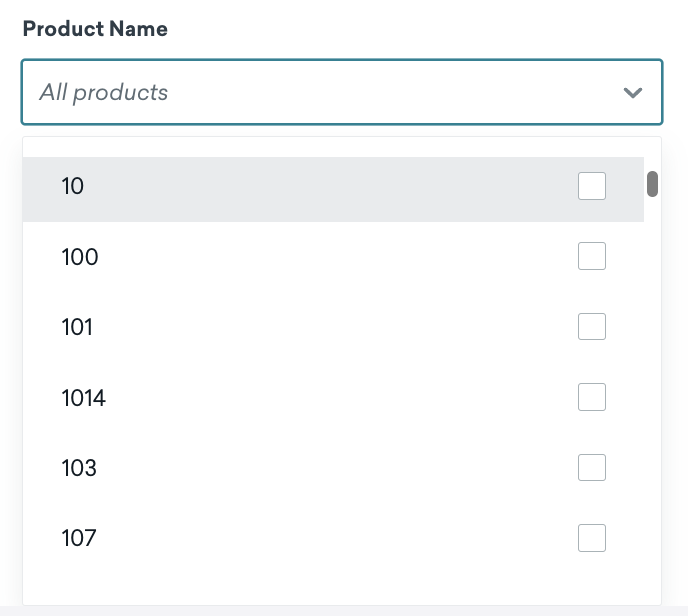
Products
For selecting a list of product names.
- Replacement value: Product names are surrounded by single quotes and separated by commas, such as in
product1, product2 - Usage example:
product_id IN ({{products.${product name (optional)}}})
Custom events
For selecting a list of custom events.
- Replacement value: Custom event property names are separated by commas such as in
event1, event2 - Usage example:
name = ‘{{custom_events.${event names)}}}’
Custom event properties
For selecting a list of custom event property names. It must be used with the custom events variable.
- Replacement value: Custom event property names are separated by commas such as in
property1, property2 - Usage example:
name = ‘{{custom_event_properties.${property names)}}}’
Workspace
For selecting a workspace.
- Replacement value: Workspace BSON ID
- Usage example:
workspace_id = ‘{{workspace.${app_group_id}}}’
Catalogs
For selecting catalogs.
- Replacement value: Catalog BSON IDs
- Usage example:
catalog_id = ‘{{catalogs.${catalog}}}’
Catalog Fields
For selecting catalog fields. It has to be used with the catalogs variable.
- Replacement value: Catalog field names
- Usage example:
field_name = '{{catalog_fields.${some name}}}’
Options
For selecting from a list of options.
- Replacement value: The value of the selected options
- Usage example:
- For select dropdown:
{{options.${metrics} | is_multi_select: 'true' | options: '[{"label": "test", "value": "test_value"}, {"label": "test2", "value": "test_value2"}]'}}is_multi_selectallows specifying whether the end user can select more than one option
- For radio button:
{{options.${metrics} | is_radio_button: 'true' | options: '[{"label": "test", "value": "test_value"}, {"label": "test2", "value": "test_value2"}]'}}
- For select dropdown:
Segments
For selecting segments that have Analytics Tracking enabled.
- Replacement value: The segment analytics ID, which corresponds to the IDs stored in the
user_segment_membership_idscolumn in the tables where this column is available. - Usage example:
{{segments.${analytics_segments}}}
String
For changing repetitive string values between report runs. Use this variable to avoid hardcoding a value multiple times in your SQL.
- Replacement value: The string as is without any surrounding quotes
- Usage example:
{{string.${some name}}}
Tags
For selecting tags for campaigns and Canvases.
- Replacement value: Campaigns and Canvases with single-quoted comma-separated BSON IDs that are associated with the selected tags
- Usage example:
{{tags.${some tags}}}
Variable metadata
Metadata can be attached to a variable to change its behavior. You can do this by appending the metadata with a pipe ( | ) character following the variable name. The ordering of the metadata doesn’t matter and you can append any number of them. Additionally, all types of metadata can be used for any variable, except for special metadata that is specific to certain variables (this will be indicated in those cases). The usage of all metadata is optional and is used to change the default’s variable behavior.
Usage example: {{string.${my var}| is_required: ‘false’ | description: ‘My optional string var’}}
Visible
For whether variables are visible. All variables are visible by default in the Variables tab, where you can input values.
There are several special variables whose value is dependent on another variable, such as whether another variable has a value. For these special variables, we mark them as not visible so they don’t show in the Variables tab.
Usage example: visible: ‘false’
Required
For whether variables are required by default. An empty value for a variable usually leads to an incorrect query.
Usage example: required: ‘false’
Order
For selecting the position of the variable in the Variables tab.
Usage example: order: ‘1’
Include single quotes
For surrounding the values of a variable with single quotes.
Usage example: include_quotes: ‘true’
Include double quotes
For surrounding the values of a variable with double quotes.
Usage example: include_double_quotes: ‘true’
Multi-select
For whether the select dropdown allows a single or multi-select. For now, you can include this metadata only if you use the Options variable.
Usage example: is_multi_select: ‘true’
Radio button
For showing options as radio buttons instead of a select dropdown in the Variables tab. You can include this metadata only if you use the Options variable.
Usage example: is_radio_button: ‘true’

Options
For providing the list of selectable options in the form of a label and value. The label is what gets shown and the value is what the variable gets replaced with when the option is selected. You can include this metadata only if you use the Options variable.
Usage example: options: '[{"label": "test", "value": "test_value"}, {"label": "test2", "value": "test_value2"}]'
Placeholder
For specifying the placeholder text shown in the variable’s input field.
Usage example: placeholder: ‘enter some value’
Description
For specifying the description text shown under the variable’s input field.
Usage example: description: ‘some description’
Default value
For specifying the default value for the variable when no value is specified.
Usage example: default_value: ‘5’
Hide label
For hiding the variable’s name label. The variable’s name is used as a default label.
Usage example: hide_label: ‘true’
Special variables
The following variables can be used with other variables:
Presence or absence of another variable’s value
For knowing whether a variable’s value is filled. This is useful for optional variables where you want to short-circuit a condition if a variable’s value is not filled.
- Replacement value:
trueorfalsedepending on the other variable’s value - Usage example:
{{string.${type_name_has_no_value} | visible: 'false'}} or {{string.${type_name_has_value} | visible: 'false'}}
type and name refer to the referenced variable. For example, to short-circuit the following optional variable: {{campaigns.${messaging}}, you can use the following:
{{string.${campaigns_messaging_has_no_value} | visible: 'false'}} OR campaign_id IN ({{campaigns.${messaging} | is_required: ‘false’}})
Data and results
Results, and exports of results, are tables that can contain up to 1,000 rows. For reports that require larger amounts of data, use another tool such as Currents or Braze’s export APIs.
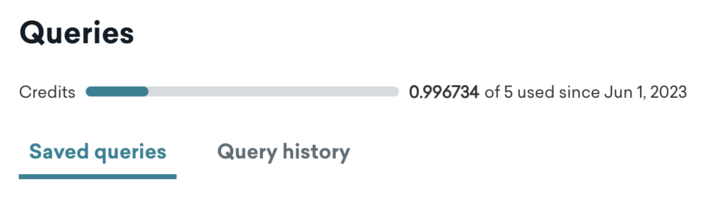
Monitoring your Query Builder usage
Each Braze workspace has 5 Snowflake credits available per month. A small portion of a Snowflake credit is used whenever you run a query or preview a table.
Snowflake credits are not shared between features. For example, credits across SQL Segment Extensions and Query Builder are independent of each other.
Credit usage is correlated to the run time of your SQL query. The longer the run time is, the higher the portion of a Snowflake credit a query will cost. Run time can vary depending on the complexity and size of your queries over time. The more complex and frequent queries you run, the larger your resource allocation and the faster your run time becomes.
Credits are not used when writing, editing, or saving reports within the Braze SQL editor. Your credits will reset to 5 on the first of each month at 12 am UTC. You can monitor your monthly credit usage at the top of the Query Builder page.
When you reach the credit cap, you cannot run queries, but you can create, edit, and save SQL reports. If you want to purchase more Query Builder credits, please get in touch with your account manager.
 Edit this page on GitHub