Exporting usage analytics
The Home page of the dashboard contains high-level data of app usage, as well as detailed statistics of different KPIs by date.
To obtain CSVs of information from this page:
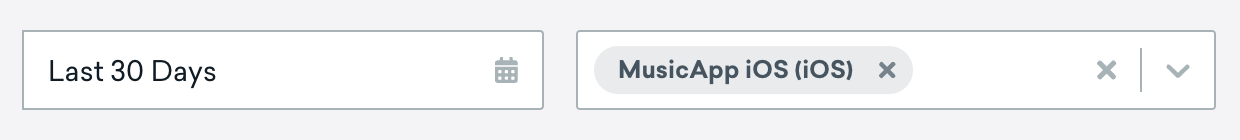
- Set the time frame and apps you want to view data for. By default, the dashboard shows the last 30 days of data for all apps.
- Scroll down to the Performance Over Time graph.
- Select the data you’d like to export in the Statistics For field. See the available data for you to export.
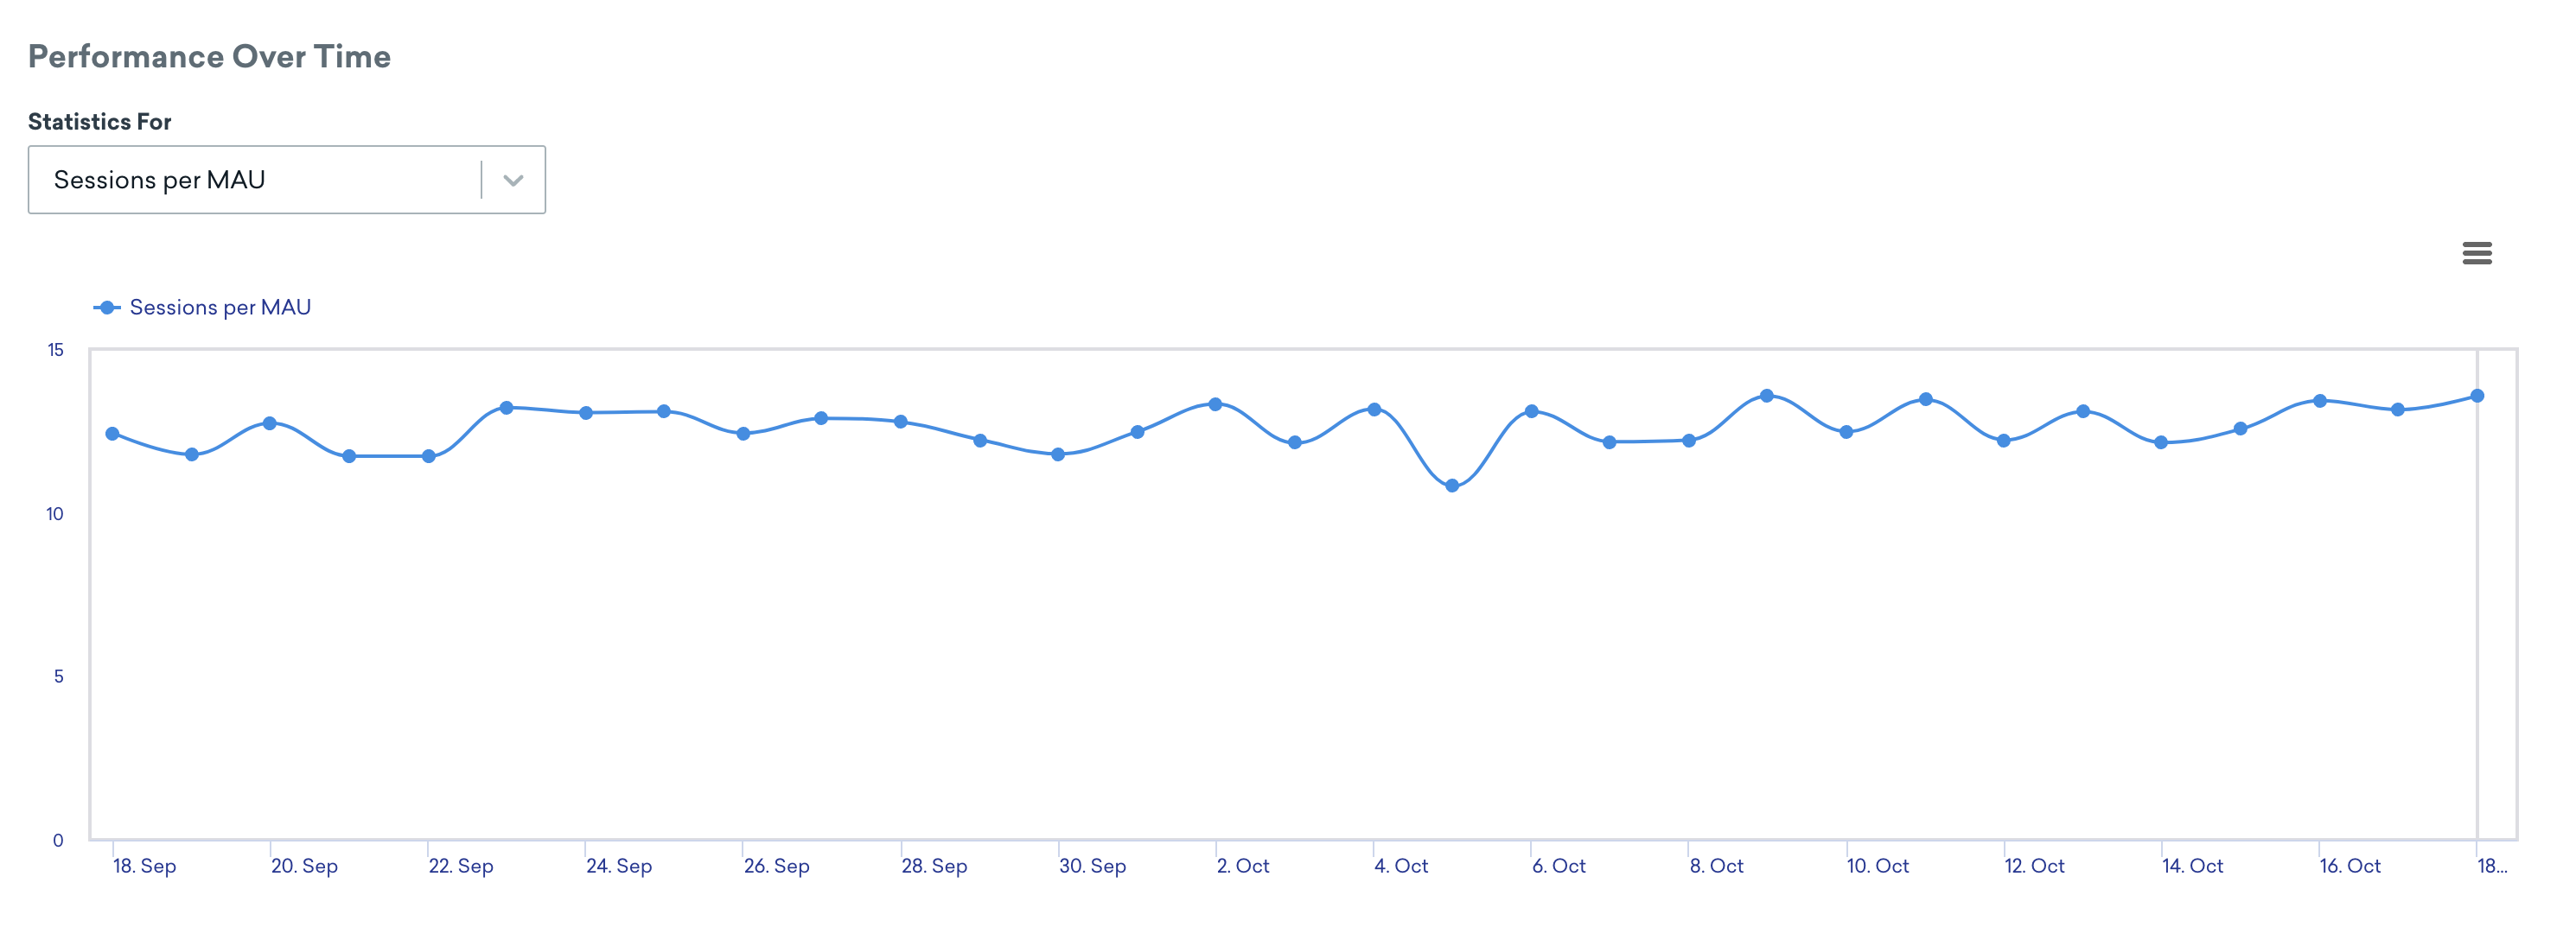
- Click and select your export option.
Available data
You can export CSVs with the following data:
- Session Count by Date
- (Optional) Session Count for Different Segments
- (Optional) Session Count for Different App Versions
- DAUs by Date
- (Optional) DAUs for Different Segments
- Email Statistics by Date
- Number of Emails Sent
- Number of Emails Delivered
- Number of Emails Opened
- Number of Email Clicks
- Number of Email Bounces
- Number of Emails Reported as Spam
- In-App Messages by Date
- Number of In-App Messages Sent
- In-App Message Impressions
- Number of In-App Messages Opened
- MAUs by Date
- Number of New Users by Date
- News Feed Impressions by Date
- Push Notifications by Date
- (Optional) Push Notifications for Different App Platforms
- Number of Push Notifications Sent
- Total Opens
- Direct Opens
- Bounces
- Session Count by Hour
- Session Count per MAU by Date
- Stickiness by Date
tip:
For help with CSV and API exports, visit our export troubleshooting article.
 Edit this page on GitHub
HOW HELPFUL WAS THIS PAGE?