Canvas analytics
You need to know if what you’re building is moving you toward your goals. With Canvas analytics, you can build a complete picture to understand how the experiences you’re building are impacting your goals.
Once you build your Canvas and set it live, navigate to the Canvas page and select your Canvas to open the details page. Here, you can measure and test the performance of your Canvas.
For per-channel campaign analytics (email, push, SMS, and more), see Campaign analytics. For funnel and retention analysis shared across campaigns and Canvases, see Funnel reports and Retention reports.
Canvas overview
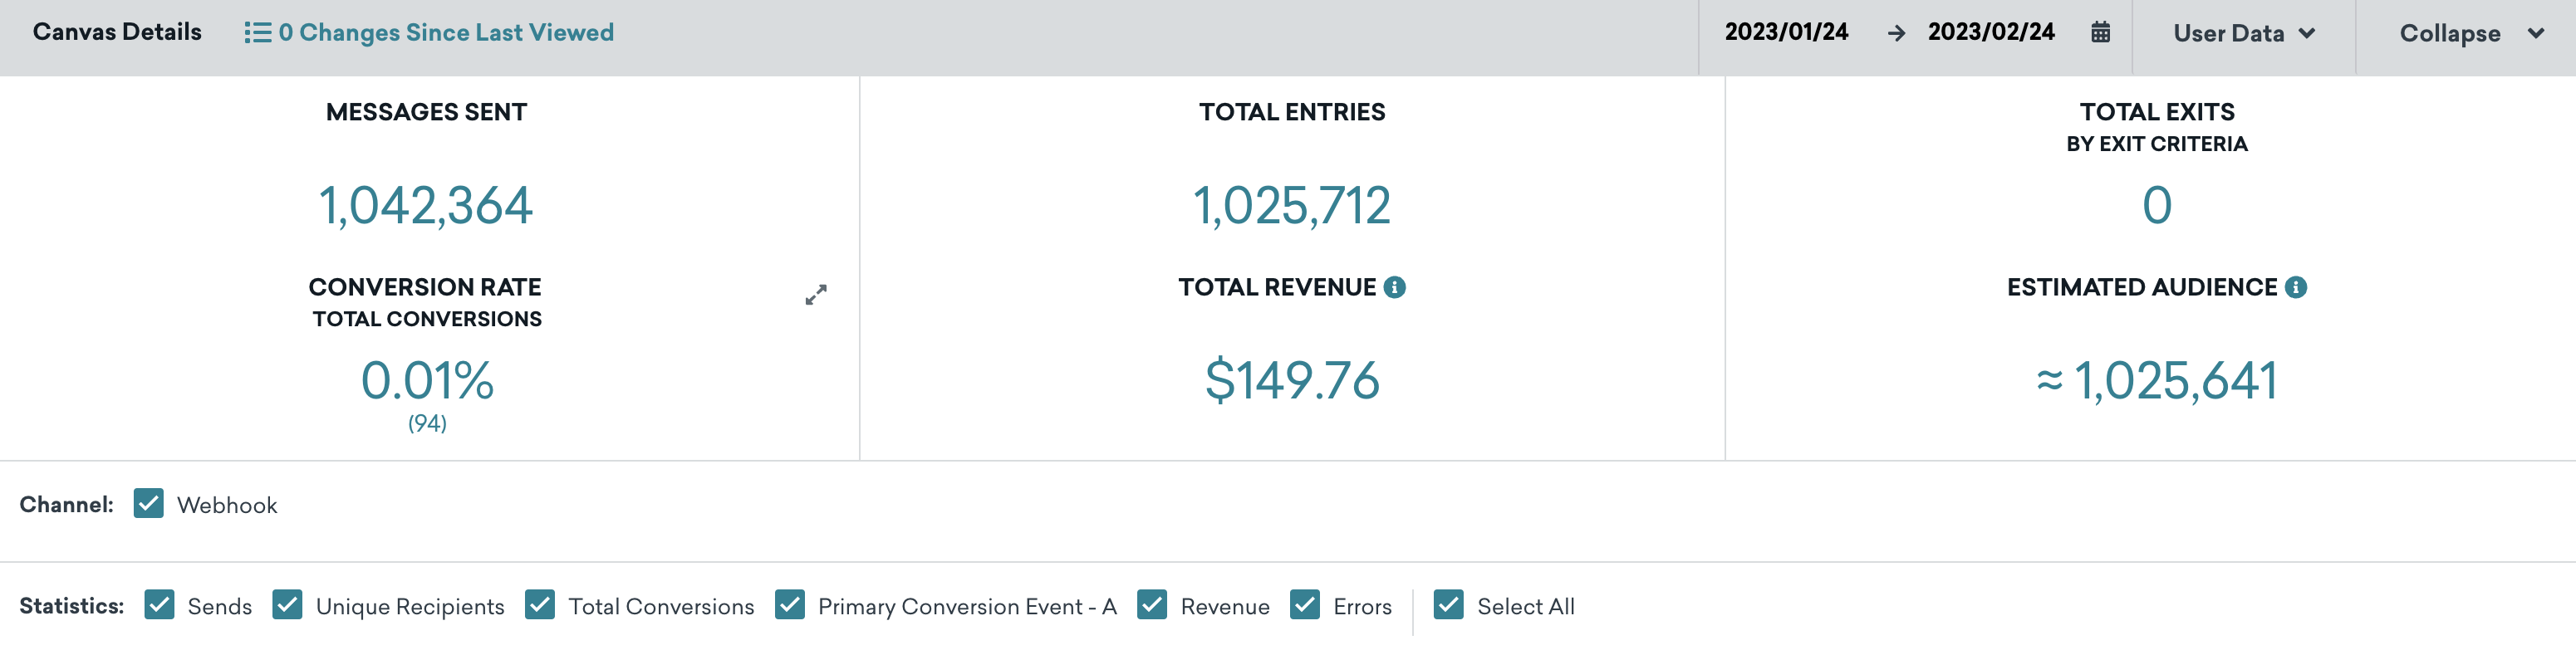
The top of the Canvas Details page contains top-line Canvas statistics. These include the number of messages sent within the Canvas, the total number of times customers have entered the Canvas, how many have converted and your total rate, the revenue generated by the Canvas, and the estimated total audience.
This is a great place to get a high-level overview to check how your Canvas is performing against your goal. To get notified proactively if a Canvas’s performance drops outside your expected range, refer to Custom Canvas alerts.
Total Revenue
Total Revenue is the total revenue within the conversion period from users who entered the Canvas, including users who haven’t received a message yet.
Select Show Revenue Breakdown next to Total Revenue to open a per-step table. The breakdown lists revenue for each step that has revenue data (including deleted steps) and a Not attributed to a step row for purchases that count toward Total Revenue but aren’t tied to a specific step—for example, when a user makes a purchase after entering the Canvas and before receiving a message.
Reachable users and exact statistics
When Calculate exact statistics is running for audiences tied to your Canvas, Braze may briefly show a rounded estimate in the Reachable users area. The exact total replaces the estimate when the calculation finishes. Select Show Additional Stats for a full per-channel breakdown. The Canvas builder documents the same flow under Target Population; see Calculating target population.
Performance by country
When Shopify Markets reporting is enabled, campaign and Canvas analytics include a Performance by country table. Each row is a country and currency combination. Currency and total revenue come from the order’s presentment_currency.
| Column | What it shows |
|---|---|
| Country | Each country attributed to the campaign or Canvas. Orders without a country appear as Unknown. |
| Currency | The presentment currency for that country’s revenue. |
| Total Revenue | Revenue attributed to that country, shown in the presentment currency. |
| Total Purchases | Purchases attributed to that country. |
The Total row sums Total Purchases only. Total Revenue is blank in the total row because rows can use different currencies and aren’t summed together.
You can also break down campaign and Canvas performance by country in Report Builder using Countries (Shopify Markets) as a row or drilldown.

If a segment you’ve built from Canvas activity shows fewer reachable users than you expect based on Canvas analytics, there are two common reasons:
- Estimation sampling: Segment statistics may display an estimate based on a random sample with a 95% confidence interval of ±1%, rather than an exact count.
- Users no longer matching criteria: Some users counted in Canvas analytics may no longer qualify for the segment—for example, because they unsubscribed or their profile data changed since the Canvas ran. Check the Historical Performance of the Canvas for a high volume of unsubscribes.
Changes Since Last Viewed
The number of updates to the Canvas from other members of your team is tracked by the Changes Since Last Viewed metric on the Canvas overview page. Select Changes Since Last Viewed to view a changelog of updates to the Canvas name, schedule, tags, message, audience, approval status, or team access configuration. For each update, you can see who performed the update and when. You can use this changelog to audit changes to your Canvases.
Performance visualization
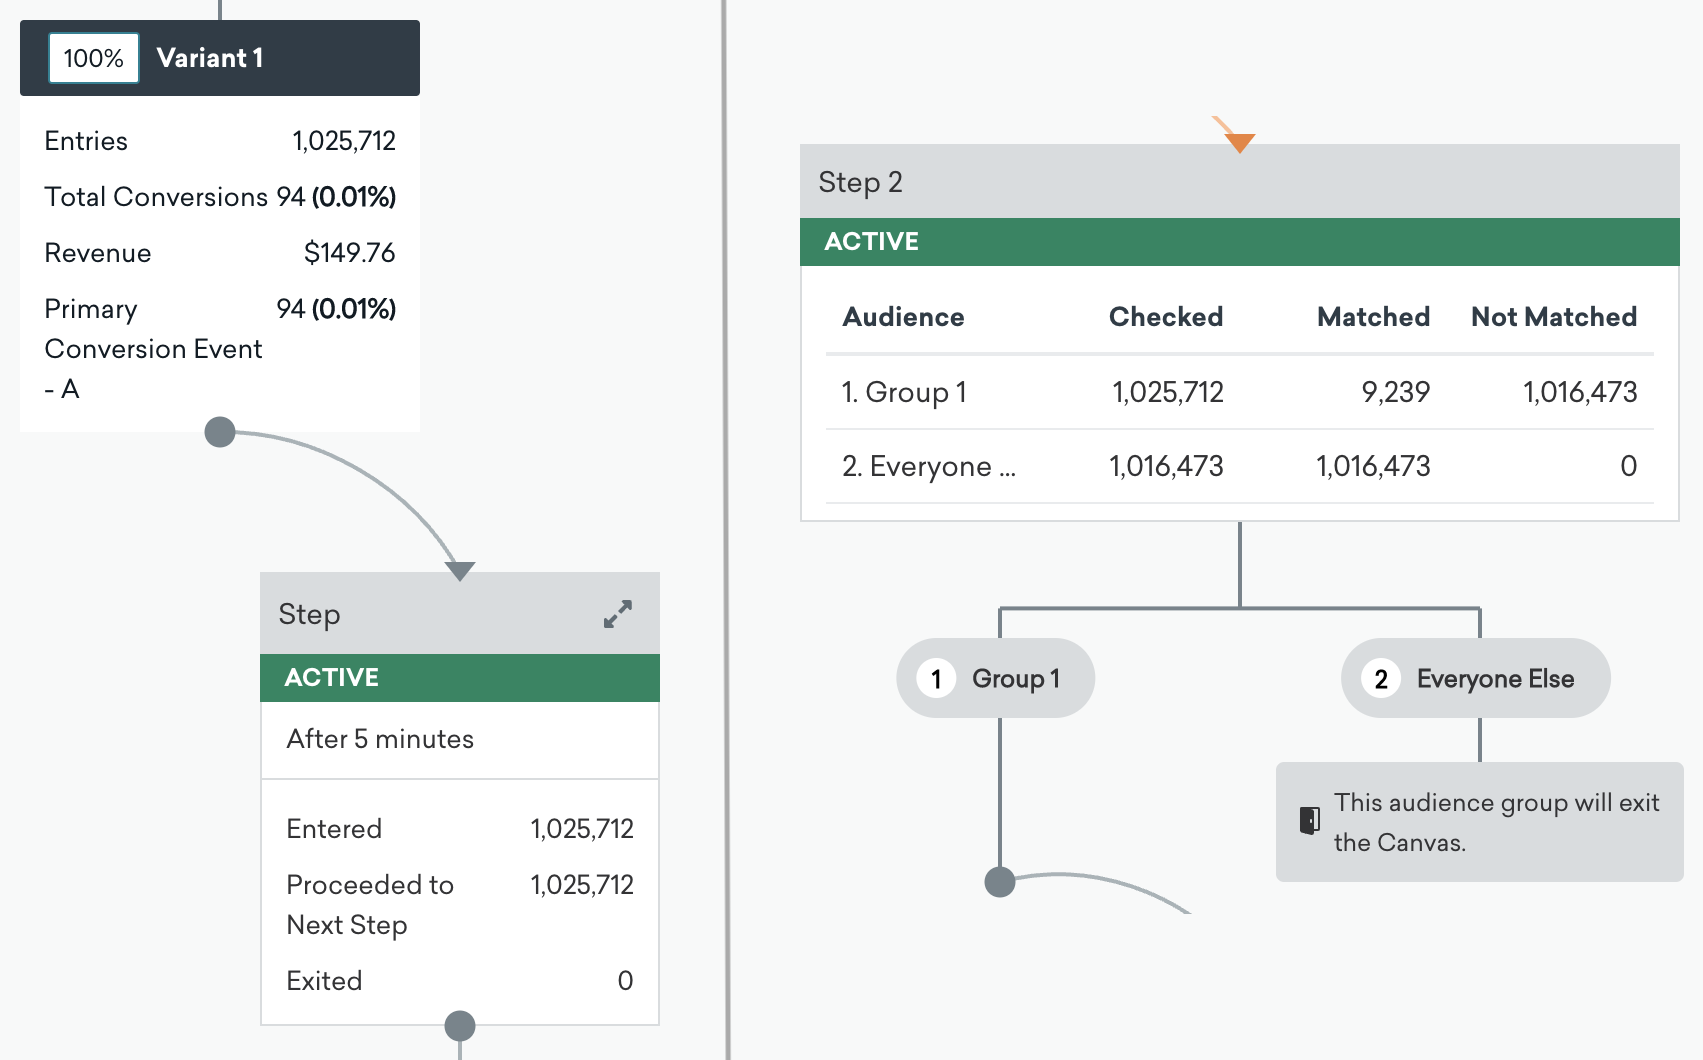
As you move down the Canvas Details page, you can see performance for each component—such as how many users entered, proceeded to the next step, or exited the Canvas. Select a specific Canvas step or component to focus the panel on that part of the journey and review its metrics in more detail.

For Canvas Flow, a user exits the Canvas after entering and receiving the message payload in the last step of the user journey.
The metrics also include impressions, unique recipients, conversion count, and revenue generated. You can click on a component to further breakdown your data and see channel-specific performance.
Performance breakdown by variant
At the bottom of the Canvas Details page, click Analyze Variants to open the Analyze Canvas modal. This modal contains three tabs:
- Analyze Variants
- Canvas Funnel Report
- Canvas Retention Report
Analyze Variants
In the Analyze Variants tab, you can see a breakdown of performance by variant and control group, if you have more than one. You can also copy the Canvas API identifier, download a CSV file of the metrics, and copy the cells. The Analyze Variants tab contains a table which shows you a breakdown of each variant at several levels.
You can quickly infer effective variants and identify the right cadences, content, triggers, timing, and more.
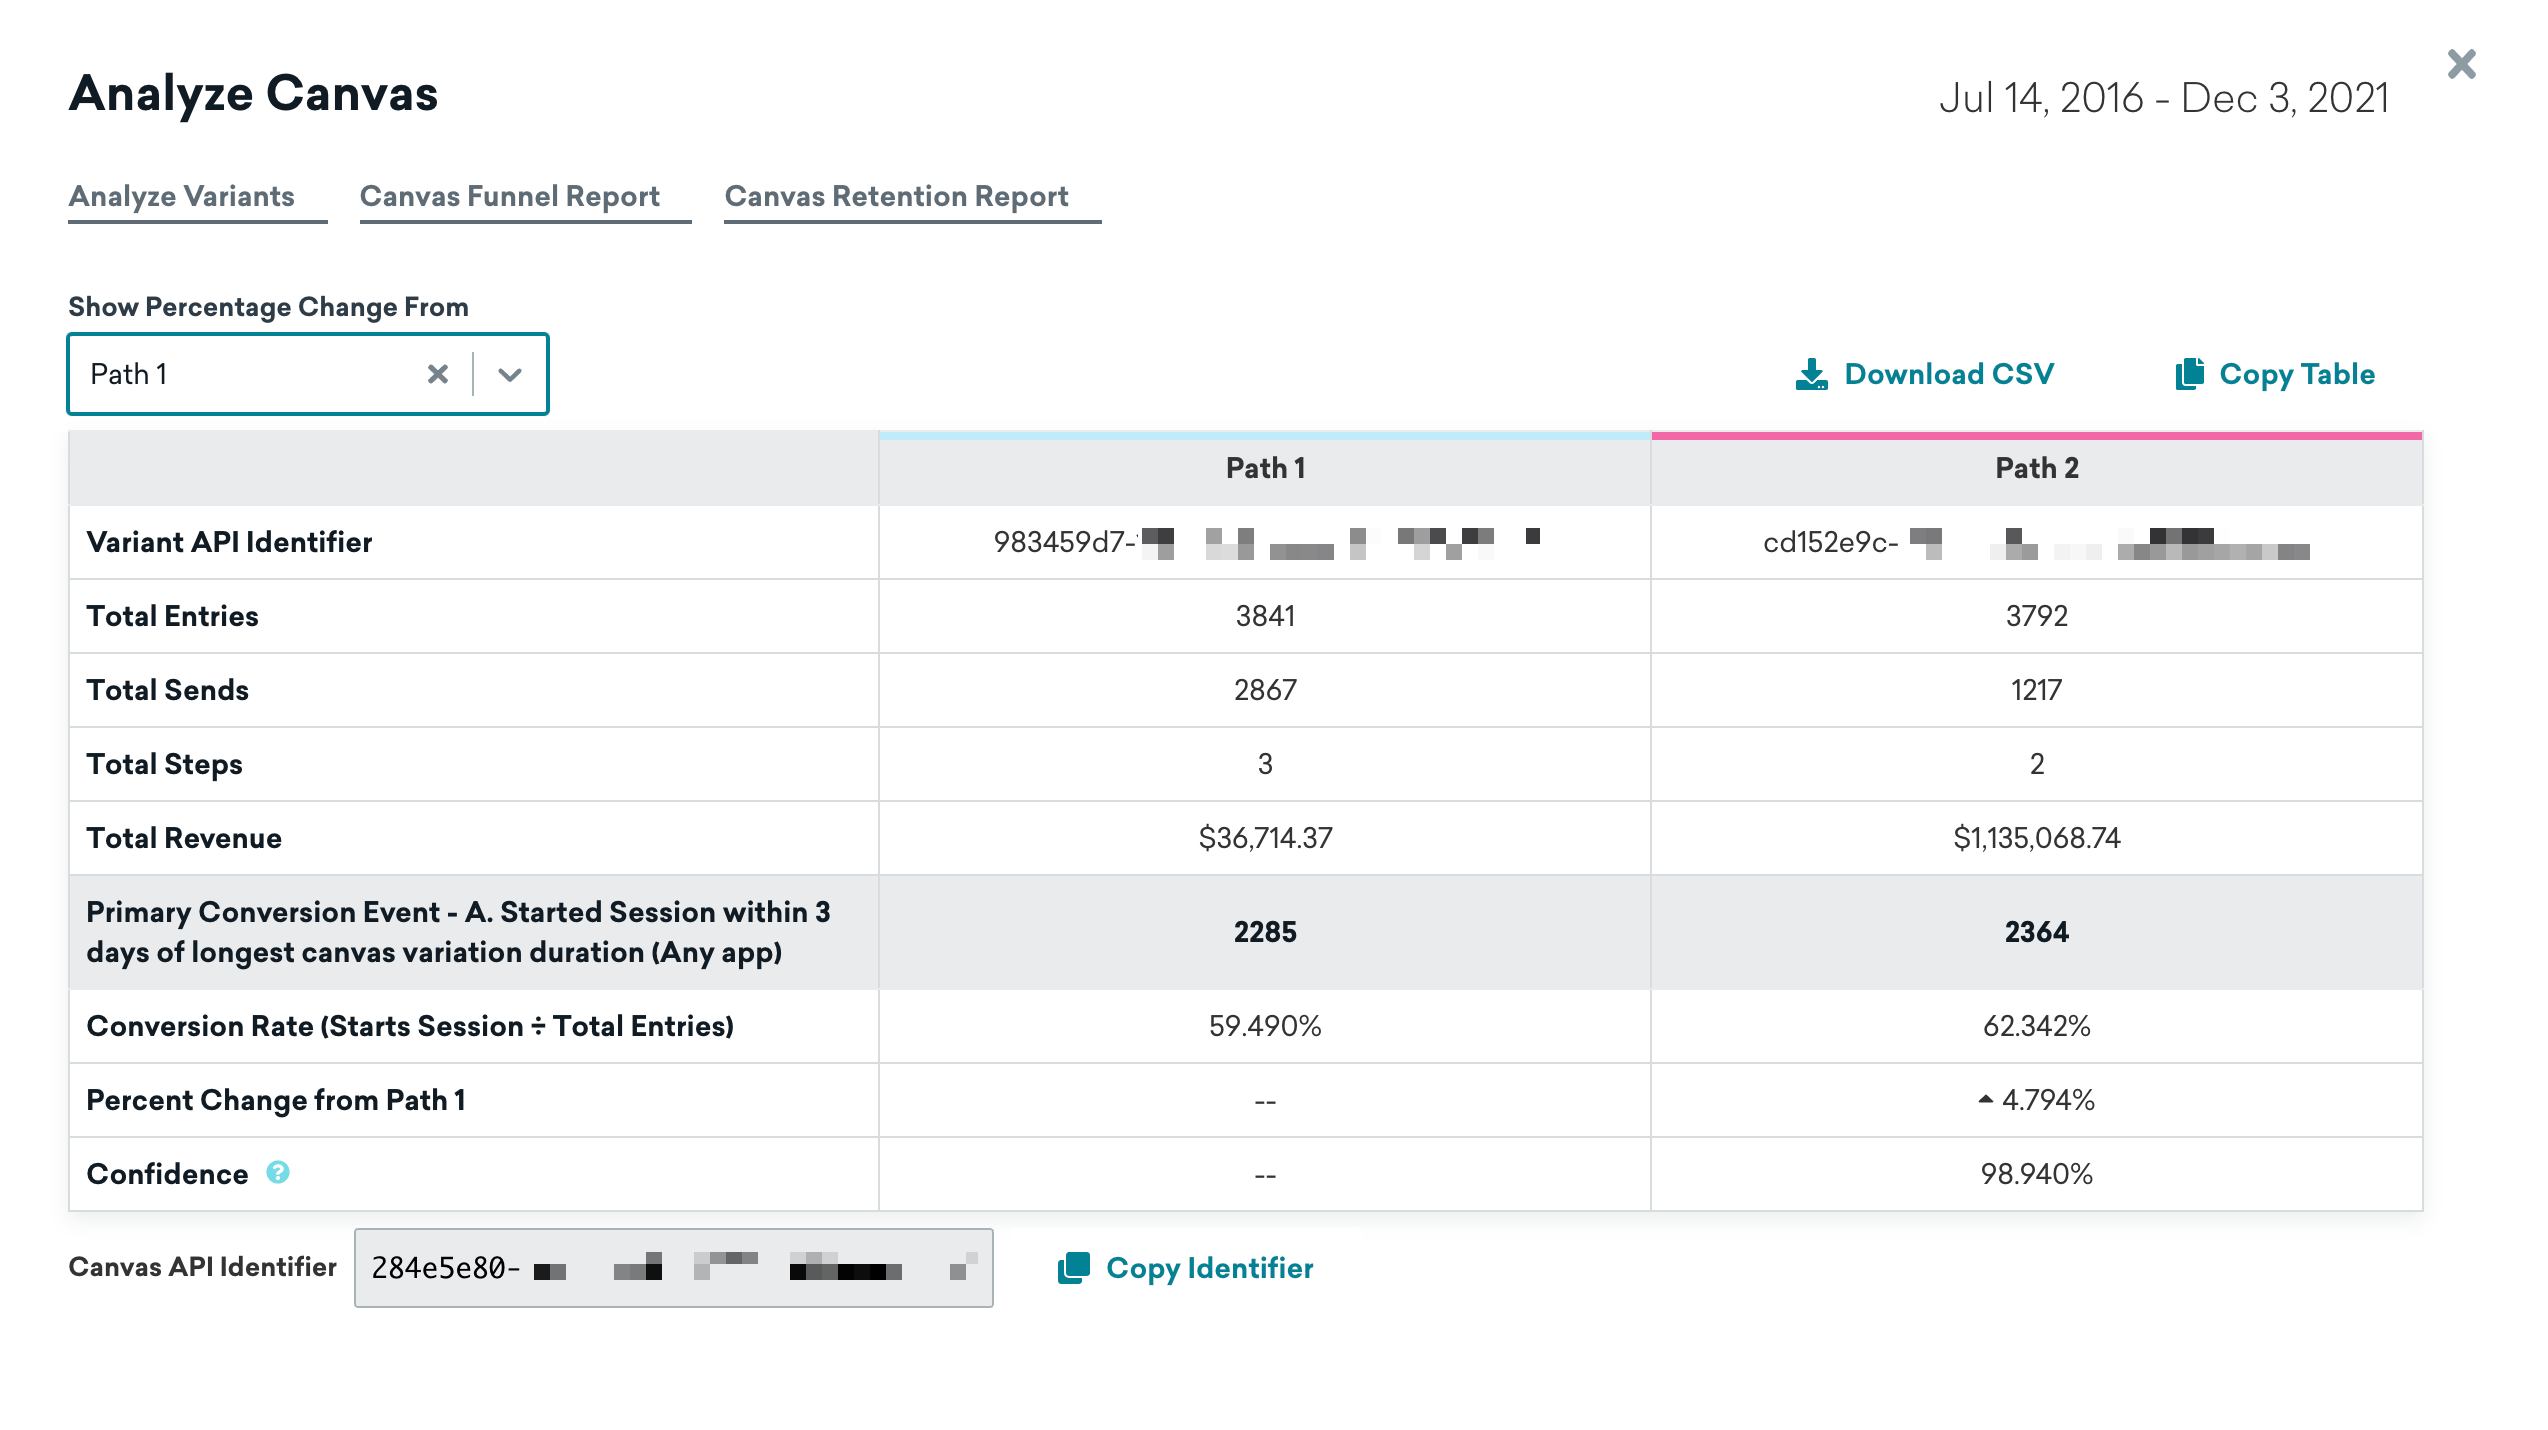
Basic metrics include the following:
- Variant API Identifier: The API identifier of your variant, which you can use in your API calls.
- Total Entries: The total number of users that have entered the Canvas variant.
- Total Sends: The total number of messages sent in the Canvas variant.
- Total Steps: The total number of steps in the Canvas variant.
- Total Revenue: The total revenue in dollars within the set primary conversion window from users who entered that variant, including users who haven’t received a message.
Beyond that, you can see a more explicit breakdown of conversion events, including the following:
- Conversion totals and conversion rates for each conversion event
- Uplift against the control variant
- Statistical confidence for each conversion event
How revenue is attributed
Like conversions, revenue is tracked at the Canvas level and attributed to the most recent component or step and the most recent variant from which the user has received a message (or entered, if they haven’t received a message yet). Purchases count toward Total Revenue even when the user doesn’t perform the configured primary conversion event, as long as the purchase falls within the attribution rules for the window. Revenue attributed to a step follows the same rules as the revenue breakdown on the Canvas overview.
For example, if a user completes two steps and then makes a purchase, that revenue is attributed to the second step and to the variant they entered. If they enter the Canvas but make a purchase before receiving the first Canvas step, that revenue is attributed to the variant they entered and appears under Not attributed to a step in the revenue breakdown.
How conversions are tracked
A user can only convert once per conversion event per Canvas entry. Conversions are assigned to the most recent message received by the user for that entry. The Canvas summary reflects all conversions performed by users in that path and whether or not they received a message. Each subsequent step only shows conversions that happened while that was the most recent step the user received.
Consider the following example: a Canvas has 10 push notifications and the conversion event is “Opens App” (or “Session Start”).
- User A opens the app after entering but before receiving the first message.
- User B opens the app after each push notification.
The Canvas summary shows two conversions while the individual steps show one conversion on the first step and none for all subsequent steps. If Quiet Hours are active when the conversion event happens, the same rules apply.
Now, let’s say we have a Canvas with Quiet Hours and the following events occur:
- User A enters a Canvas.
- The first step is a Delay step within the set Quiet Hours, so the message is suppressed.
- User A performs the conversion event.
User A counts as converted in the overall Canvas variant, but not the step since they didn’t receive the step.
For our last example, let’s say we have a Canvas with re-eligibility turned on. If a re-eligible user performs the conversion event on the first entry and second entry, two conversions are counted.
Funnel and retention reports
From Analyze Variants, open the Canvas Funnel Report or Canvas Retention Report tab to analyze post-entry journeys and long-term retention.
For setup steps, available events, interpretation guidance, and FAQs, see: