Item recommendation analytics
Learn about item recommendation analytics and how to view them in Braze.
View analytics
You can view analytics for your recommendation to see which items users were recommended and how accurate the recommendation model was.
- Go to Analytics > Item Recommendation.
- Select your recommendation from the list.
Available metrics
Audience
These metrics describe your recommendation audience. Depending on the recommendation type and available analytics data, the Audience section can include Precision and Coverage.
For AI Personalized recommendations, the Recommendation type card shows the estimated personalization rate, users with the configured event, and total population. For Most Recent recommendations, it shows the share of users receiving Most Recent recommendations versus the Most Popular fallback. Most Popular and Trending recommendations don’t show a user-level recommendation type breakdown.
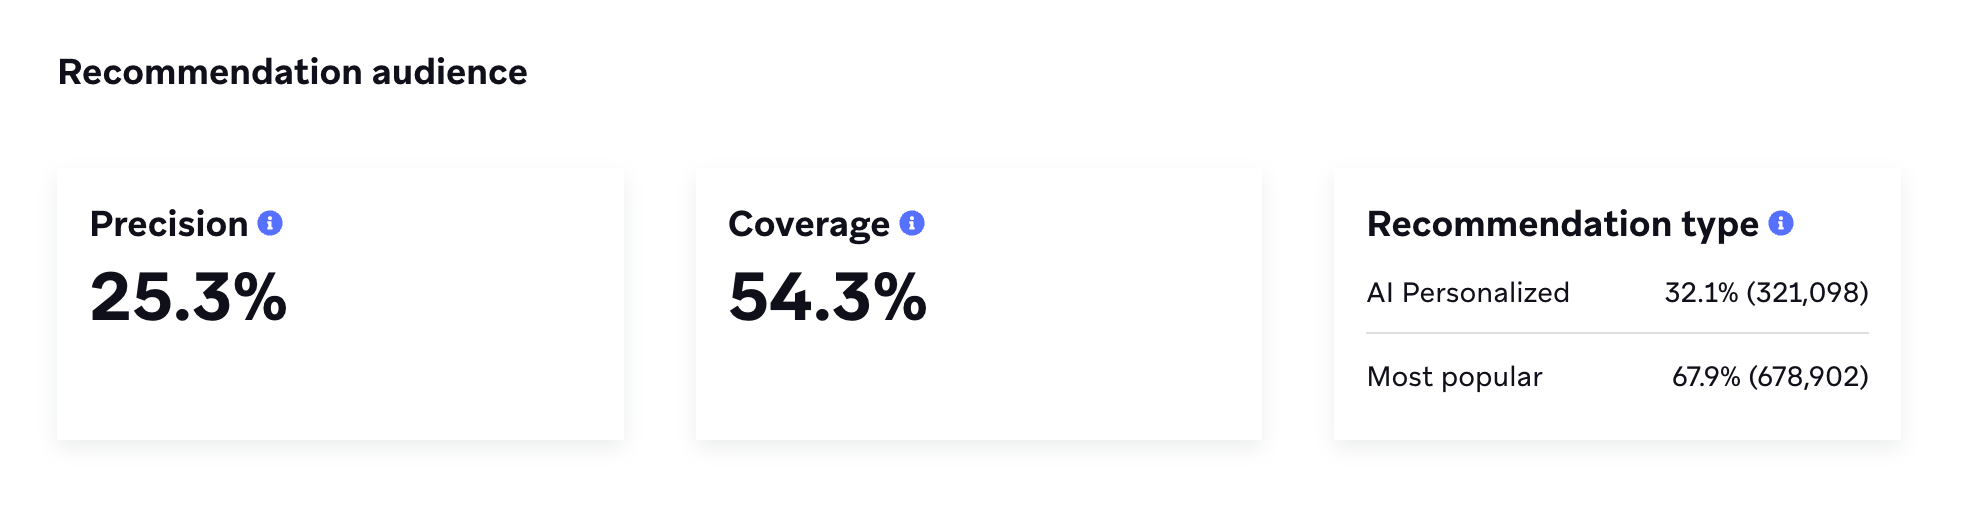
Refer to the following table for more information:
| Metric | Description |
|---|---|
| Precision | The percentage of time the model’s top prediction matched the user’s actual next purchase. During training, Braze compares its single most likely prediction with what the user actually purchased next in a set of interactions held back from training. Precision is heavily dependent on your specific catalog size and mix, and should be used as a guide to understand how often the model is correct. In past testing, models have performed well with precision numbers ranging from 6-20%. This metric updates when the model next retrains. |
| Coverage | What percentage of available items in the catalog are recommended to at least one user. You can expect to see higher item coverage with personalized item recommendations over most popular ones. |
| Personalization rate | For AI Personalized recommendations, the estimated percentage of users with personalized recommendations stored on their profile, calculated against the total number of users who have performed the configured event in the past 24 months. Users who performed the event but don’t have enough data to generate a personalized recommendation receive most popular items as a fallback when messaged. |
| Recommendation type | For Most Recent recommendations, the percentage of users who receive Most Recent recommendations compared to the Most Popular fallback. |
Items
This table includes metrics about your personalized, most recent, and most popular items from your catalog.
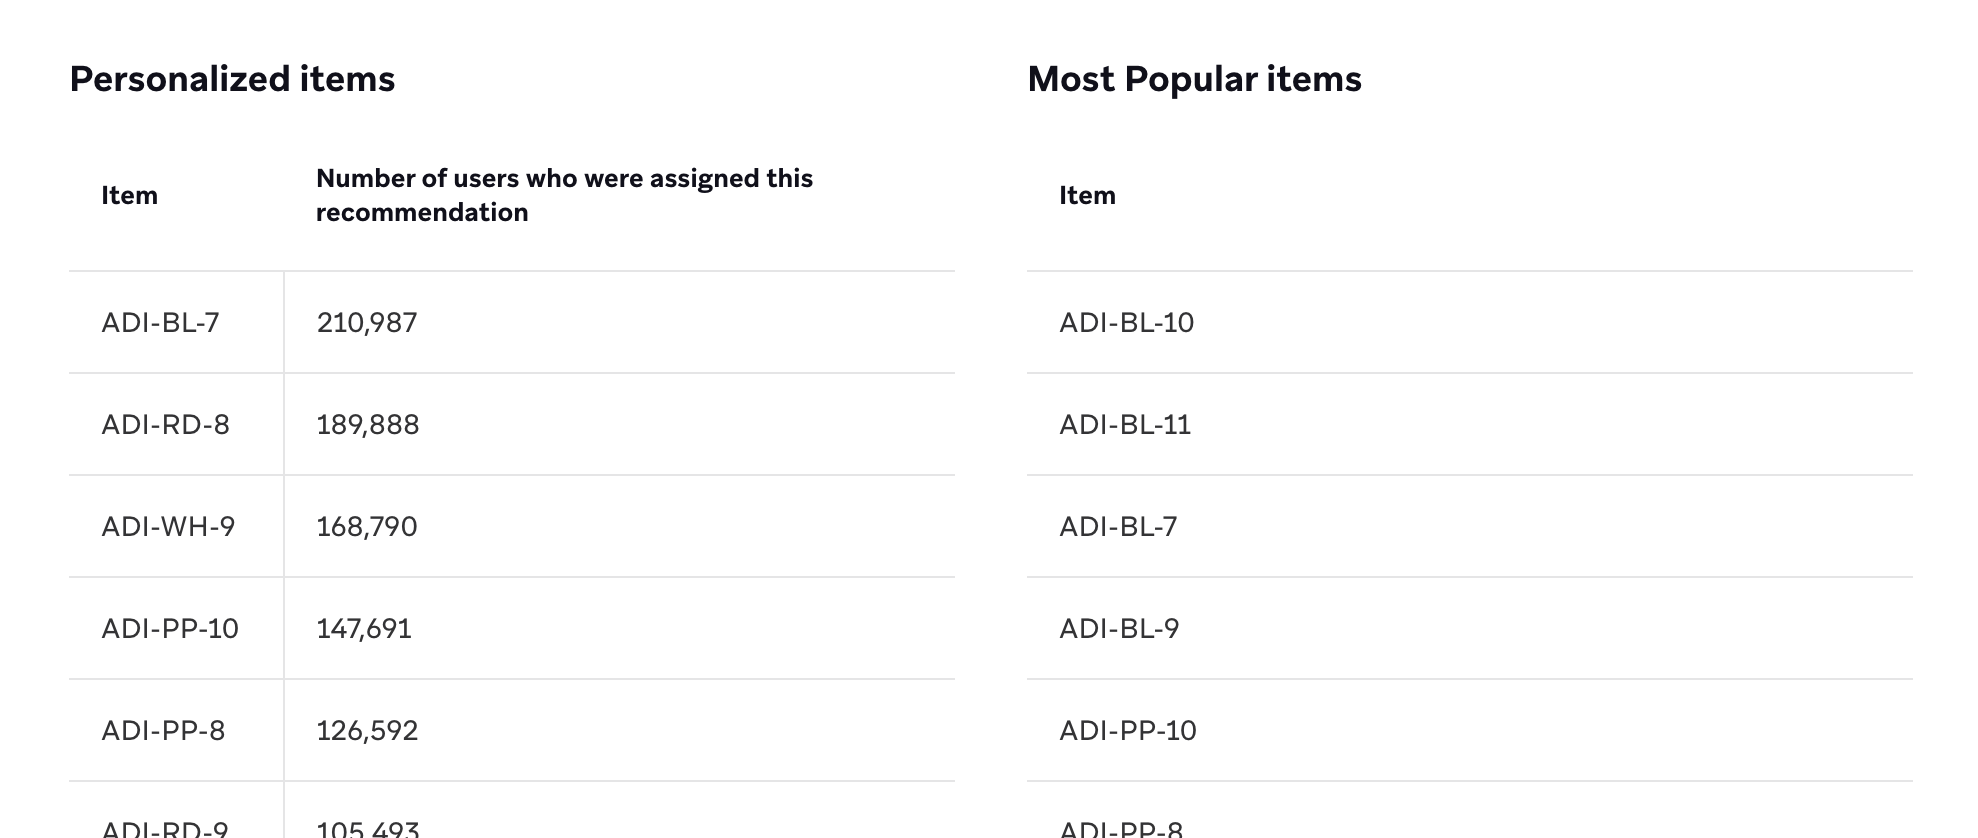
Refer to the following table for more information:
| Metric | Description |
|---|---|
| Personalized items Most recent items |
This column lists each item from the recommendation model in descending order of most often recommended to users. These are model-generated personalized or most recent recommendations. Most popular fallback items appear in the Most Popular items column. The count shows how many users were assigned each item by the model. Either Personalized or Most recent items will be listed depending on the recommendation type. |
| Most Popular items | This column lists each item in the catalog in descending order of popularity. Popularity here refers to items in the catalog that users interact with most often in the entire workspace. Most popular is used as the fallback when personalized or most recent cannot be calculated for an individual user. |
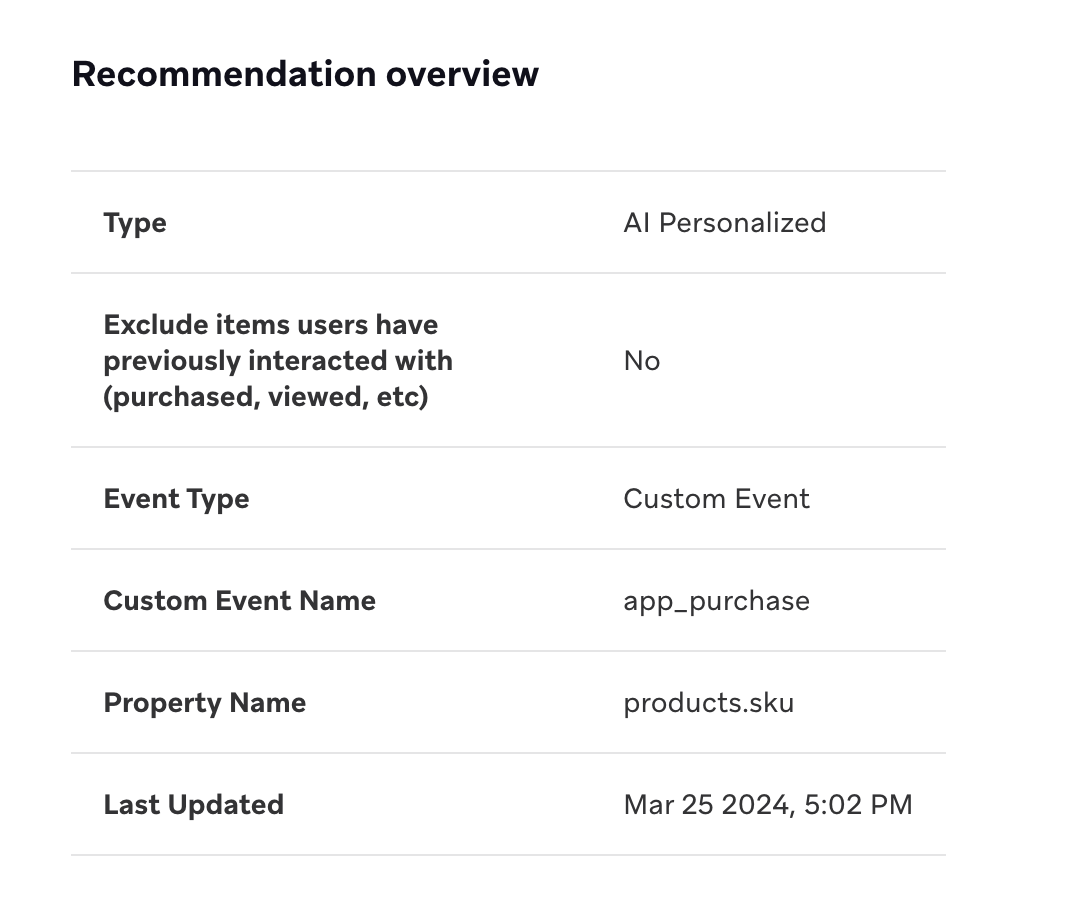
Overview
This is an overview of your chosen recommendation configuration, which includes when the recommendation was last updated.