Channel performance dashboards
Channel performance dashboards show aggregate performance metrics for an entire channel, from both campaigns and Canvases. These dashboards are available for email, push, and SMS, MMS, and RCS—including RCS and SMS fallback metrics on the SMS/MMS/RCS Performance dashboard.
This page covers filters, time-period comparison, and other settings that apply across all channel performance dashboards. For channel-specific metrics and reports, select a dashboard:
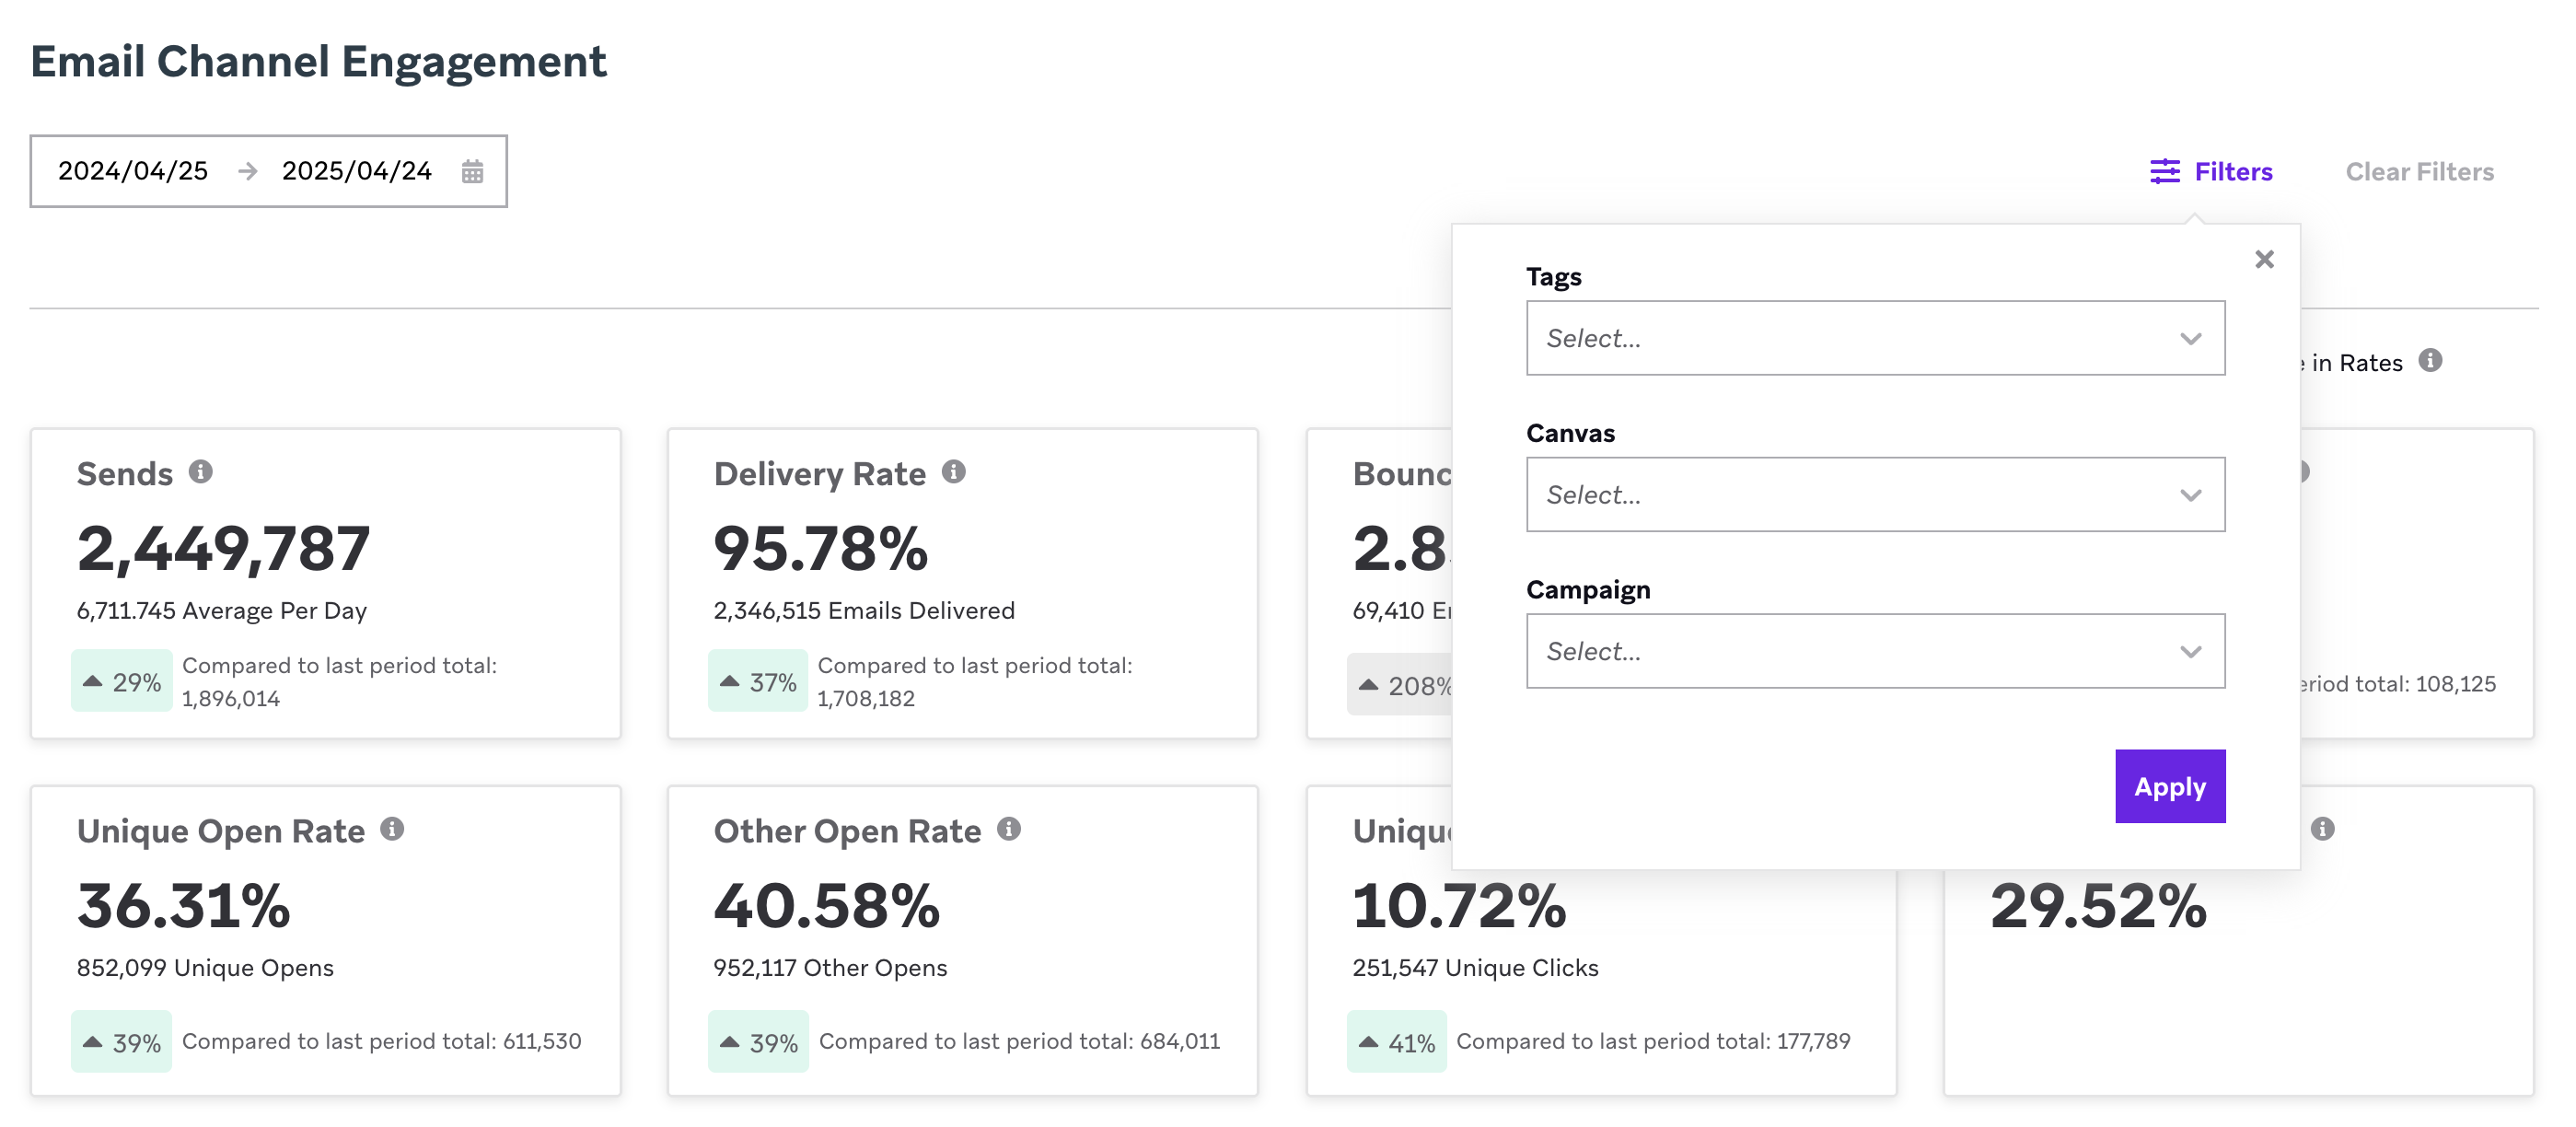
Dashboard filters
You can filter the data on your dashboard using the following filter options:
- Tag: Choose one tag. When applied, your dashboard will show metrics for only your selected tag. Note that the Push dashboard supports multiple tags.
- Platforms: (Push dashboards only) Choose a push platform, such as All Push, Android, iOS, Mobile combined, Kindle, or Web. When applied, your dashboard displays metrics for only your selected platform.
- Canvas: Choose up to 10 Canvases. When applied, your dashboard will show metrics for only your selected Canvases. If you select a tag filter first, then your options for Canvas filters only include Canvases that have your selected tag.
- Campaign: Choose up to 10 campaigns. When applied, your dashboard will show metrics for only your selected campaigns. If you select a tag filter first, then your options for campaign filters only include campaigns that have your selected tag.

Filters apply differently across the push dashboards. The push performance dashboard supports all filters. The push deliverability dashboard supports date range only, with a platform breakdown shown on each chart. The frequency and cadence reports on the push insights dashboard support date range only.
Comparing time periods
The channel performance dashboard automatically compares the time period you have selected in the date range versus the prior time period, totaling the same number of days. For example, if you choose “Last 7 Days” as your date range in the dashboard, the comparison to the last period will compare the metrics from the last seven days against the seven days prior. If you select a custom date range—let’s say May 10 to May 15, which is six days’ worth of data—the dashboard will compare the metrics from across those days to the metrics from May 4 to May 9.
The comparison is the percentage change between the last and current periods, calculated by taking the difference between the two periods and dividing it by the metric from the last period.
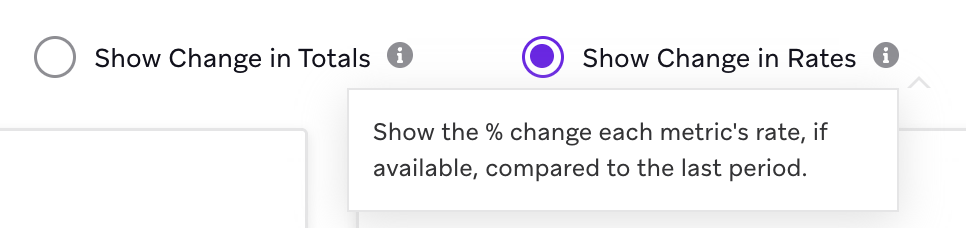
Viewing changes in total counts and rates
You can switch between Show Change in Totals—which compares the total counts (such as the number of emails delivered) between the two periods—and Show Change in Rates—which compares the rates (such as the delivery rate).
Frequently asked questions
Why is my dashboard displaying empty values?
There are a few scenarios that could lead to empty values for a metric:
- Braze recorded zeros for that particular metric in your selected date range.
- You haven’t sent any messages during the selected date range.
- While there were metrics such as opens, clicks, or unsubscribes for a selected date range, there were no deliveries or sends. In this case, Braze does not calculate a rate metric.
To see more metrics, try expanding the date range.
For email-specific open metrics, see Email performance dashboards. For push frequency and cadence questions, see Push performance dashboards.