Push performance dashboards
The Push Performance, Push Insights, and Push Deliverability dashboards show aggregate push metrics across campaigns and Canvases.
For filters, time-period comparison, and other settings that apply across channels, see Channel performance dashboards.
Prerequisites
To view these dashboards, you need the “View Usage Data” or “View Dashboard Reports” permission for your workspace.
Push performance dashboard
The Push Performance dashboard gives you a channel-level view of push engagement across all your campaigns and Canvases, so you can understand the health of the channel without rolling up data from individual messages.
To open the dashboard, go to Analytics > Push Performance, and select the date range for the period you want to view data. Your date range can be up to one year in the past.
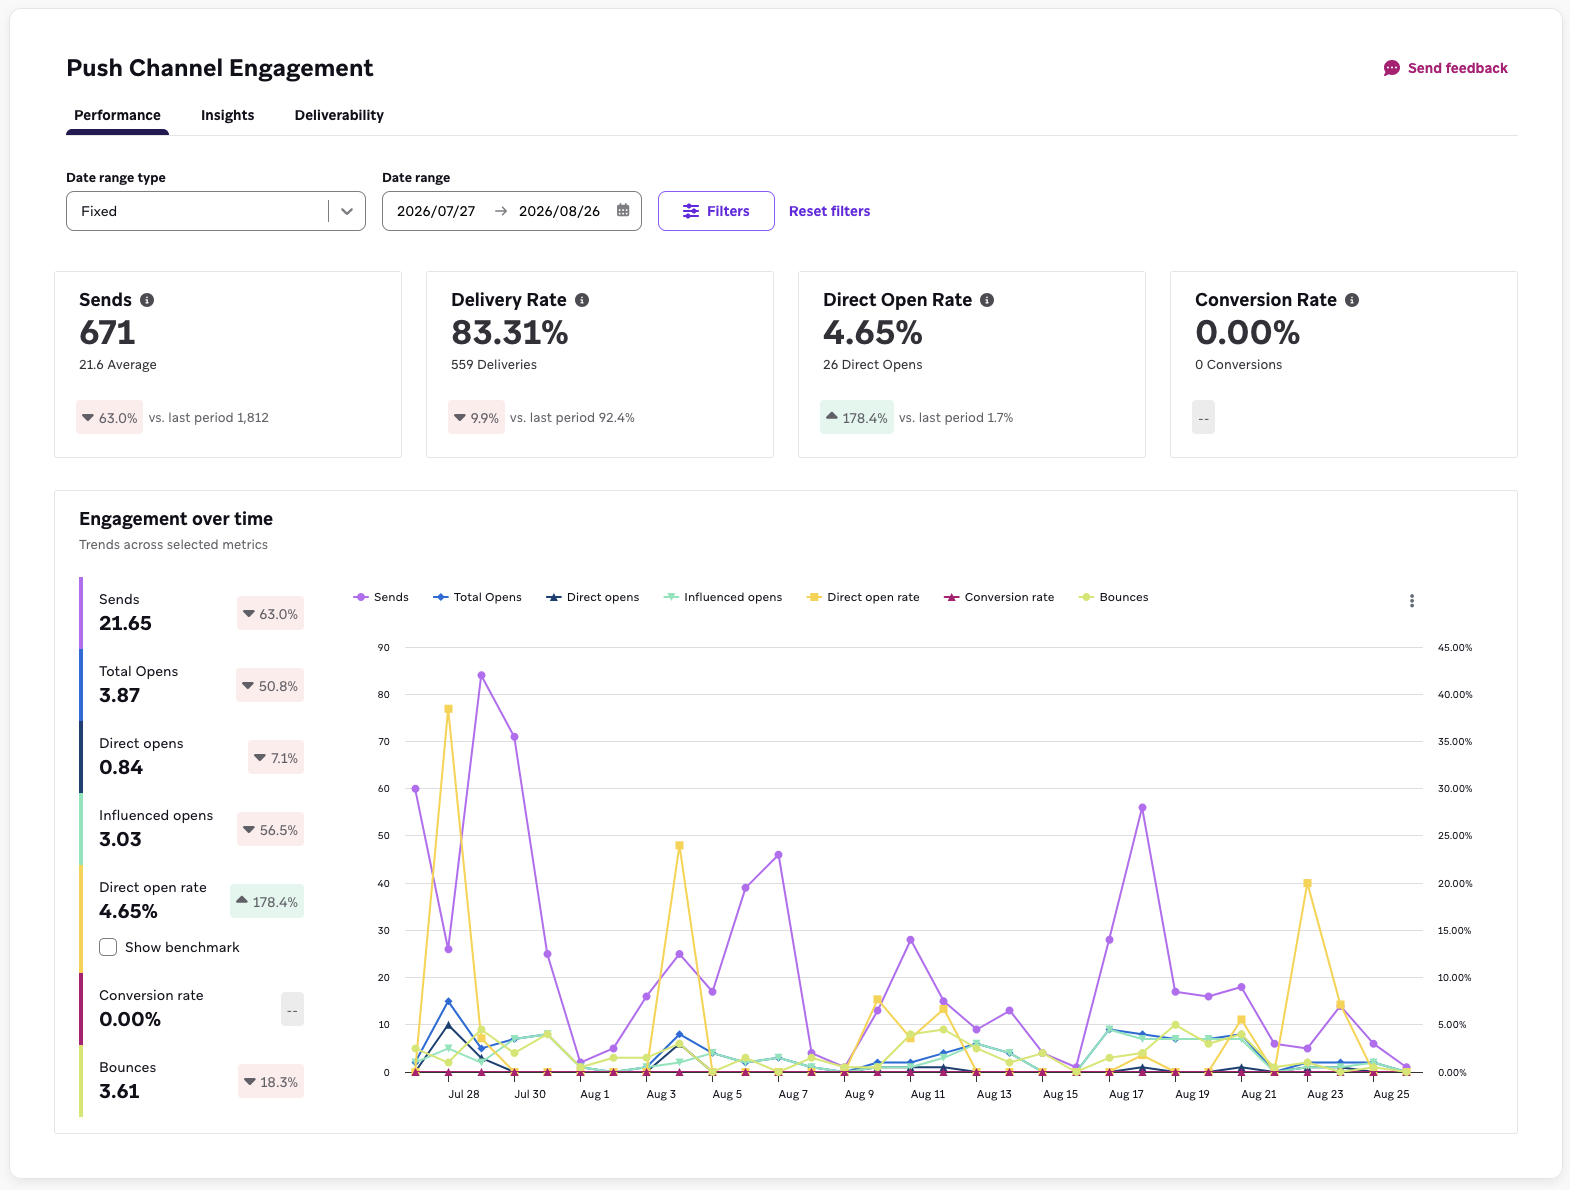
Overview
The overview banner summarizes four headline metrics for your selected date range: Sends, Delivery Rate, Open Rate, and Conversion Rate. Each tile shows a primary value, a supporting count, and a tooltip with additional statistical detail.
Conversion rate on this dashboard is scoped to your primary conversion event only. To analyze secondary conversion events, use Report Builder.
Engagement over time
In the engagement over time section, each metric is plotted as a line chart across your selected date range:
- Sends
- Total opens
- Direct opens
- Influenced opens
- Direct open rate
- Conversion rate
- Bounces
You can toggle an industry benchmark onto the direct open rate chart. Benchmarks are off by default. For more information, see Benchmarking.
How metrics are calculated
The calculations for different metrics in the push performance dashboard are the same as those on an individual message level (such as campaign analytics). On this dashboard, the metrics are aggregated across all campaigns and Canvases for the date range you’ve selected. For metric definitions, refer to Report Metrics Glossary and filter by Push. For more information about influenced opens, see Influenced opens.
Each tile shows the rate metric first, followed by the count metric (with the exception of Sends, which displays the count metric only). Each tile also shows the comparison to the last period.
| Metric | Type | Calculation |
|---|---|---|
| Sends | Count | Total number of sends across each day in the date range |
| Delivery rate | Rate | (Total number of deliveries across each day in the date range) / (Total number of sends across each day in the date range) |
| Bounce rate | Rate | (Total number of bounces across each day in the date range) / (Total number of sends across each day in the date range) |
| Direct open rate | Rate | (Total number of direct opens across each day in the date range) / (Total number of deliveries across each day in the date range) |
| Influenced open rate | Rate | (Total number of influenced opens across each day in the date range) / (Total number of deliveries across each day in the date range) |
| Total open rate | Rate | (Total number of total opens across each day in the date range) / (Total number of deliveries across each day in the date range) Total opens includes both direct opens and influenced opens. |
| Conversion rate | Rate | (Total number of primary conversions across each day in the date range) / (Total number of recipients across each day in the date range) |
Push insights dashboard
The push insights dashboard surfaces patterns in how your audience responds to push, so you can adjust what you send and how often. To access it, go to Analytics > Push Performance > Insights.
Frequency
The frequency report shows the relationship between how many push notifications a user receives and their open rate, so you can find the point where additional sends stop earning engagement. The chart highlights a recommended send volume based on benchmark data for your vertical.

The frequency and cadence reports use a minimum three-month analysis window. If you select a shorter date range, Braze may expand the start date to include up to three months of data when available. These reports aren’t affected by the tag, campaign, Canvas, or platform filters—they always reflect your full push volume for the selected date range.
Cadence
Where the frequency report tells you how many messages to send, the cadence report tells you how to space them out. It plots open rate against sending cadence, so you can see whether clustering your sends—for example, three pushes all landing on a weekend—costs you engagement compared to spreading them across the week.
Use it alongside the frequency report: frequency sets your volume target, cadence sets the distribution.
Campaign performance distribution
This report plots every push campaign in your date range by open rate and conversion rate, so you can see your strongest and weakest performers side by side and look for what they have in common.
On the campaign performance distribution chart, select the three dots icon and select View data table, which exposes a sortable table that lists the same campaigns. You can sort by open rate or conversion rate to rank performers, and use it to open an individual campaign’s analytics.
Push deliverability dashboard
The push deliverability dashboard tracks the health of your push audience over time, so you can see how your messaging affects your reachable base. To access it, go to Analytics > Push Performance > Deliverability.
This dashboard is filtered by date range only, and each metric is broken down by platform.
Bounce rate
Bounces across your selected date range, broken out by platform. You can toggle an industry benchmark onto this chart. It’s off by default.
Uninstall rate
Uninstalls across your selected date range, broken out by platform. Use this to see whether a heavy sending period coincided with users dropping off. Uninstall data depends on your uninstall tracking setup. See Uninstall tracking. Uninstall tracking is supported for iOS, Android (excluding Huawei), and Kindle. If uninstall tracking is turned off, uninstall rate data is less complete and may be less accurate. Depending on the operating system, uninstall reports may arrive later or in batches, so the chart might not reflect the exact uninstall date.
How metrics are calculated
| Metric | Type | Calculation |
|---|---|---|
| Uninstall rate | Rate | (Total number of devices where Braze has received a signal that they were uninstalled across each day in the date range) / (Total number of devices with valid tokens across each day in the date range) |
| Bounce rate | Rate | (Total number of bounces across each day in the date range) / (Total number of sends across each day in the date range) |
Benchmarking
On the push dashboards, you can compare your performance against aggregated, anonymized data from Braze.
Available benchmarks
| Benchmark | Where it appears | Default |
|---|---|---|
| Direct open rate | Push performance | Off |
| Bounce rate | Push deliverability | Off |
| Frequency | Push insights | On |
| Cadence | Push insights | On |
Direct open rate and bounce rate benchmarks are broken out by platform. All push benchmarks are measured against open rate, not conversion rate.
Comparing verticals
Benchmark data is split by vertical. Your dashboard defaults to your account’s vertical, and you can use the dropdown to compare against another.
Comparing regions
Benchmark data is split by region. Your dashboard defaults to your account’s region, and you can use the dropdown to compare against another.

If the latest benchmark data isn’t available for your selected time range, Braze shows a predicted benchmark.
Benchmark data refreshes monthly.
Frequently asked questions
Why are my frequency and cadence reports empty?
These reports use a three-month analysis window. If your selected range is shorter, Braze may expand the range to include earlier dates when data is available.
If your date range is long enough and the reports are still empty, benchmark data may not yet be available for your workspace. Contact Braze Support if you have any questions.
Why don’t my filters change the frequency and cadence reports?
The frequency and cadence reports always reflect your full push volume, because their value comes from measuring total message load on a user. Filtering to a subset of campaigns would understate how many messages that user actually received. Only the date range filter applies.