Connected Content Debugger
Use the Connected Content Debugger to view the live request and response for each Connected Content call, so you can verify your endpoint, headers, and Liquid tags before you launch a campaign or Canvas.
About the debugger
Connected Content lets you enrich messages with real-time data by making an HTTP call to an external API at render time, then inserting the response into your message with Liquid. Because that call happens outside Braze, it can be difficult to see exactly what request Braze sent, what the endpoint returned, or why a call failed, before a campaign or Canvas is live.
The Connected Content Debugger helps to troubleshoot those issues prior to launching. It shows you the live request and response for every Connected Content call in your message in the Preview & Test section. This way, you can confirm your endpoint, headers, and Liquid tags are configured correctly all within the Braze dashboard.
Supported areas
The Connected Content Debugger is available for the following areas:
- Banners
- Canvas Context steps
- Content Cards
- Email
- Includes templates
- Excludes footers and subscription pages
- In-app messages
- Push notifications
- SMS/MMS/RCS
- Webhooks
- Includes templates

The debugger is available for most channels, but not yet for KakaoTalk, LINE, or non-channel-specific composition surfaces (such as Content Blocks and Canvas User Update step). If you don’t see the debugger, Connected Content debugging may not yet be supported for that feature.
Use the debugger
Each time you run a preview, Braze automatically renders the Connected Content call results in the Preview tab. To use the debugger:
- Configure your message with the
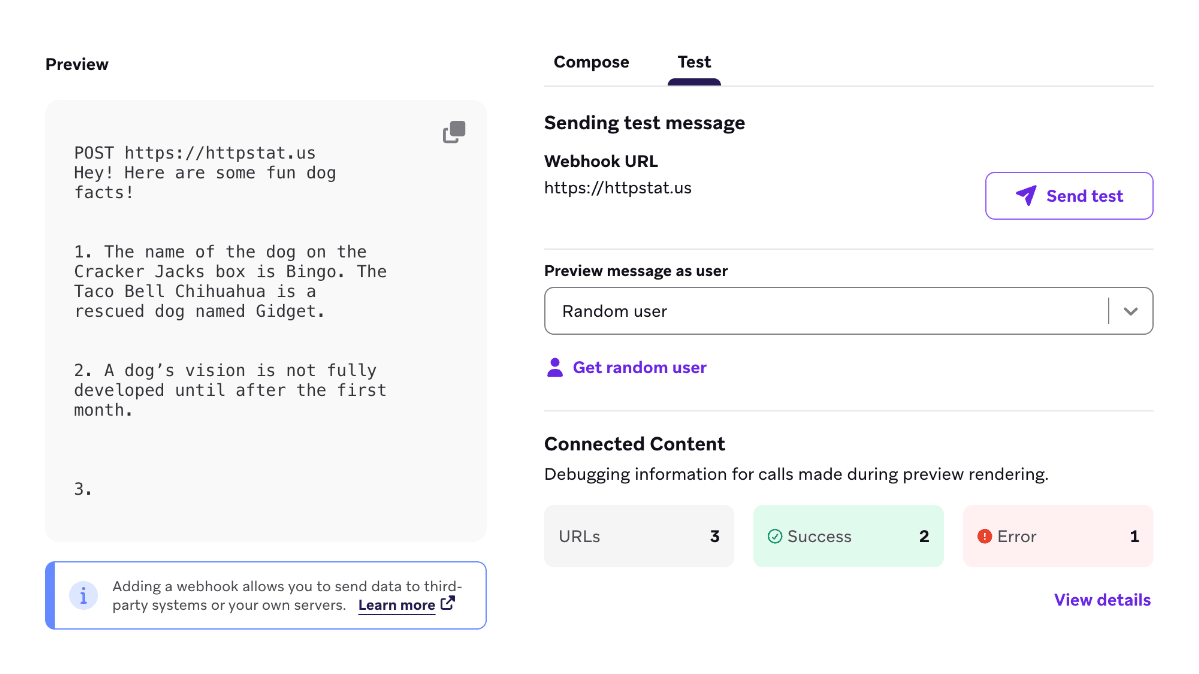
{% connected_content %}tag. - Go to the Preview & Test section. If your message includes a Connected Content tag, you can see a summary view with the number of Connected Content calls and the successful and error statuses.
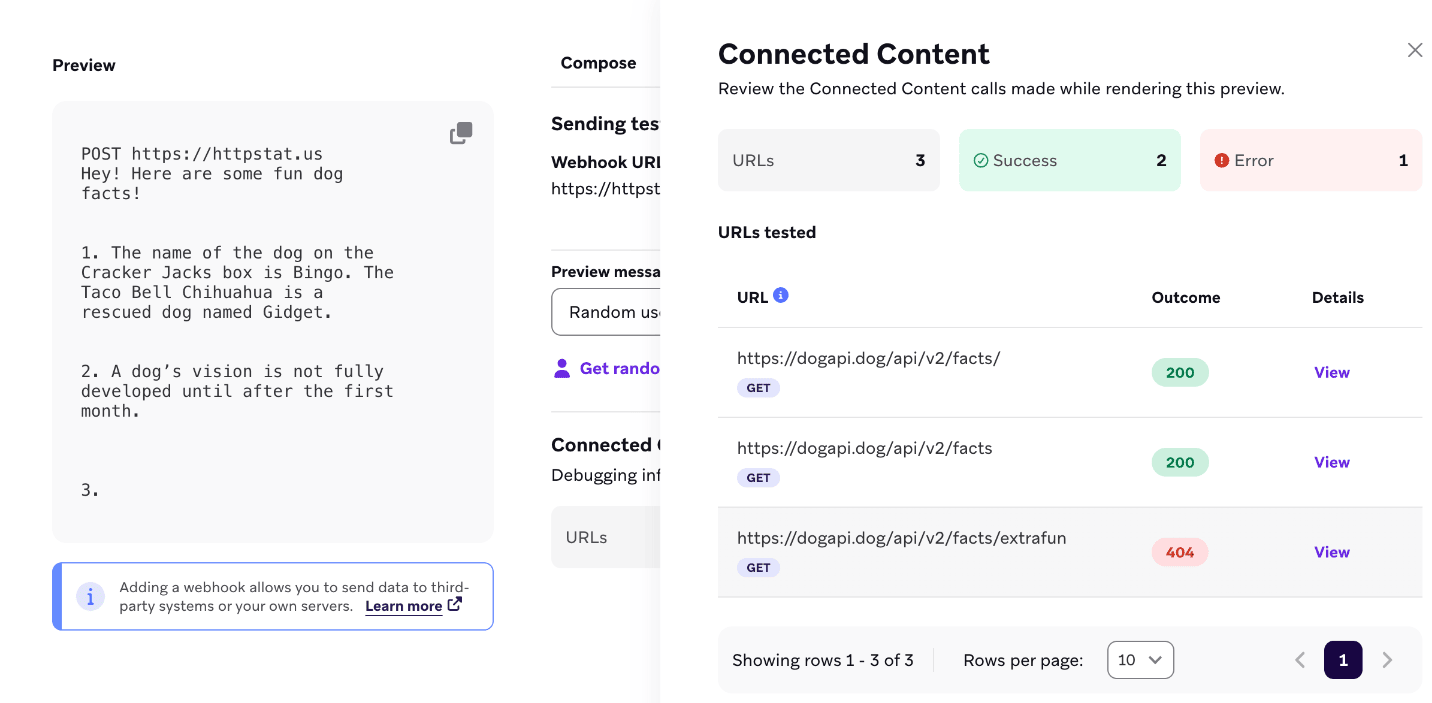
- Select View details to open the debugger alongside your preview. The drawer displays a table of the URL and outcome for each Connected Content call.
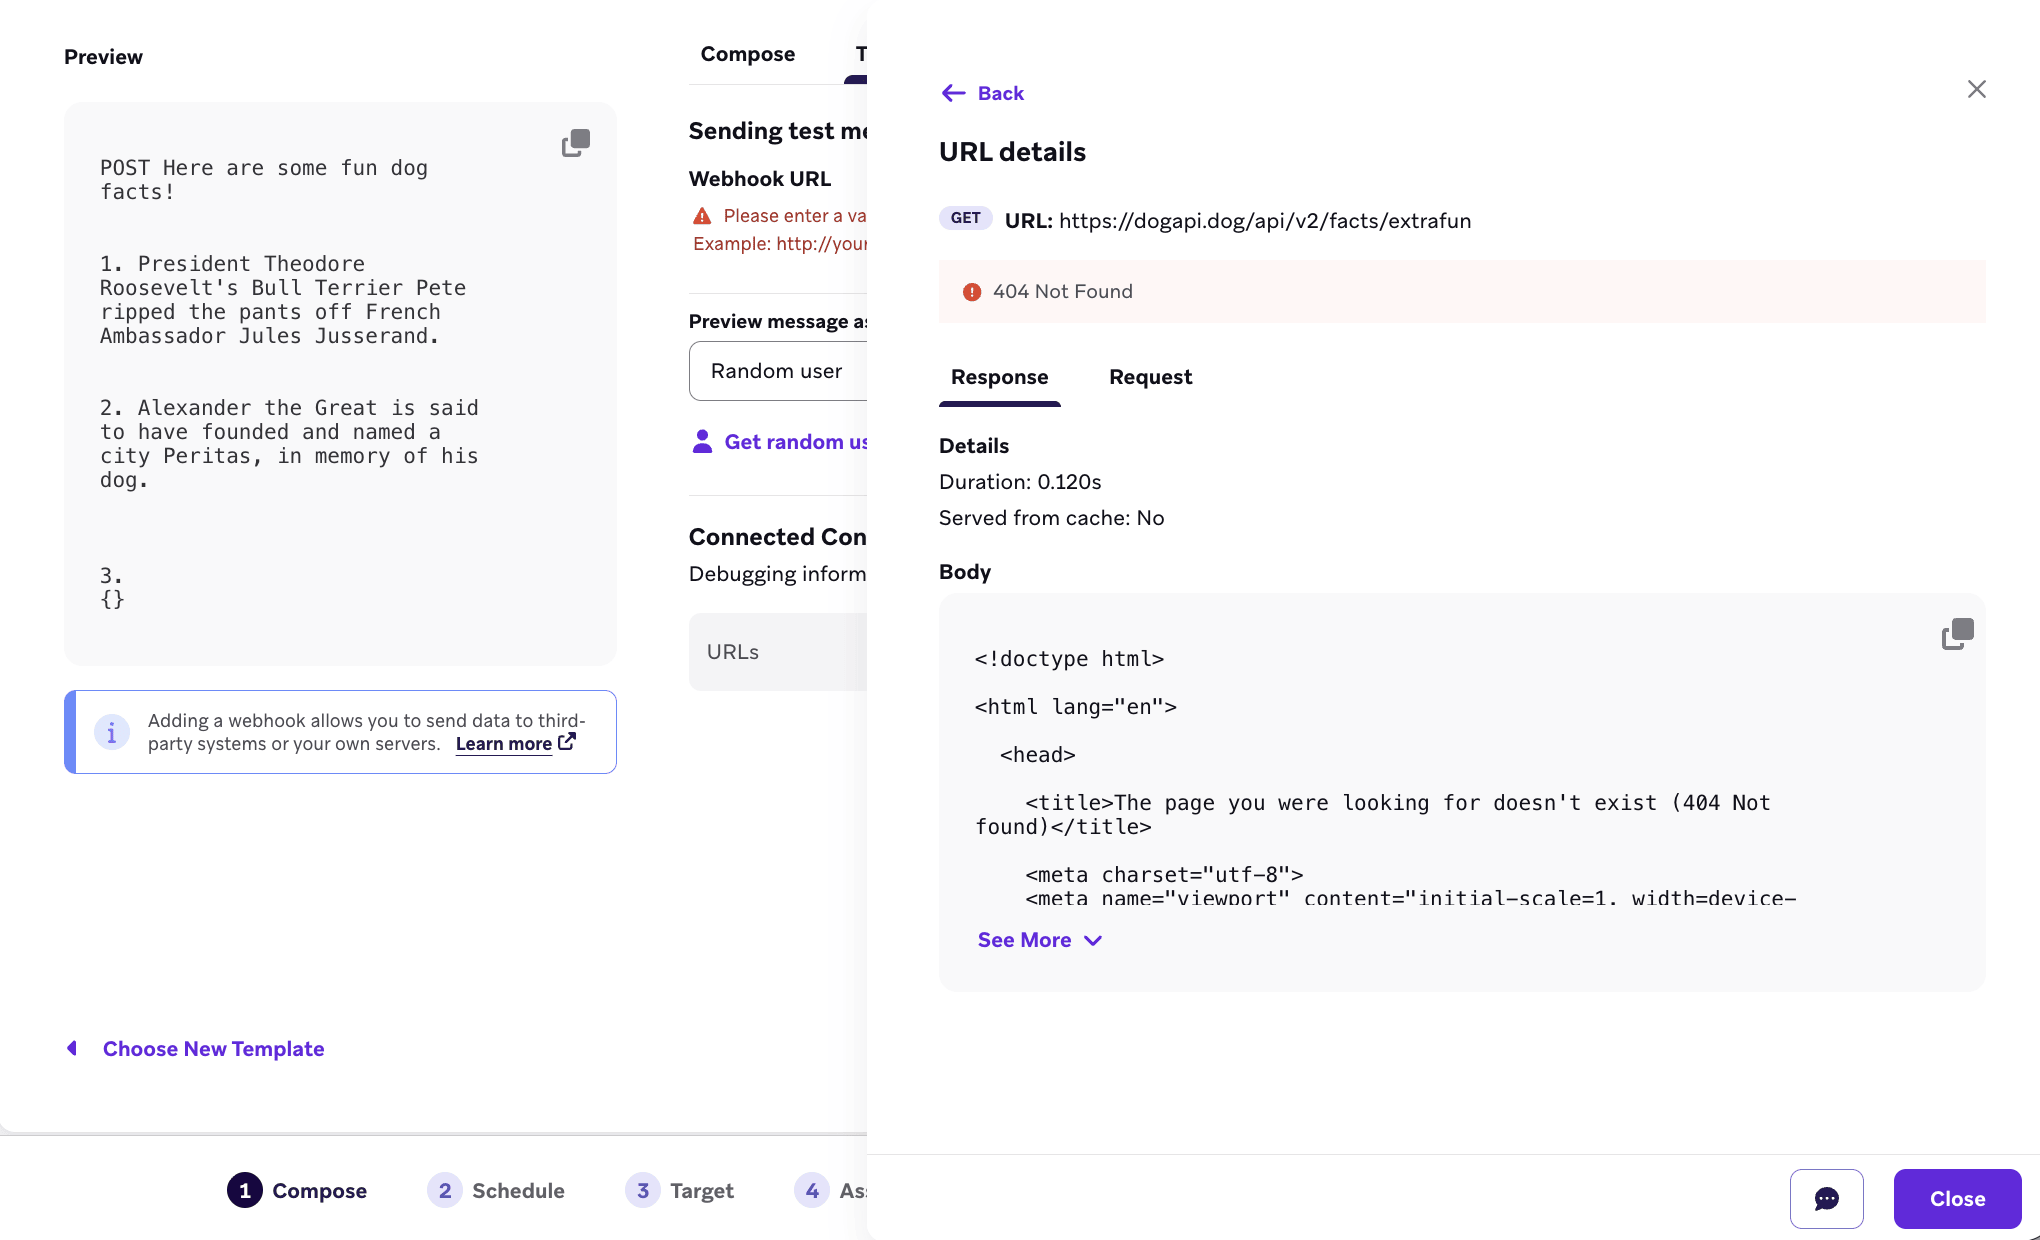
- Next to each URL and outcome, select View to view the request and response headers, payload, method, duration, and caching information.
- Review the results, adjust your tag, headers, or endpoint as needed. Then, generate a new preview to confirm the fix.
If your template contains more than one {% connected_content %} tag, the debugger lists every call that was made. For channels that render multiple message bodies or platform variants from one template, the debugger lists every Connected Content call across those renders—not only the body you’re previewing. Email can produce separate HTML and plain text rendering passes (and Accelerated Mobile Pages (AMP) on send), so the same URL can appear more than once. Quick Push can render for up to four platforms (iOS, Android, Web, and Kindle), so the same Connected Content reference can appear up to four times.
Those repeats match how Braze renders and sends the message; the debugger doesn’t collapse them. For more on why call volume can exceed sends, see Understanding Connected Content call volume.
Understand the debug output
Each Connected Content call appears with its own Response and Request tabs. The Response tab is shown by default as it’s generally the first indicator to confirm whether a call succeeded.
URL details
| Field | Description |
|---|---|
| URL | The fully rendered URL Braze called, with any Liquid tags resolved. |
| Method | The HTTP method used (GET or POST). |
| Status code | The HTTP status code your endpoint returned (for example, 200, 404, 500). See Troubleshooting response codes for Braze-specific codes. |
Response tab
| Field | Description |
|---|---|
| Duration | How long the request took to complete, in seconds. Duration is shown only for live (non-cached) calls. |
| Served from cache | Indicates whether this response was served from Braze’s Connected Content cache rather than a live call to your endpoint (Yes or No). A cached result reflects an earlier response, not necessarily your endpoint’s current state. |
| Response body | The body returned by your endpoint. |
Request tab
| Field | Description |
|---|---|
| Headers | Headers from your Connected Content tag (:headers, credentials, and options such as :content_type). |
| Body | The request body sent, if any (POST requests). |
Which request headers appear in the debugger
The Request tab lists headers from your Connected Content tag: custom :headers, stored credentials, and headers set by tag options such as :content_type and :basic_auth. Braze also adds standard headers on the outgoing request to your endpoint (for example, User-Agent and Host). Those Braze-added headers appear in the debugger when you set them in :headers.
To send a consistent User-Agent, set it in :headers. Braze uses your value, and the debugger shows that header.
Braze adds the following headers to outgoing Connected Content requests. Most are set only when you have not already provided them in the tag. Headers you supply with :headers, credentials, or tag options are sent as provided.
| Header | When Braze sets it |
|---|---|
User-Agent |
If you have not already set it, Braze sends Braze Sender <version>. The version string can change. If you filter traffic by User-Agent, allow all values that start with Braze Sender. To send a consistent value, set User-Agent in :headers. |
X-Braze-Sender-Version |
Always set to the Connected Content sender version. |
Accept-Encoding |
If you have not already set it, Braze sends gzip. |
Authorization |
If the URL includes a username and password (user:pass@host), Braze adds a Basic Authorization header derived from those credentials. An explicit Authorization header overrides it. Prefer :basic_auth or :headers instead of putting credentials in the URL. |
Host |
Hostname from the request URL (for example, www.example.com for https://www.example.com/abc/123), unless you set a Host header. |
Content-Length |
Size of the request body in bytes when a body is present. |
BrazeToBraze |
Set to true only for requests to Braze REST endpoints. Omitted for other destinations. |
Credential redaction
If your Connected Content tag uses :basic_auth, common secret headers, keys, or other auth credential options, the debugger redacts those values in the Request tab and replaces them with a series of asterisks (*). This lets you confirm that credentials were included in the request without exposing the values in Preview & Test.
Authentication failures are still visible even when credentials are redacted: if your endpoint returns a 401 or 403, that status code surfaces normally in the Response tab, so you can tell your request was rejected due to authentication even though the credential itself is hidden.
Troubleshooting response codes
Endpoint errors versus Braze-imposed limits
Not every non-2XX status code in the Response tab comes from your endpoint. Braze enforces its own limits on Connected Content calls, and these can produce responses that look similar to an endpoint error.
If you see response codes such as 408, 429, 502, 503, 504, or 599, the issue is typically on Braze’s side of the call — related to host health, timeout, or payload size. If your endpoint consistently returns large responses, consider trimming the response payload to only the fields your message needs.
Endpoint returned an unexpected status code
Use the Request tab to confirm the URL, headers from your tag, and body. A common cause of unexpected 4XX responses is a Liquid tag inside the URL, headers, or body that didn’t resolve the way you expected. Check that any {{ }} references point to fields that exist for the user or context you’re previewing with.
Response looks stale
Check Served from cache on the Response tab. If it shows Yes, the debugger is showing a previously cached response rather than a fresh call. Add :no_cache to your tag temporarily, or wait for the cache to expire (per :cache_max_age), to confirm current endpoint behavior.