Email performance dashboards
The Email Performance and Email Insights dashboards show aggregate email metrics across campaigns and Canvases.
For filters, time-period comparison, and other settings that apply across channels, see Channel performance dashboards.
Prerequisites
To view these dashboards, you need the “View Usage Data” or “View Dashboard Reports” permission for your workspace.
Email performance dashboard
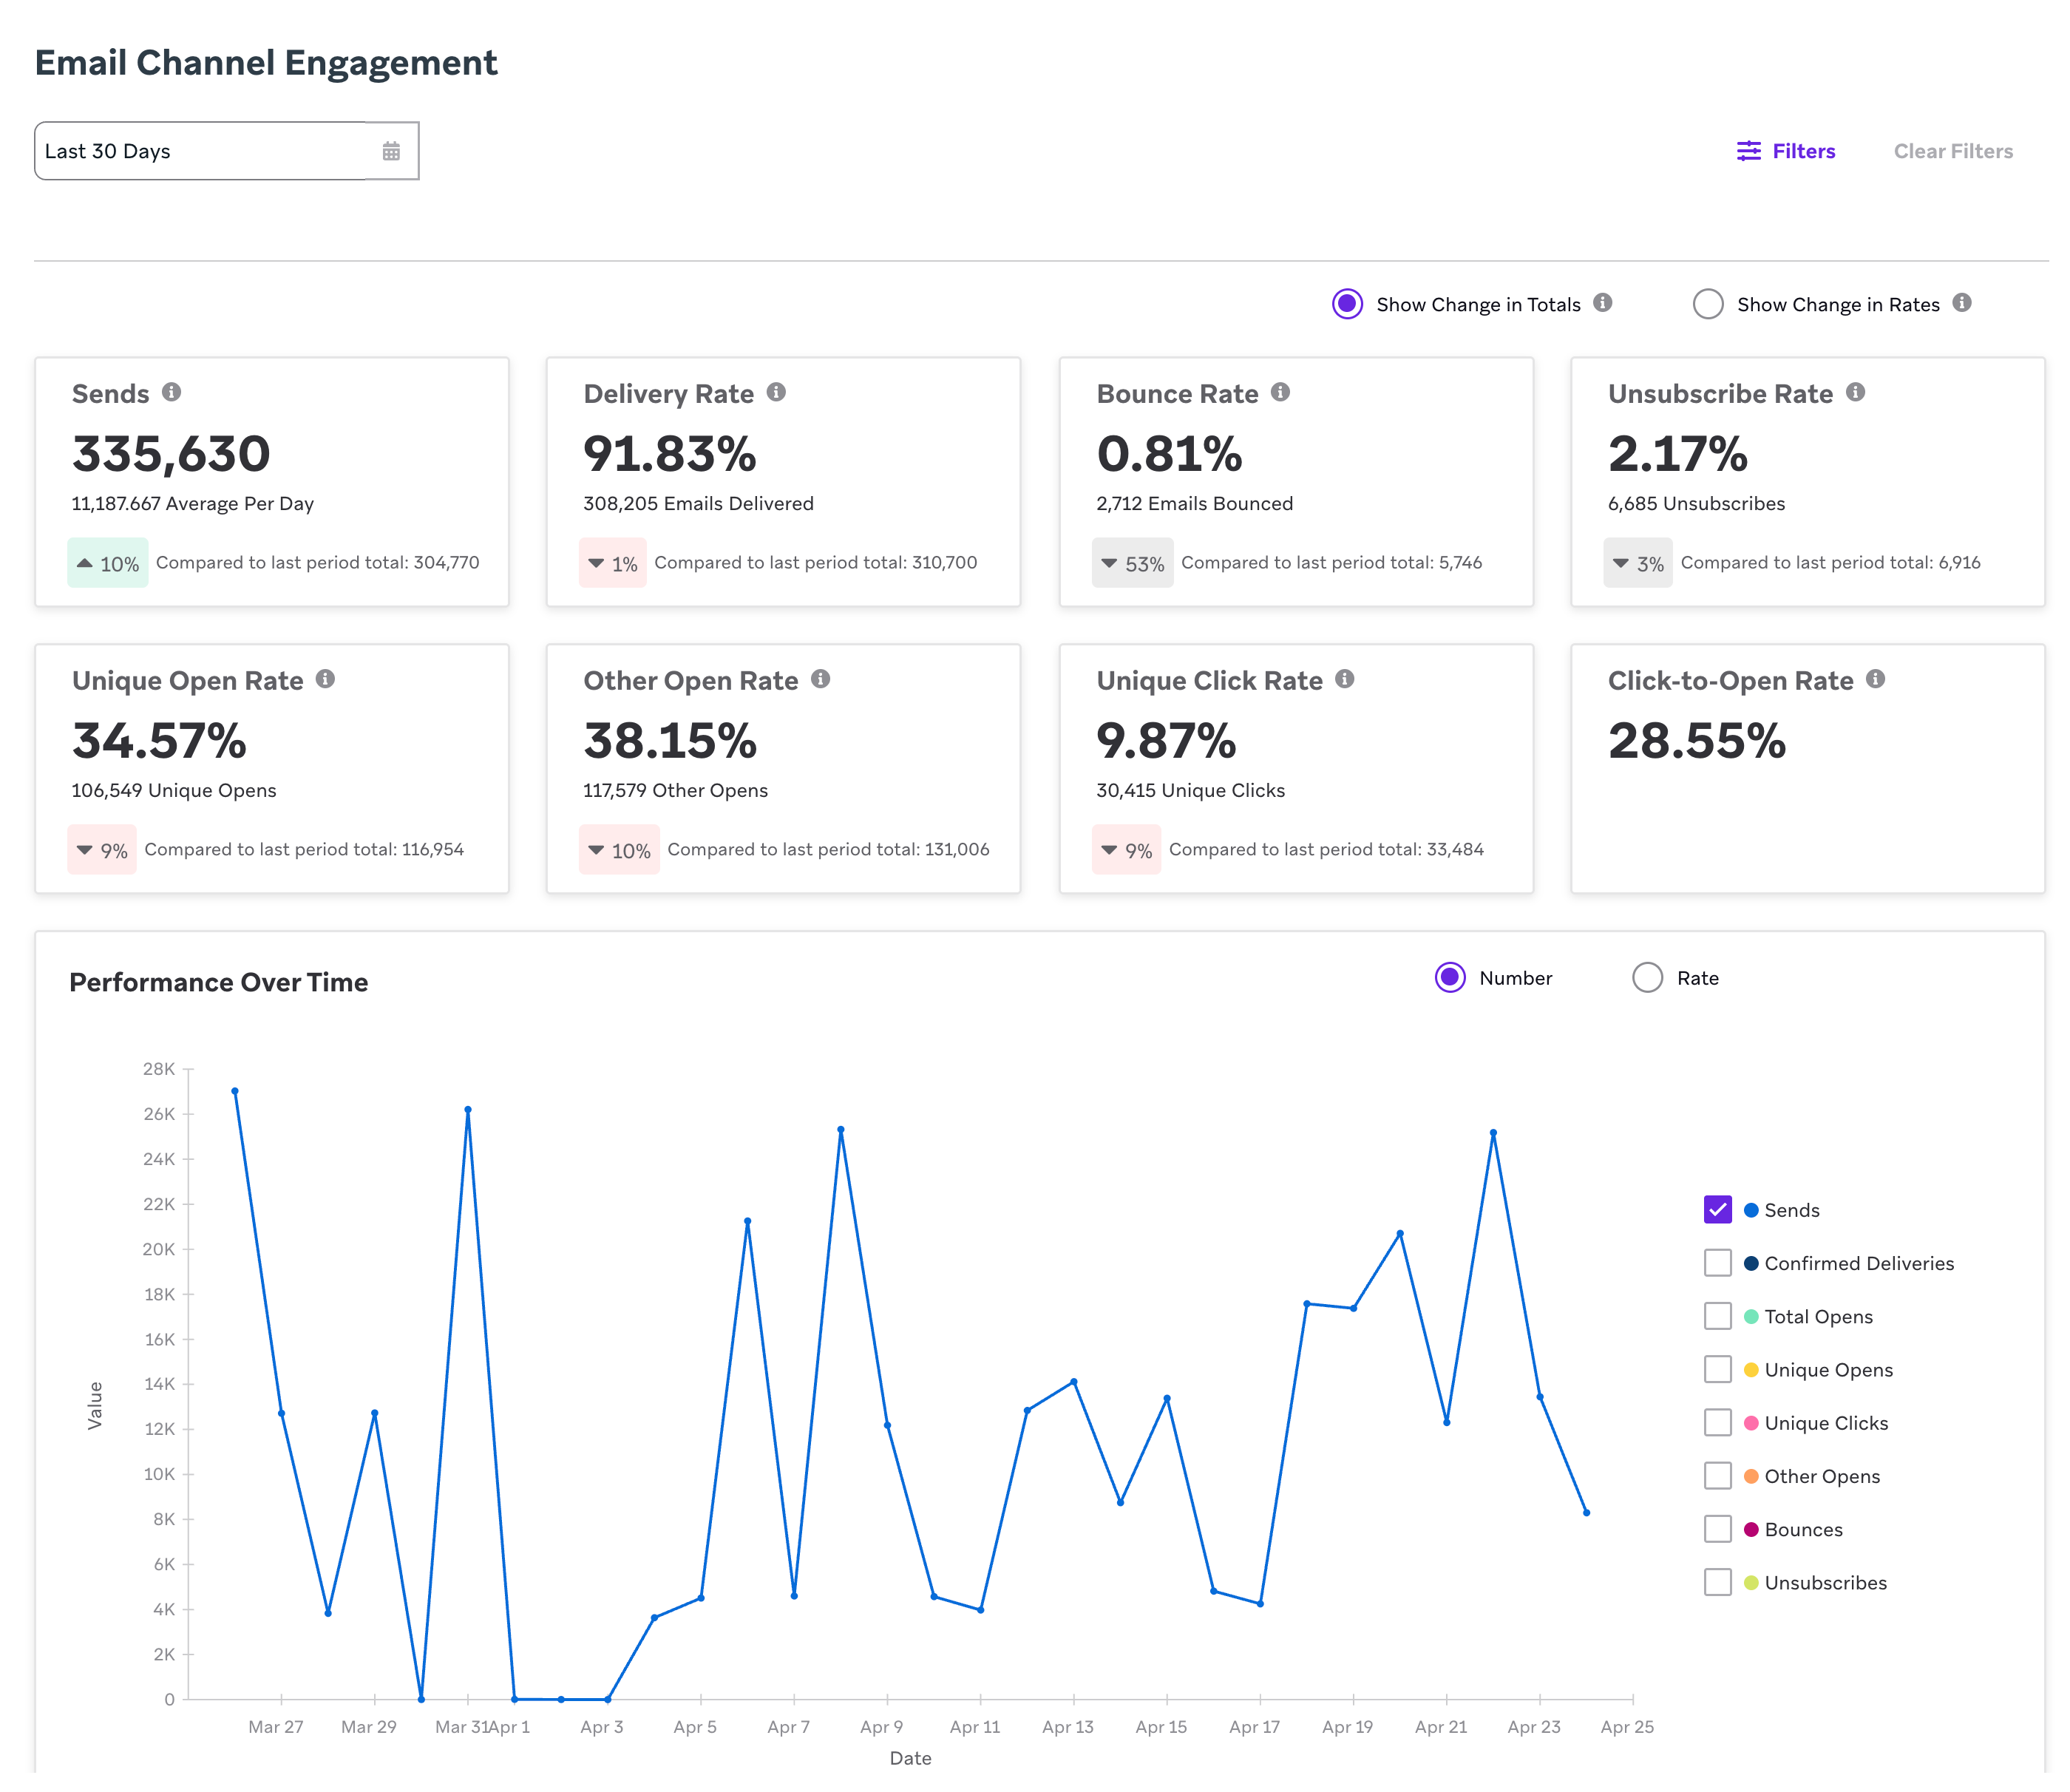
View your email performance dashboard by going to Analytics > Email Performance, and selecting the date range for the period you want to view data. Your date range can be up to one year in the past.
How metrics are calculated
The calculations for different metrics in the email performance dashboard are the same as those on an individual message level (such as campaign analytics). On this dashboard, the metrics are aggregated across all campaigns and Canvases for the date range you’ve selected. To learn more about these definitions, refer to Email metrics.
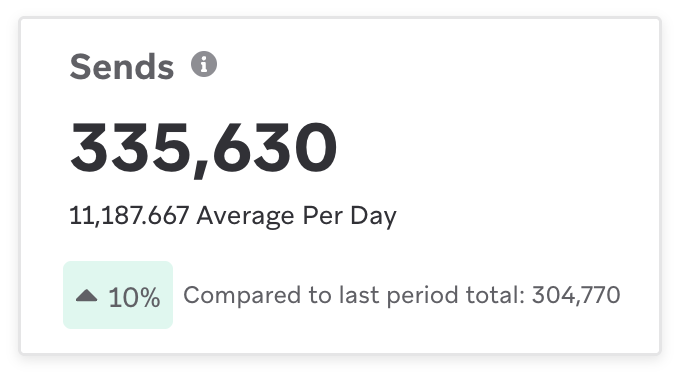
Each tile shows the rate metric first, followed by the count metric (with the exception of Sends, which displays the count metric followed by the average per day). For example, the unique clicks tile contains the Unique click rate from your selected time period and the count of the total number of unique clicks from that time period. Each tile also shows the comparison to the last period.
| Metric | Type | Calculation |
|---|---|---|
| Sends | Count | Total number of sends across each day in the date range |
| Delivery rate | Rate | (Total number of deliveries across each day in the date range) / (Total number of sends across each day in the date range) |
| Bounce rate | Rate | (Total number of bounces across each day in the date range) / (Total number of sends across each day in the date range) |
| Unsubscribe rate | Rate | (Total number of unique unsubscribes across each day in the date range) / (Total number of deliveries for a date range) This uses unique unsubscribes, which is also used in Campaign Analytics, Overview, and Report Builder. These unsubscribes are logged across all sources (such as the REST API, CSV imports, emails, and list unsubscribes). The unsubscribe rates in Campaign and Canvas analytics are unsubscribes that occur as a result of an unsubscribe click on a Braze-delivered email. |
| Unique open rate | Rate | (Total number of unique opens across each day in the date range) / (Total number of deliveries for a date range) |
| Other opens rate | Rate | (Total number of total other opens across each day in the date range) / (Total number of deliveries for date range) Other opens includes emails that haven’t been identified as machine opens, such as when a user opens an email. This metric is non-unique and is a sub-metric of total opens. |
| Unique click rate | Rate | (Total number of unique clicks across each day in the date range) / (Total number of deliveries for a date range) |
| Unique click to open rate | Rate | (Total number of unique clicks across each day in the date range) / (Total number of unique opens across each day in the date range) |
Email insights dashboard
The email insights dashboard tracks where and when your customers are interacting with your emails. These reports can provide rich and granular data on how to optimize your emails to drive greater engagement. The email insights dashboard includes up to the last six months of data. To access the dashboard, go to Analytics > Email Performance > Email Insights.
Engagement by Device
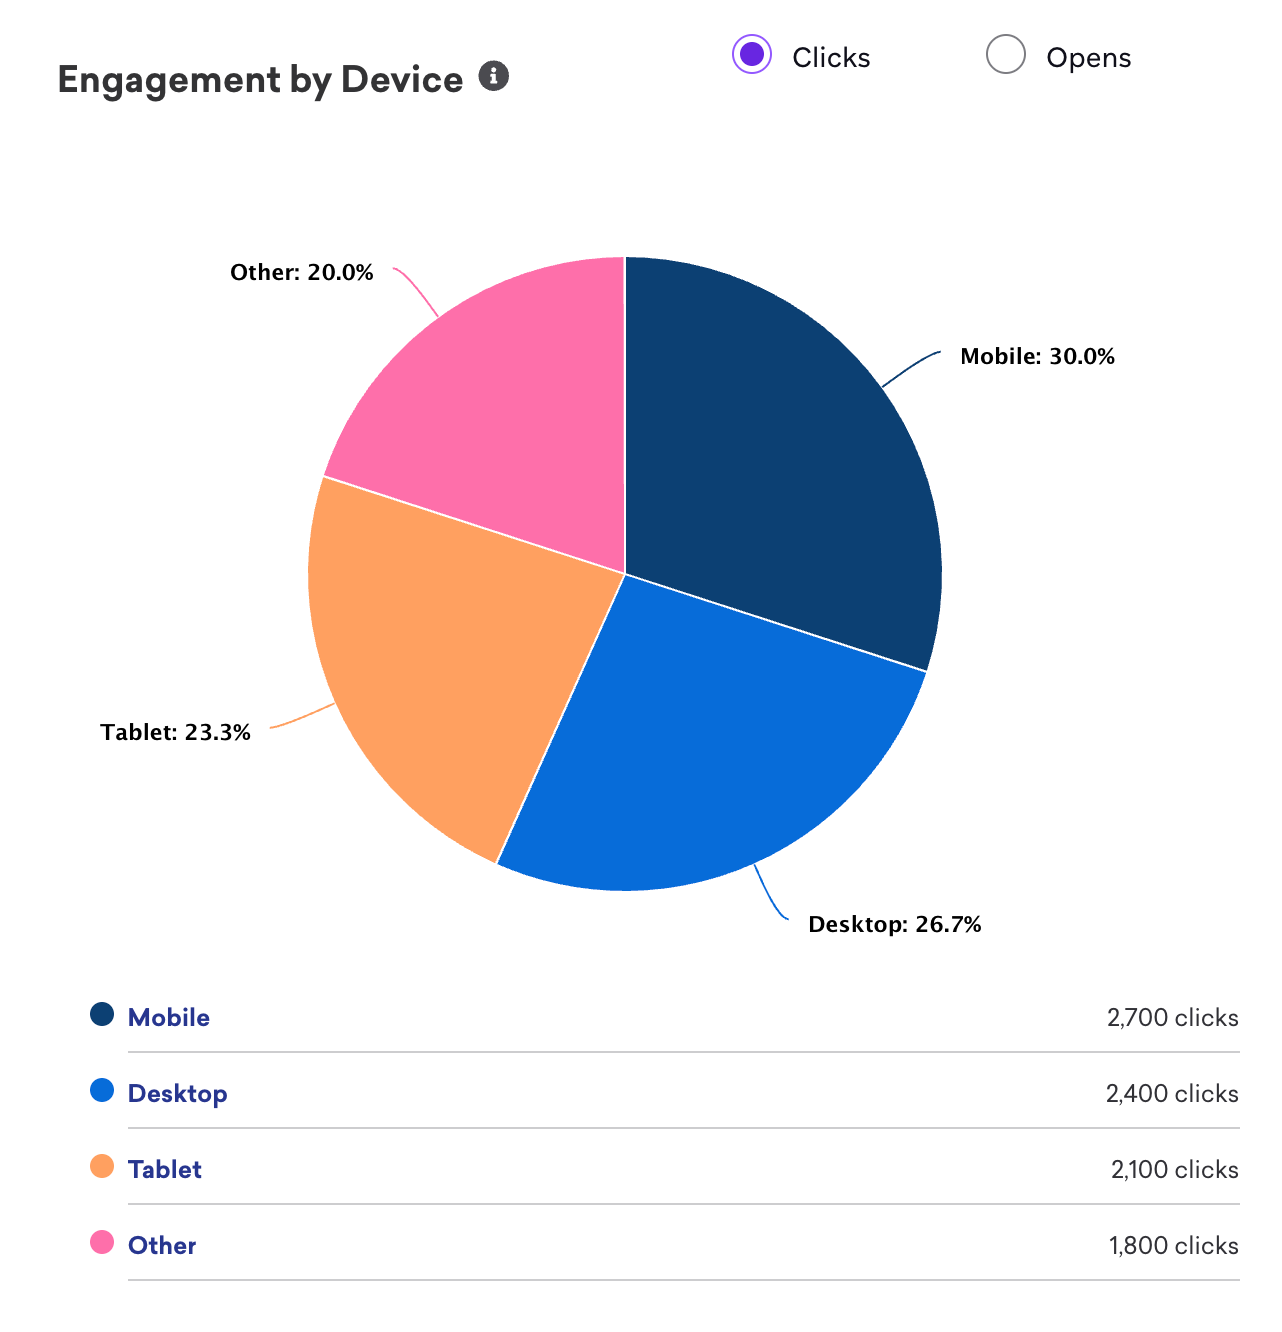
The Engagement by Device report provides a breakdown of what devices your users are using to engage with your email. This data tracks email engagement across mobile, desktop, tablet, and other device types. This data is based on the user agent string passed from your users’ devices.

If you use CloudFront as your CDN, make sure your users’ user agent is passed along to the ESP. Otherwise, every user agent will be “Amazon Cloudfront”.
The “Other” category includes any user string that cannot be identified as desktop, mobile, or tablet. For example, television, car, video game console, OTT (over-the-top or streaming), and similar. This may also include null or empty values.
To better understand what is in this “Other” category, you can extract the user agents using either of these options:
- Currents sends you the exact user agent string retrieved from your users’ devices.
- Use the Query Builder to use SQL or generate SQL with Operator to view the user agents.
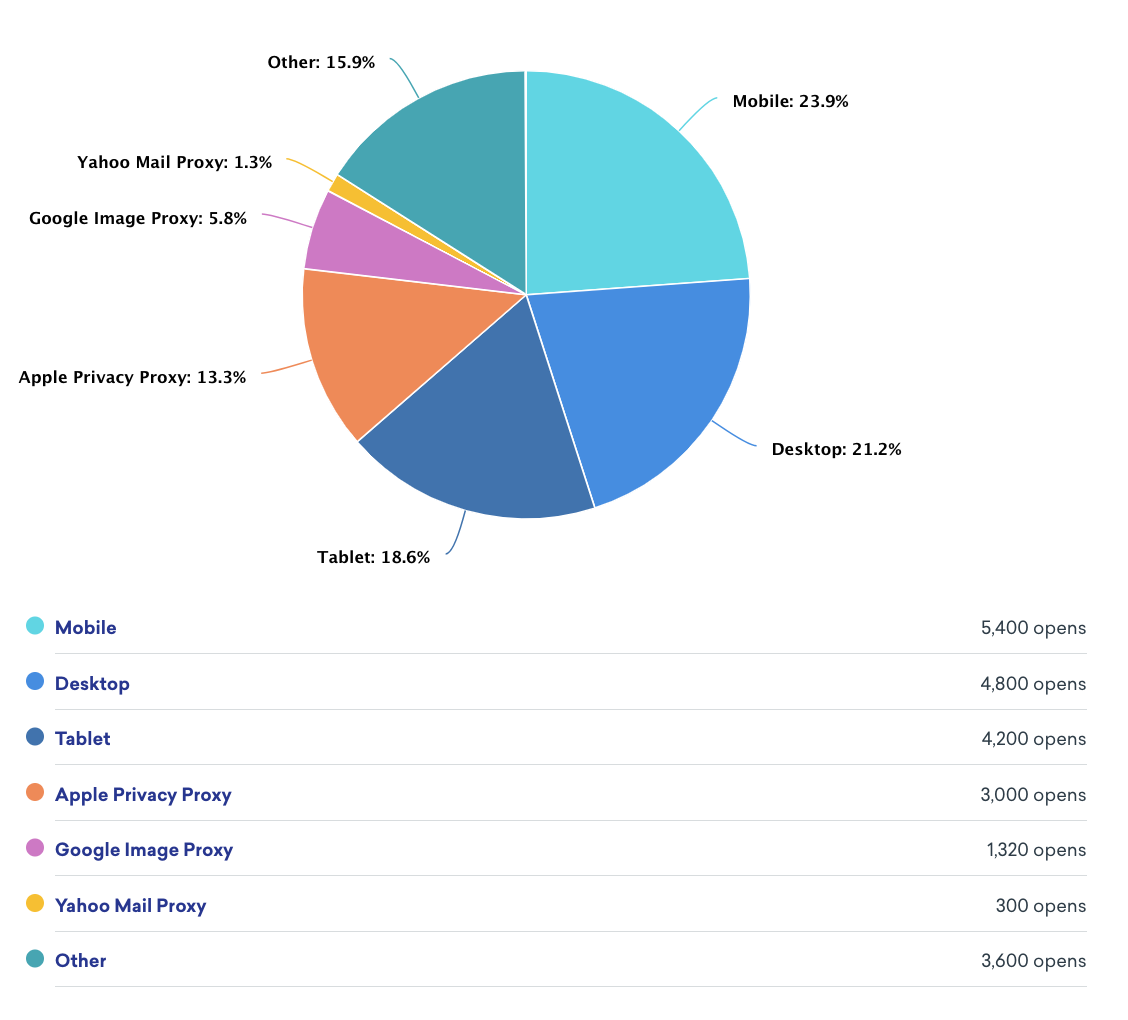
For email opens, Braze separates Google Image Proxy, Apple Image Proxy, and Yahoo Mail Proxy. These services cache and load all embedded images in an email before it’s delivered to the recipient. As a result, this triggers an email open from the mailbox provider’s servers rather than the recipient’s server, which can lead to inflated email opens. These services enhance privacy, security, performance, and efficiency when loading images. This can also contain real opens from recipients, as these proxy services mask the user agent, and Braze categorizes proxy data using the user agent.
Engagement by Mailbox Provider
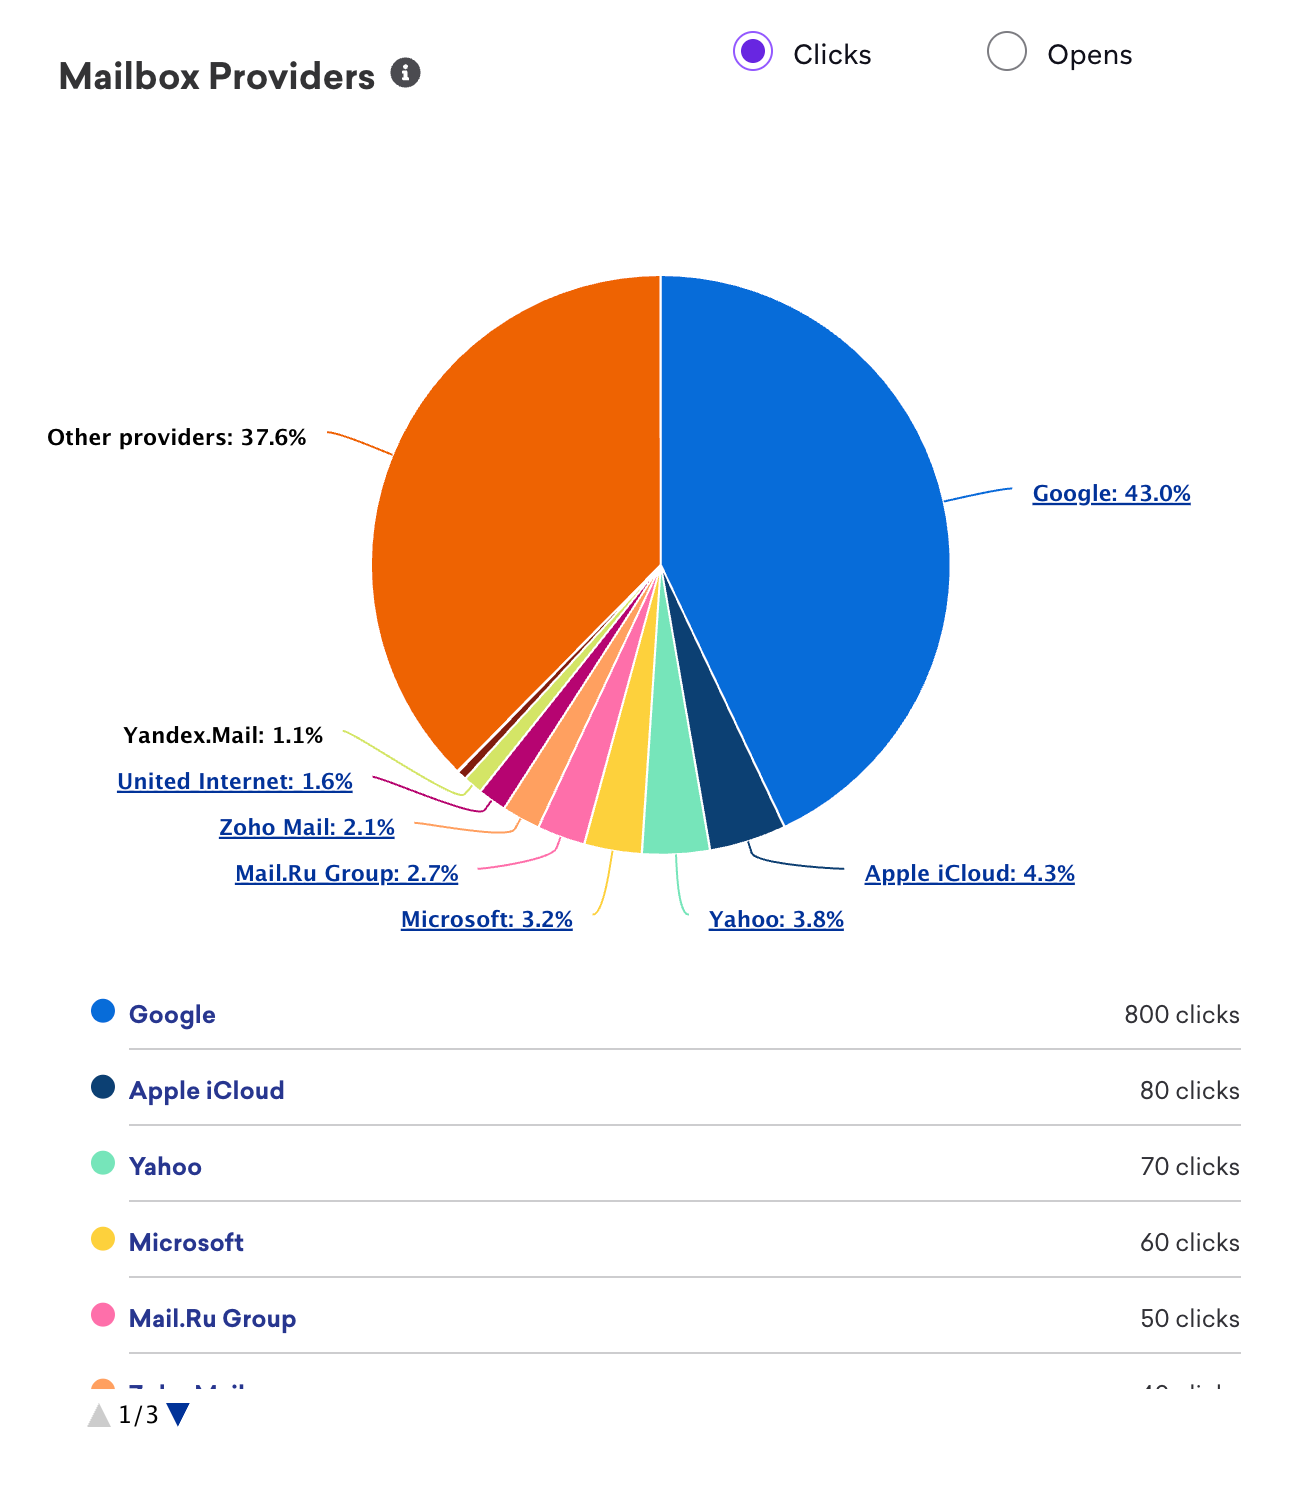
The Engagement by Mailbox Provider report displays the top mailbox providers contributing to your clicks or opens. You can select specific premier mailbox providers to view specific receiving domains. For example, if Microsoft is listed on this report as one of your top mailbox provider metrics, you can further view details for their receiving domains, such as “outlook.com”, “hotmail.com”, “live.com”, and more.
Time of Engagement
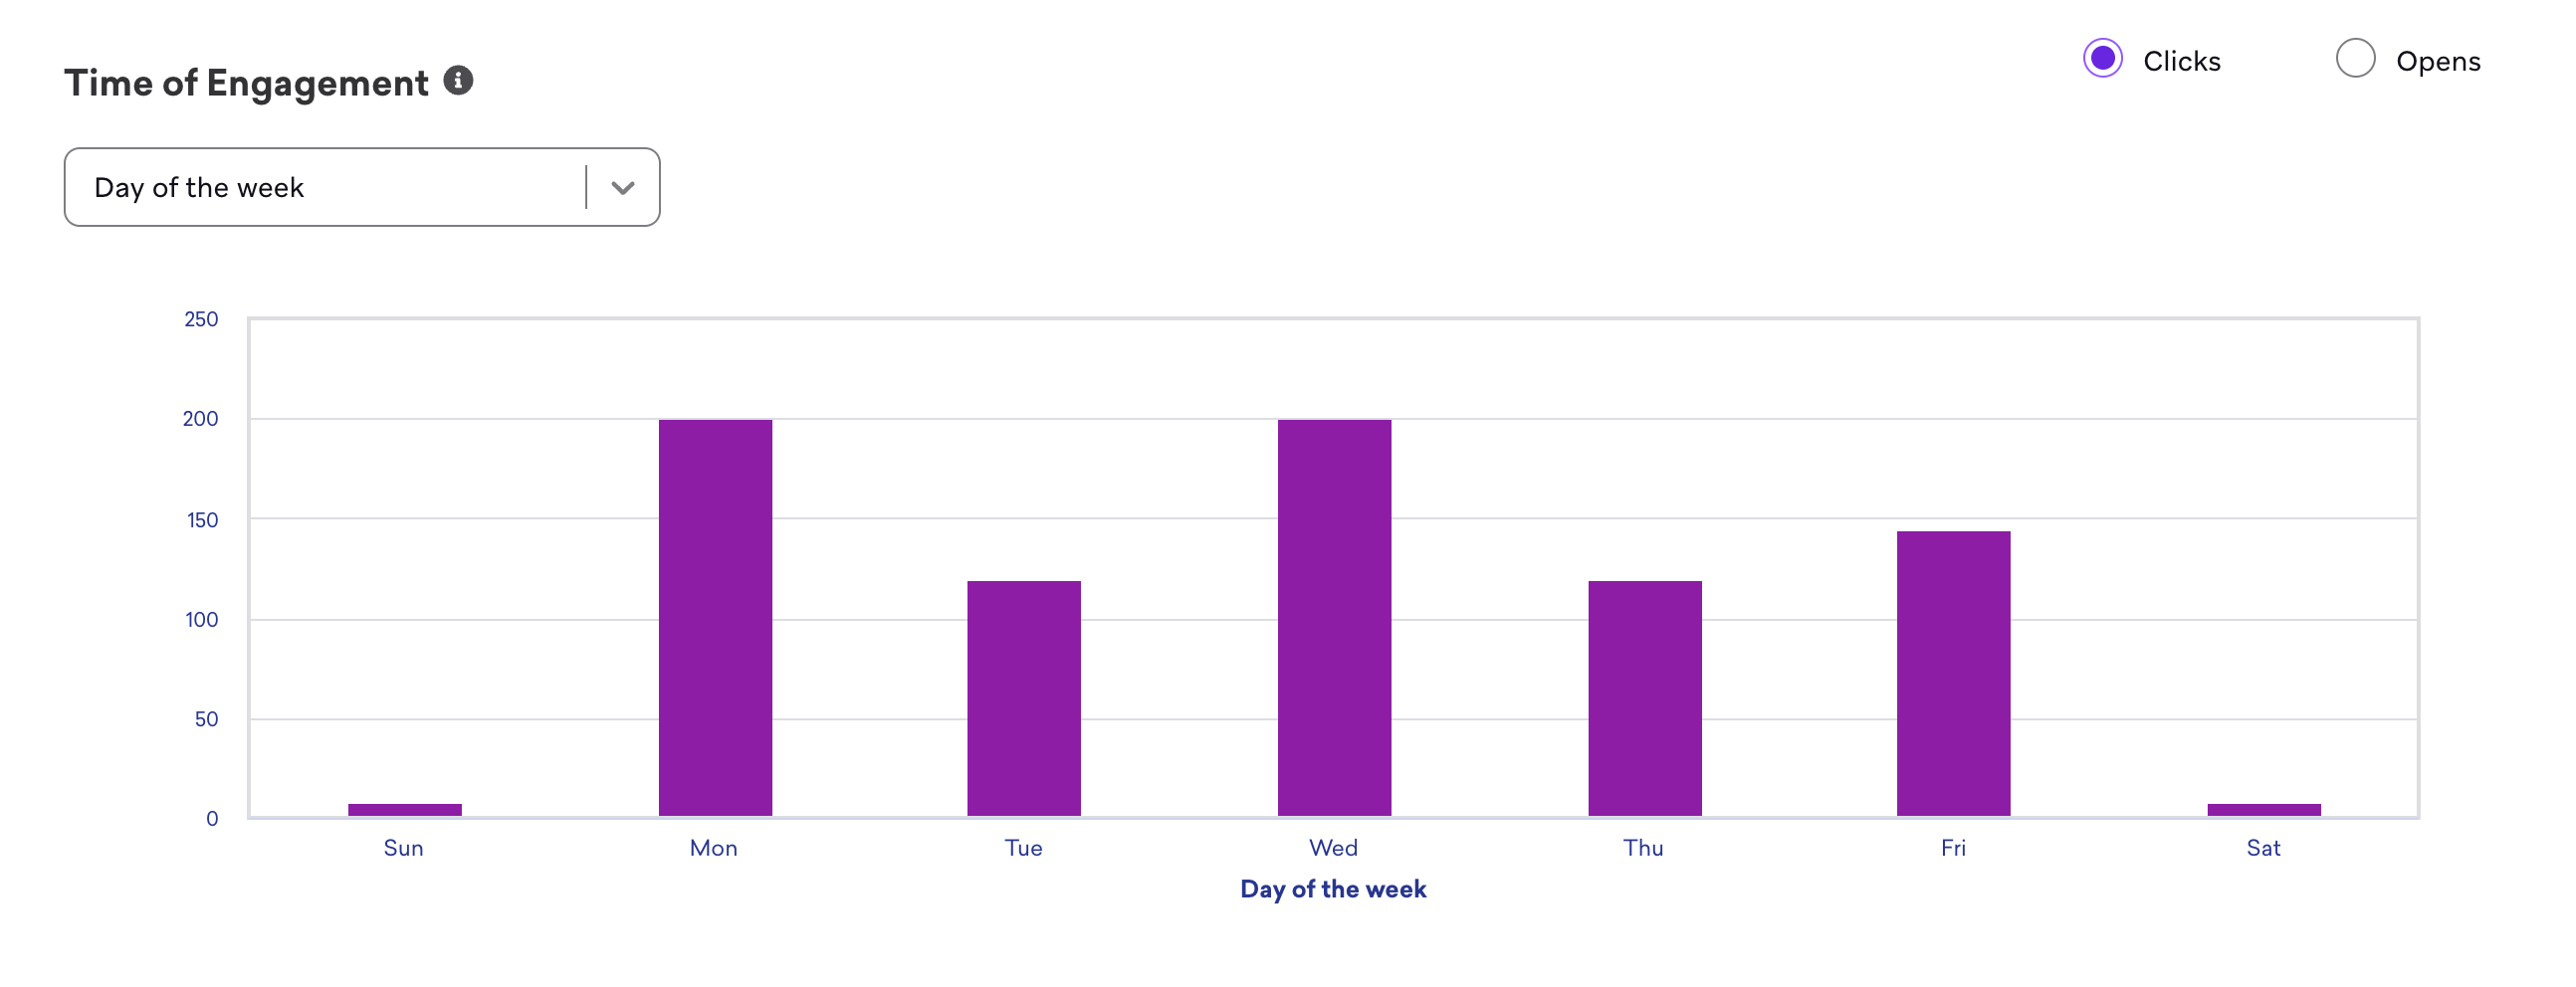
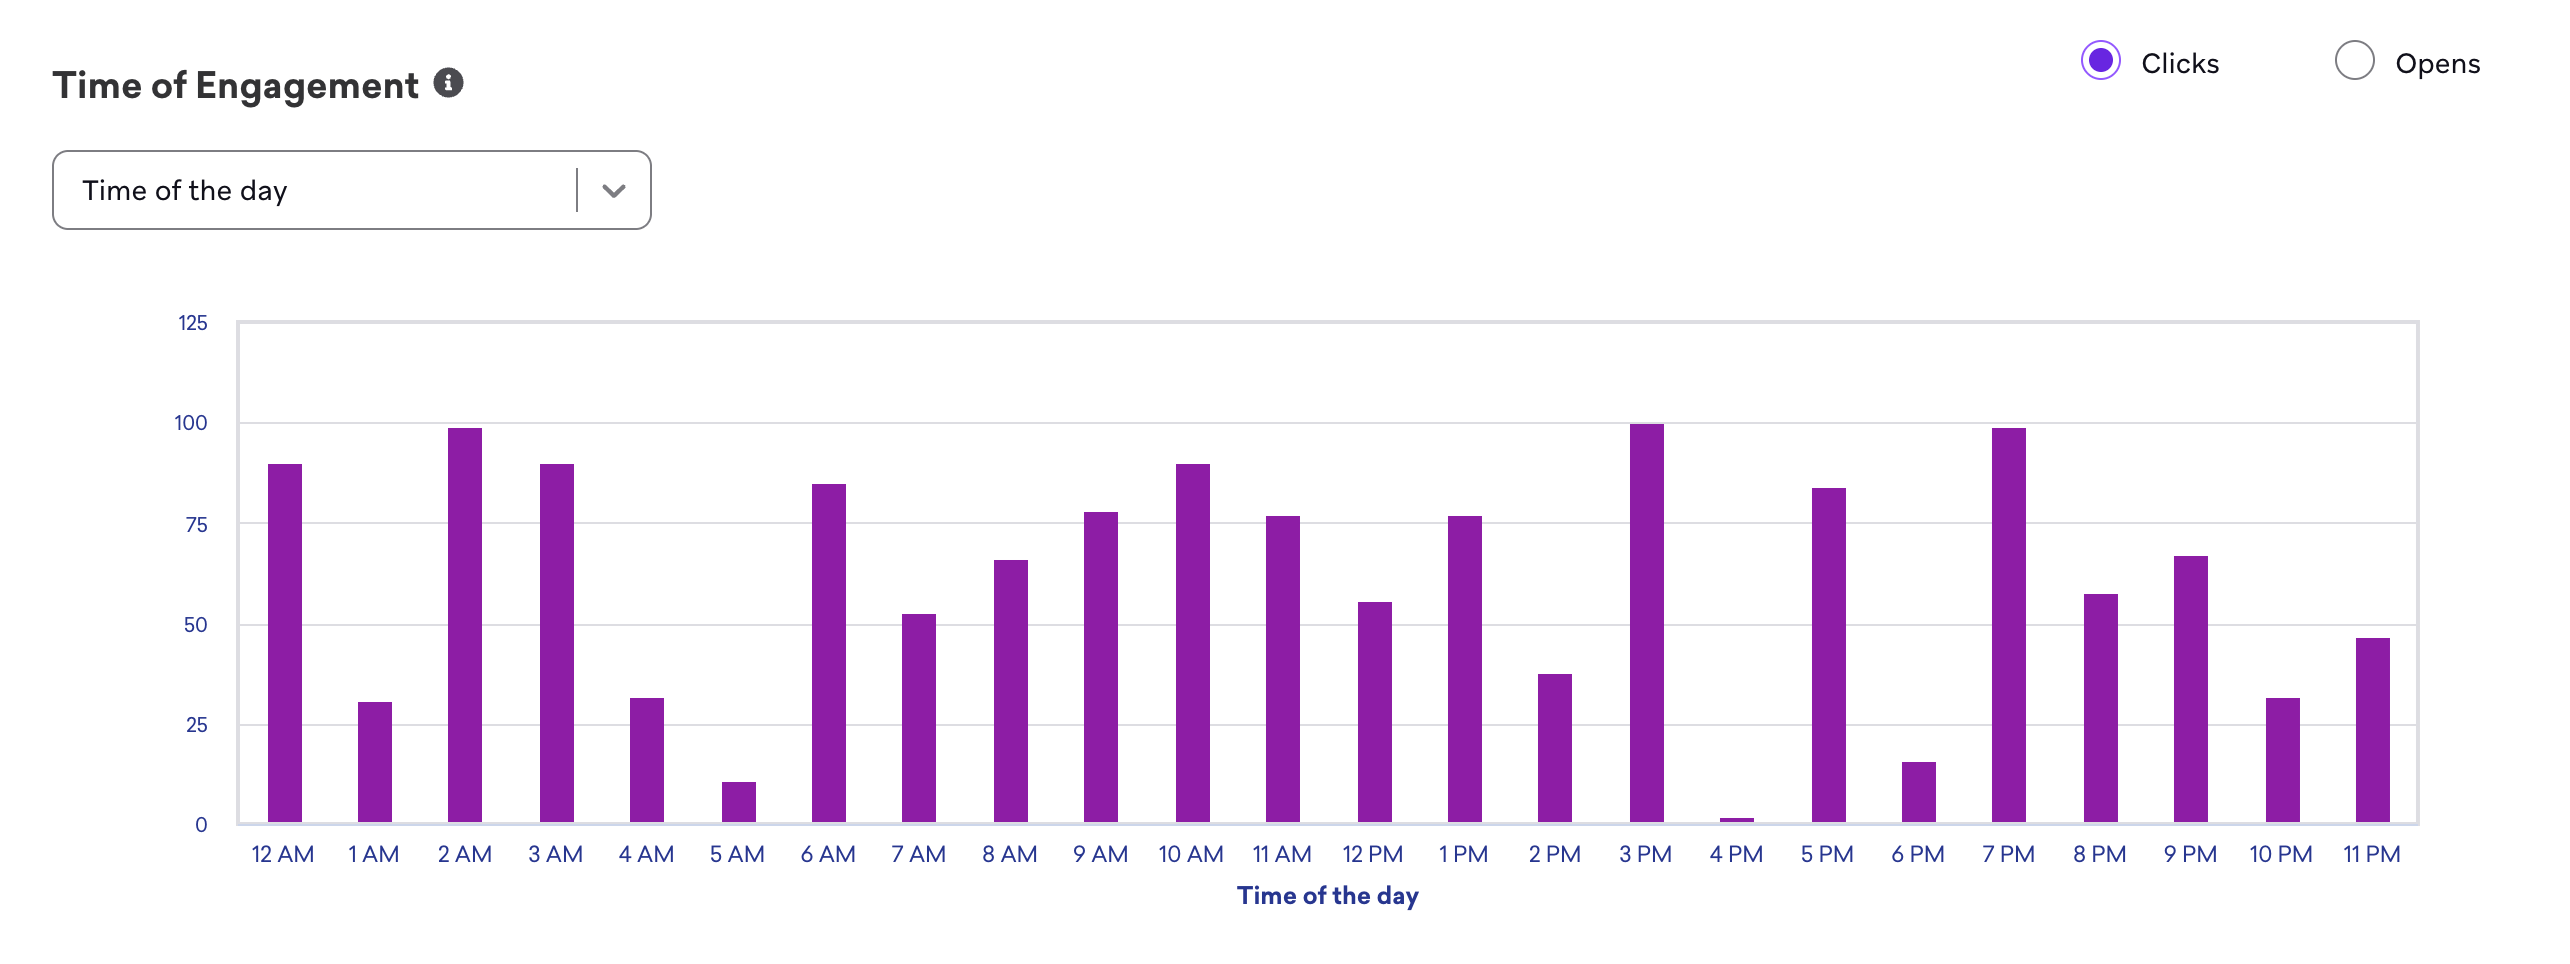
The Time of Engagement report displays data on when users are engaging with your emails. This can help answer questions such as which weekday or what time sees the highest engagement from your customers. With these insights, you can experiment with the best day or time to send your messages to drive higher engagement. Note that these times are based on your company’s time zone.
The Day of the week engagement report breaks down opens or clicks by day of the week.
The Time of the day engagement report breaks down opens or clicks by each hour in a 24-hour time window.
For more information on analytics for your emails, check out Email reporting.
Frequently asked questions
Why does my email dashboard display more Other Opens than Unique Opens?
For the Unique Opens metric, Braze deduplicates any repeat opens registered by a given user (whether they include Machine Opens or Other Opens) so that only a single Unique Open is incremented if a user opens multiple times. For Other Opens, Braze does not deduplicate.