SMS, MMS, and RCS performance dashboard
The SMS/MMS/RCS Performance dashboard shows aggregate SMS, MMS, and RCS metrics across campaigns and Canvases, including RCS and SMS fallback metrics when RCS is provisioned.
For filters, time-period comparison, and other settings that apply across channels, see Channel performance dashboards.
Prerequisites
To view this dashboard, you need the “View Usage Data” or “View Dashboard Reports” permission for your workspace.
SMS/MMS/RCS performance dashboard
To use the SMS/MMS/RCS Performance dashboard, go to Analytics > SMS/MMS/RCS Performance, and select the date range for the period you want to view data. Your date range can be up to one year in the past.
When RCS is provisioned for your workspace, the dashboard groups headline metrics into SMS/MMS and RCS sections, including SMS fallback metrics on the RCS tiles where applicable. The Performance Over Time chart includes RCS sends, deliveries, reads, rejections, clicks, and rates alongside the SMS/MMS series, and the dashboard includes opt-in and opt-out tiles. Dashboard filters (tag, campaign, and Canvas) apply to both sections.
SMS/MMS metrics
The calculations for different metrics in the SMS performance dashboard are the same as those on an individual message level (such as campaign analytics). On this dashboard, the metrics are aggregated across all campaigns and Canvases for the date range you’ve selected. To learn more about these definitions, refer to SMS metrics.
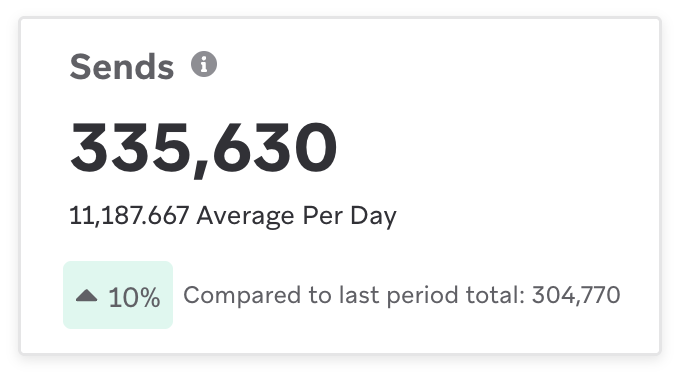
Each tile shows the rate metric first, followed by the count metric (with the exception of Sends, which displays the count metric followed by the average per day). Each tile also shows the comparison to the last period.
| Metric | Type | Calculation |
|---|---|---|
| Sends | Count | Total number of sends across each day in the date range |
| Confirmed deliveries rate | Rate | (Total number of deliveries across each day in the date range) / (Total number of sends across each day in the date range) |
| Delivery failures rate | Rate | (Total number of failures across each day in the date range) / (Total number of sends across each day in the date range) |
| Rejections rate | Rate | (Total number of rejections across each day in the date range) / (Total number of sends across each day in the date range) |
| Click rate | Rate | (Total number of clicks across each day in the date range) / (Total number of deliveries across each day in the date range) |
| Total opt-ins | Count | Completed opt-ins across all sources, counted per user profile and subscription group in the selected date range |
| Total opt-outs | Count | Opt-outs across all sources, counted per user profile and subscription group in the selected date range |
Total Opt-Ins and Total Opt-Outs include subscription changes from all sources—for example, API updates and in-app preferences—not only inbound keywords. Braze counts each change per user profile and subscription group. Profiles that share a phone number count separately. Double opt-ins count only after confirmation. When you filter by campaign, Canvas, or tag, the tiles show only subscription changes attributed to those selections. Opt-in, opt-out, and HELP counts are reported for SMS, MMS, and RCS combined.
RCS metrics
The calculations for different metrics in the RCS performance dashboard are the same as those on an individual message level (such as campaign analytics). On this dashboard, the metrics are aggregated across all campaigns and Canvases for the date range you’ve selected. To learn more about these definitions, refer to Reporting for SMS, MMS, and RCS and Report Metrics Glossary (filter by RCS).
Each tile shows the rate metric first, followed by the count metric (with the exception of Sends, which displays the count metric followed by the average per day). Each tile also shows the comparison to the last period.
| Metric | Type | Calculation | Notes |
|---|---|---|---|
| Sends | Count | Total number of RCS sends across each day in the date range | Counts the RCS send attempt. Fallback SMS is counted separately under SMS/MMS. |
| Delivery rate | Rate | (Total number of RCS and SMS fallback deliveries across each day in the date range) / (Total number of RCS sends across each day in the date range) | Includes SMS fallback deliveries. The tile also shows RCS deliveries, SMS fallback deliveries, and SMS fallback rate. |
| Rejection rate | Rate | (Total number of RCS and SMS fallback rejections across each day in the date range) / (Total number of RCS sends across each day in the date range) | Includes SMS fallback rejections. Rejection totals include provider outcomes such as failed or undelivered statuses, which differ from delivery failures. |
| Click rate | Rate | (Total number of RCS clicks across each day in the date range) / (Total number of RCS deliveries across each day in the date range) | Uses RCS deliveries (not SMS fallback) in the denominator. Click totals include message URL clicks and card interactions (such as suggested replies, suggested URLs, and button replies). |
| Read rate | Rate | (Total number of RCS reads across each day in the date range) / (Total number of RCS deliveries across each day in the date range) | Counts RCS messages only. |