Custom events report
The custom events report lets you view the occurrences of one or more custom events over time. You can break down results by segment, apply KPI formulas, and export the data for further analysis.
Viewing a report
To view this report from the dashboard, go to Analytics > Custom events report. Select the custom events you want to analyze, then select Apply to generate the graph.
Configuring your report
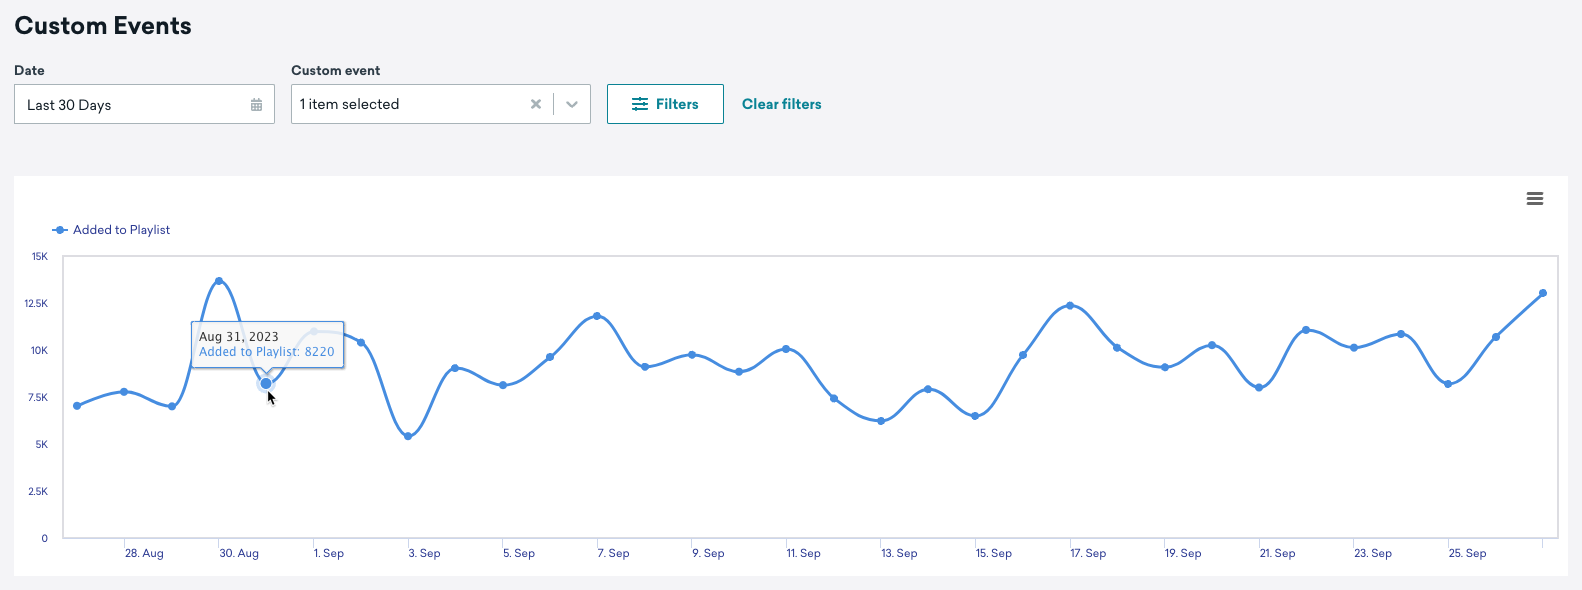
Use the following options to customize what data appears in the Performance Over Time graph.
| Option | Description |
|---|---|
| Apps | By default, the report includes data from all apps. Use this dropdown to narrow the report to a specific app. |
| Breakdown custom events by | Controls how the time series for your selected custom event is grouped. By default, the chart shows the overall aggregate trend by date. Switch to Custom Events by Hour to see intraday patterns, or Custom Events per MAU to normalize event volume against your monthly active user count. |
| Filter by Segments | Toggle this on to break down event counts by one or more segments. When enabled, select the segments you want to compare. The graph shows the number of users in each segment who performed the custom event. |
| KPI formula | Replaces the raw event count with a calculated metric built from a numerator (such as a custom event count) and a denominator (such as DAU, MAU, or an analytics-enabled segment size). When you select one or more formulas, the chart plots each formula’s value over the selected date range so you can compare normalized performance (for example, “events per active user”) instead of total event volume. If no data is available for the selected time range and formulas, Braze displays a “no data” message—broaden the time range or choose different formulas. Select Manage KPI formulas to create or edit formulas. |
Exporting data
To export your custom events data, select Chart context menu in the Performance Over Time graph and select your export option.

Troubleshooting
Segment breakdown doesn’t match workspace totals
When you use Filter by Segments or narrow the report with the Apps dropdown, the chart counts users in the selected segment (or app) who performed the custom event—not every event occurrence across the workspace.
If you compare a segment line to an unfiltered view (or to All Apps), totals often differ because:
- All Apps can include users and events from every app in the workspace.
- A single-app filter only includes profiles tied to that app.
- Segment filters count users who match the segment definition at query time, which may exclude users who performed the event outside the segment’s criteria.
To compare like with like, use the same app filter and segment selection for each series you compare, or export the data and reconcile counts in your analytics tool.