In-app message surveys
Braze surveys collect feedback in in-app messages that you can analyze and use in follow-up messaging. During beta, surveys are built in the drag-and-drop editor.

Braze surveys is currently in early access. Contact your Braze account manager if you’re interested in participating in the early access.
Prerequisites
Before creating a survey, you must:
- Have access to in-app messages in your Braze workspace
- Be familiar with creating in-app messages in the drag-and-drop editor
Create a survey
During early access, surveys are built inside your existing message composition flow.
- Create an in-app message in a campaign or Canvas.
- Select Survey as your message type.
Compose an in-app message survey
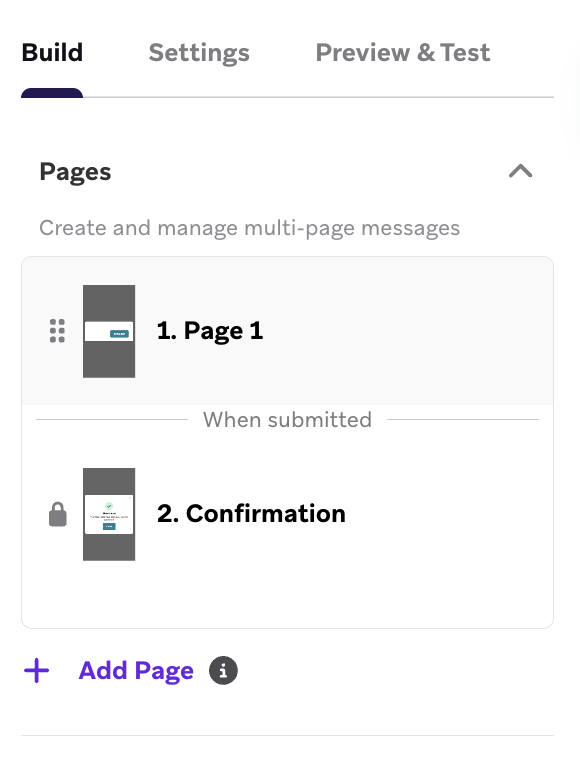
In-app message surveys contain two pages by default:
- Page 1, where users answer questions
- Confirmation page, where the survey is submitted
By default, buttons are linked to Next page. To change this behavior, update each button in the Actions panel.
Use survey form blocks
For shared styling and composition controls, see:
You can add the following form blocks to surveys:
- Phone capture
- Email capture
- Radio button group
- Short text capture
- Long text capture
- Dropdown
- Single checkbox
- Checkbox group
Randomize answer choices
Radio button group, checkbox group, and dropdown blocks support randomized answer choices. Turn on Randomize choice order to shuffle the choices each time the survey loads. Use this setting to reduce order bias when the same first option could skew responses.
Randomization changes only the display order for each survey respondent. Reporting labels and values remain mapped to the choices you configured, so analytics, CSV exports, and segmentation use the same response data.
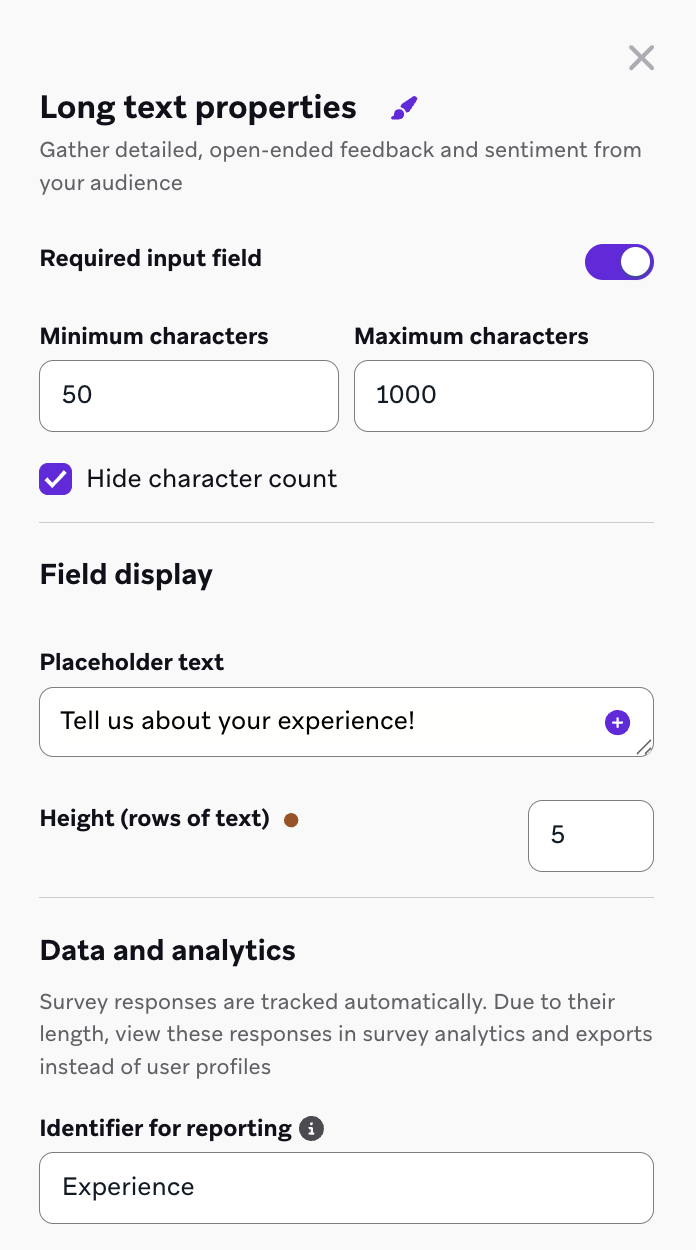
Long text capture
Long text capture is useful for qualitative feedback.
You can configure:
- Minimum and maximum character counts (up to 1,000)
- Whether to show character limits during composition
- Text area height (rows)
- Placeholder text
During early access, long text responses are available in reporting and exports, but they can’t be logged as user profile custom attributes.
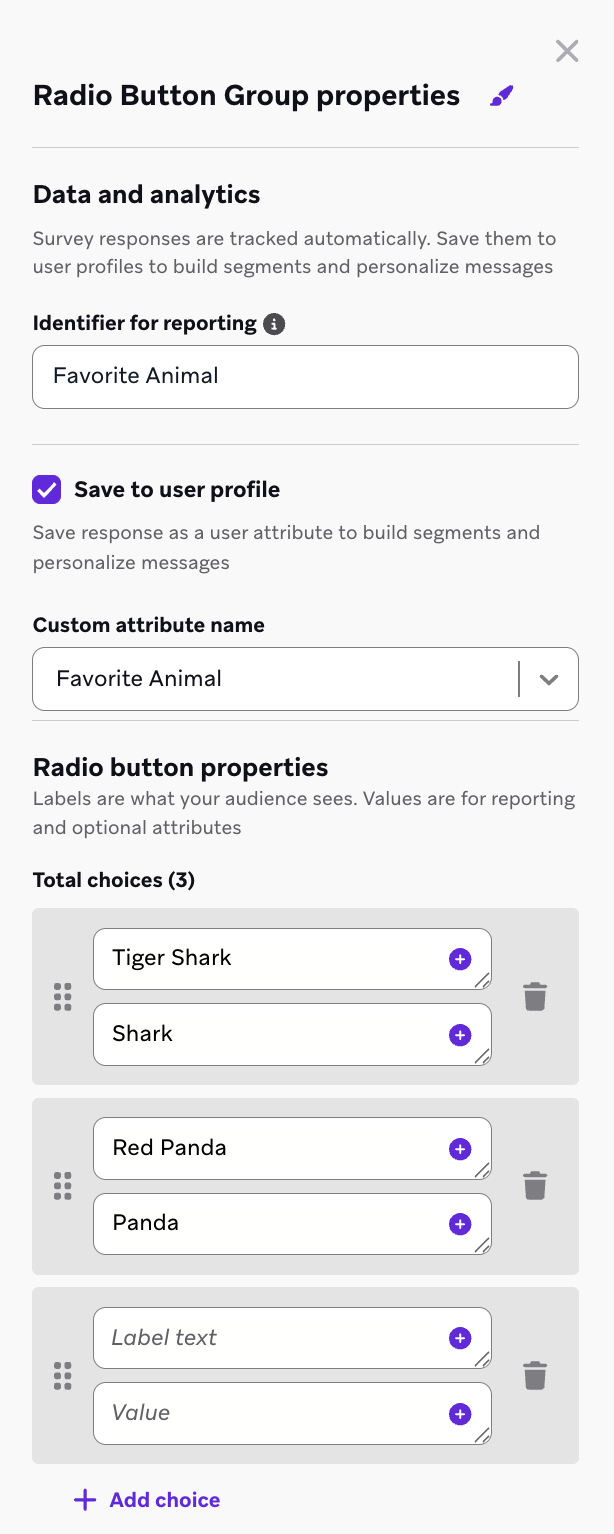
Configure required fields and attributes
For each form block, enter an Identifier for Reporting in the right-side settings panel. This identifier appears in survey reporting and CSV exports.
During early access:
- You can log most survey responses to user profile custom attributes.
- Long text responses can’t be logged as custom attributes.
- If you choose not to log a response as a user attribute, you can’t segment users by that response value.
View reporting and analytics
After launch, review results in:
- The Responses tab for in-app message surveys
Top-level analytics include:
- All responses: Total complete and incomplete responses
- Completed: Users who completed all required questions
- Partially complete: Users who submitted some data, but did not complete all required questions
- Unique impressions: Total page views
You can also review per-question response breakdowns and export data as CSV.
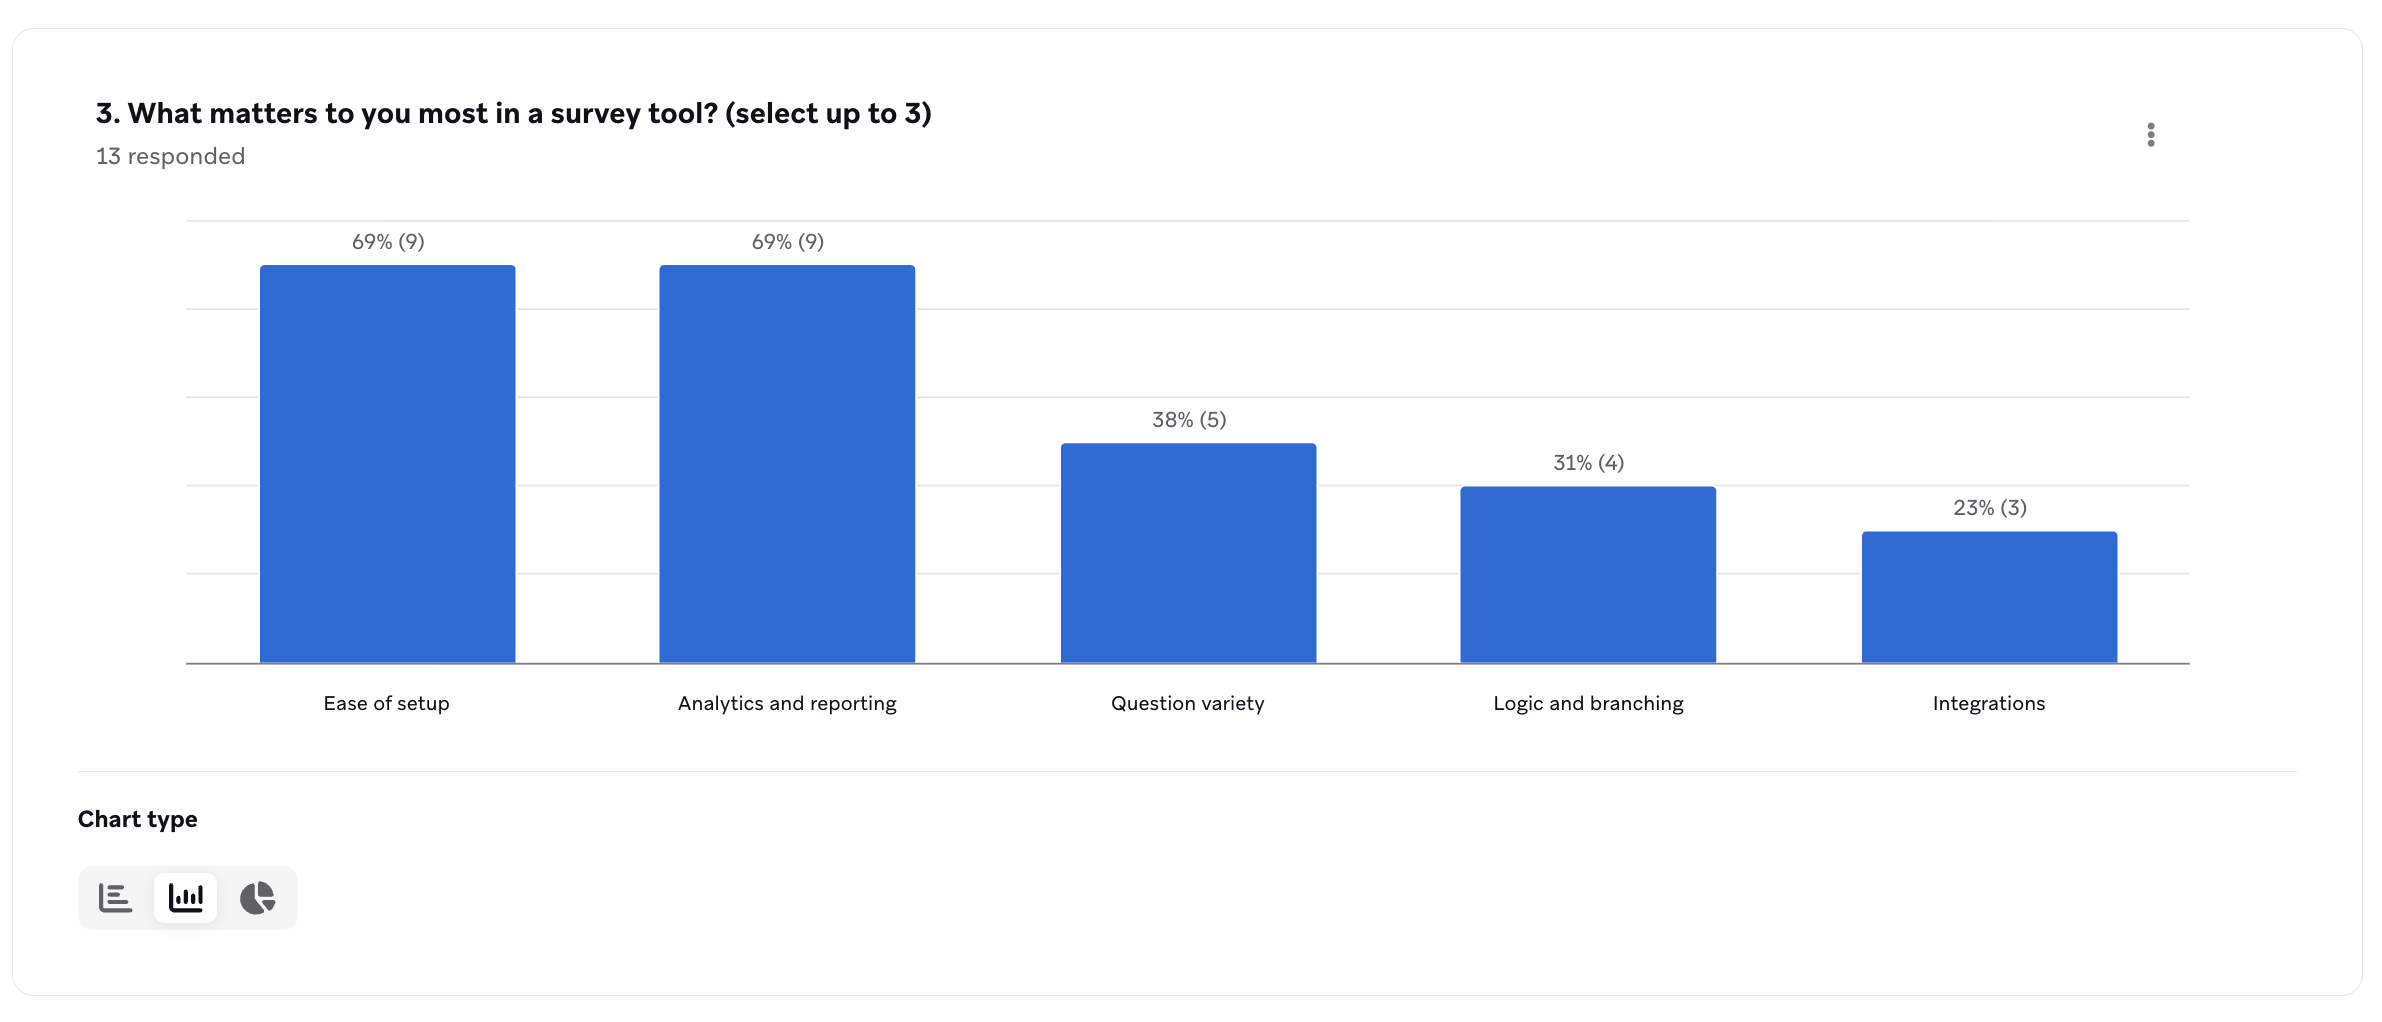
Choose a chart type
For radio button, dropdown, and checkbox form blocks, you can choose among three chart types in the survey analytics view. This gives you more flexibility to interpret and share insights without exporting to a third-party tool.
| Chart type | Best for |
|---|---|
| Bar chart | The default horizontal view of response counts and percentages. |
| Column chart | A vertical view of response counts and percentages. Use this chart to compare responses side-by-side, especially for multi-select questions or questions with more answer options. |
| Pie chart | A proportional breakdown of responses. Use this chart for single-select questions when you want to see how responses are distributed across options. |
Each chart updates in real time as responses come in. You can switch chart types at any time without affecting the underlying data.
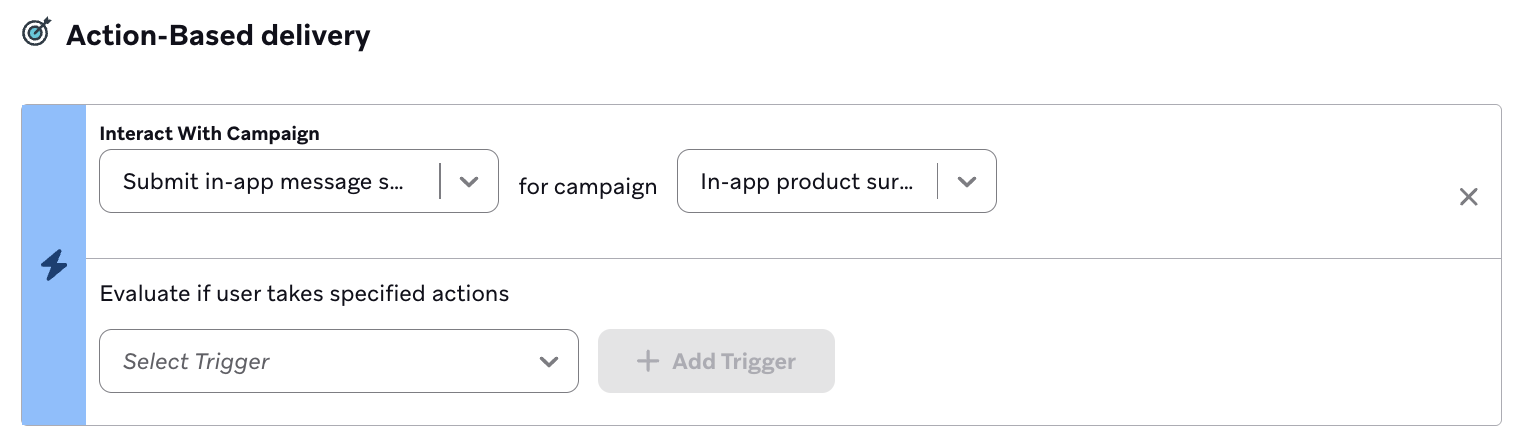
Retarget and trigger
During early access, you can:
- Segment users by survey responses that are logged as user attributes.
- Segment users by survey completion status.
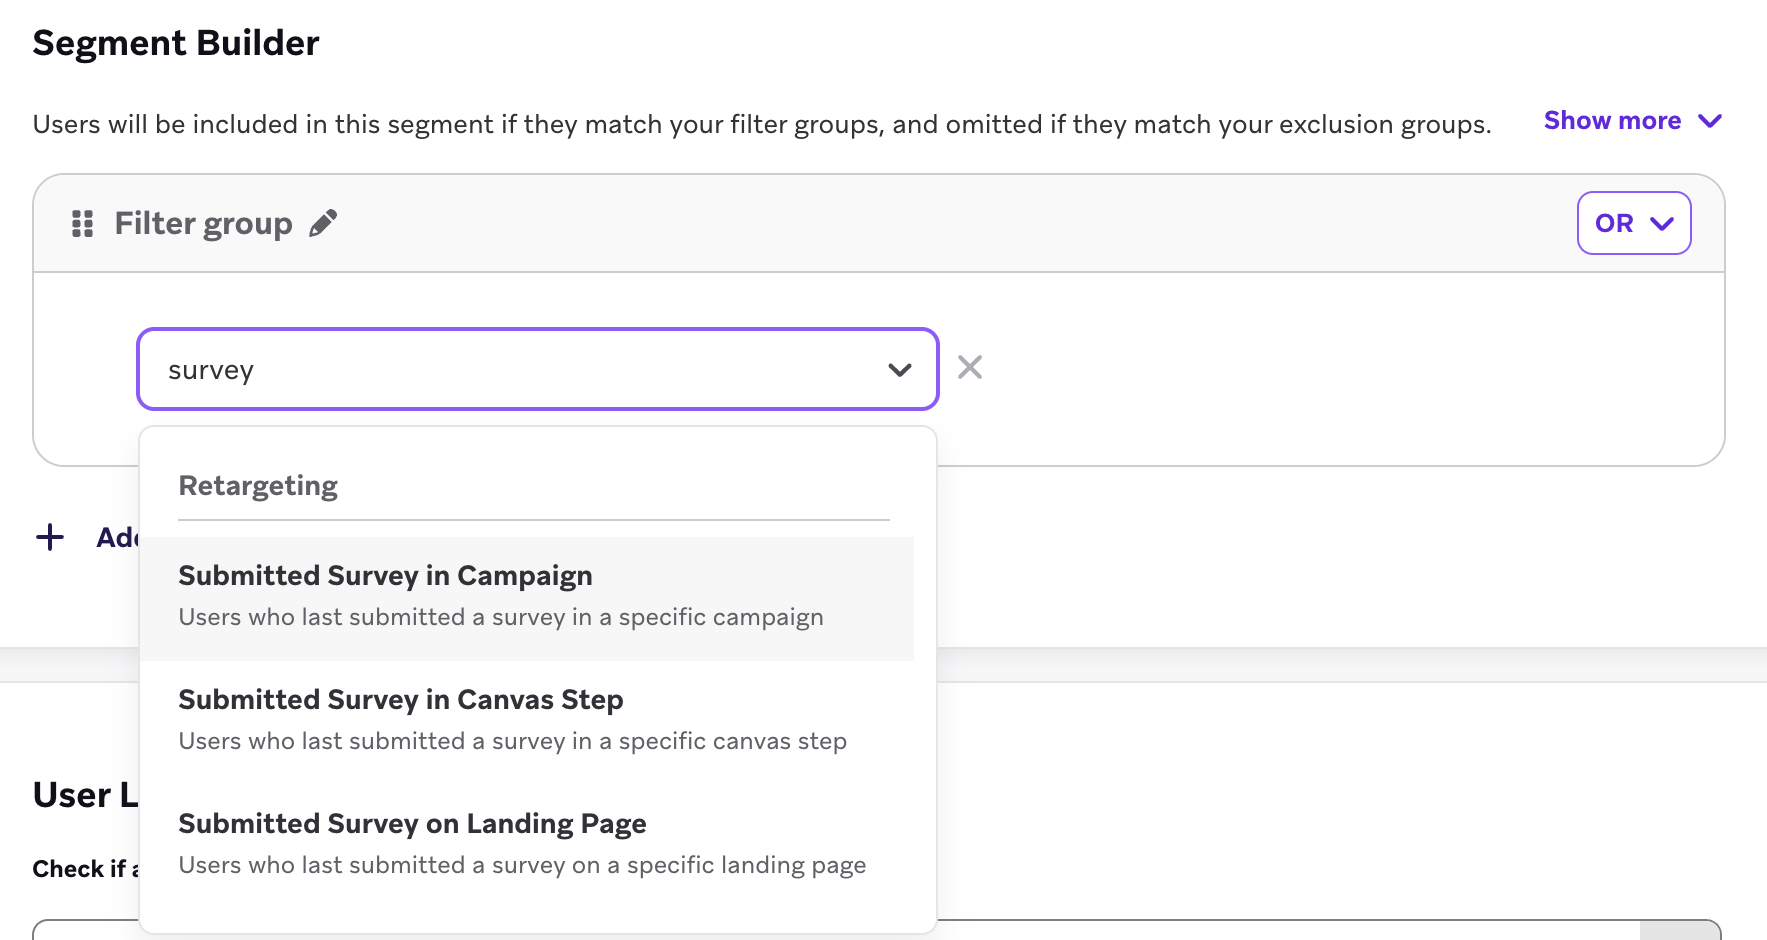
- Trigger campaigns and Canvases when a user completes a survey in an in-app message campaign.
Limitations
During early access, you are restricted by the following:
- You can’t segment users by long-form text responses.
- Question-and-answer triggering that does not rely on logged user attributes is not available.