Push reporting
This article covers push reporting, which you can use to view and analyze the success of your push campaigns.
Viewing analytics
Once you’ve launched your campaign, you can return to the details page for that campaign to view key metrics. Navigate to the Campaigns page and select your campaign to open the details page. For push messages sent in Canvas, refer to Canvas analytics.
Looking for definitions for the terms and metrics listed in your report? Refer to our Report Metrics Glossary and filter by Push.
From the Campaign Analytics tab, you can view your reports in a series of panels. You may see more or less than those listed in the sections below, but each has its own useful purpose.
Time range
By default, the time range for Campaign Analytics will display the last 90 days from the current time. This means that if the campaign was launched more than 90 days ago, the analytics will display as “0” for the given time range. To view all analytics for older campaigns, adjust the reporting time range.
Campaign details
The Campaign Details panel shows a high-level overview of the entire performance for your push message.
Review this panel to see overall metrics such as the number of messages sent to the number of recipients, the primary conversion rate, and the total revenue generated by this message. You can also review delivery, audience, and conversion settings from this page.

Changes Since Last Viewed
The number of updates to the campaign from other members of your team is tracked by the Changes Since Last Viewed metric on the campaign overview page. Select Changes Since Last Viewed to view a changelog of updates to the campaign’s name, schedule, tags, message, audience, approval status, or team access configuration. For each update, you can see who performed the update and when. You can use this changelog to audit changes to your campaign.
Push Performance
The Push Performance panel outlines how well your message has performed across various dimensions. The metrics in this panel vary depending on your chosen messaging channel, and whether or not you are running a multivariate test. You can click on the Preview icon to view your message for each variant or channel.
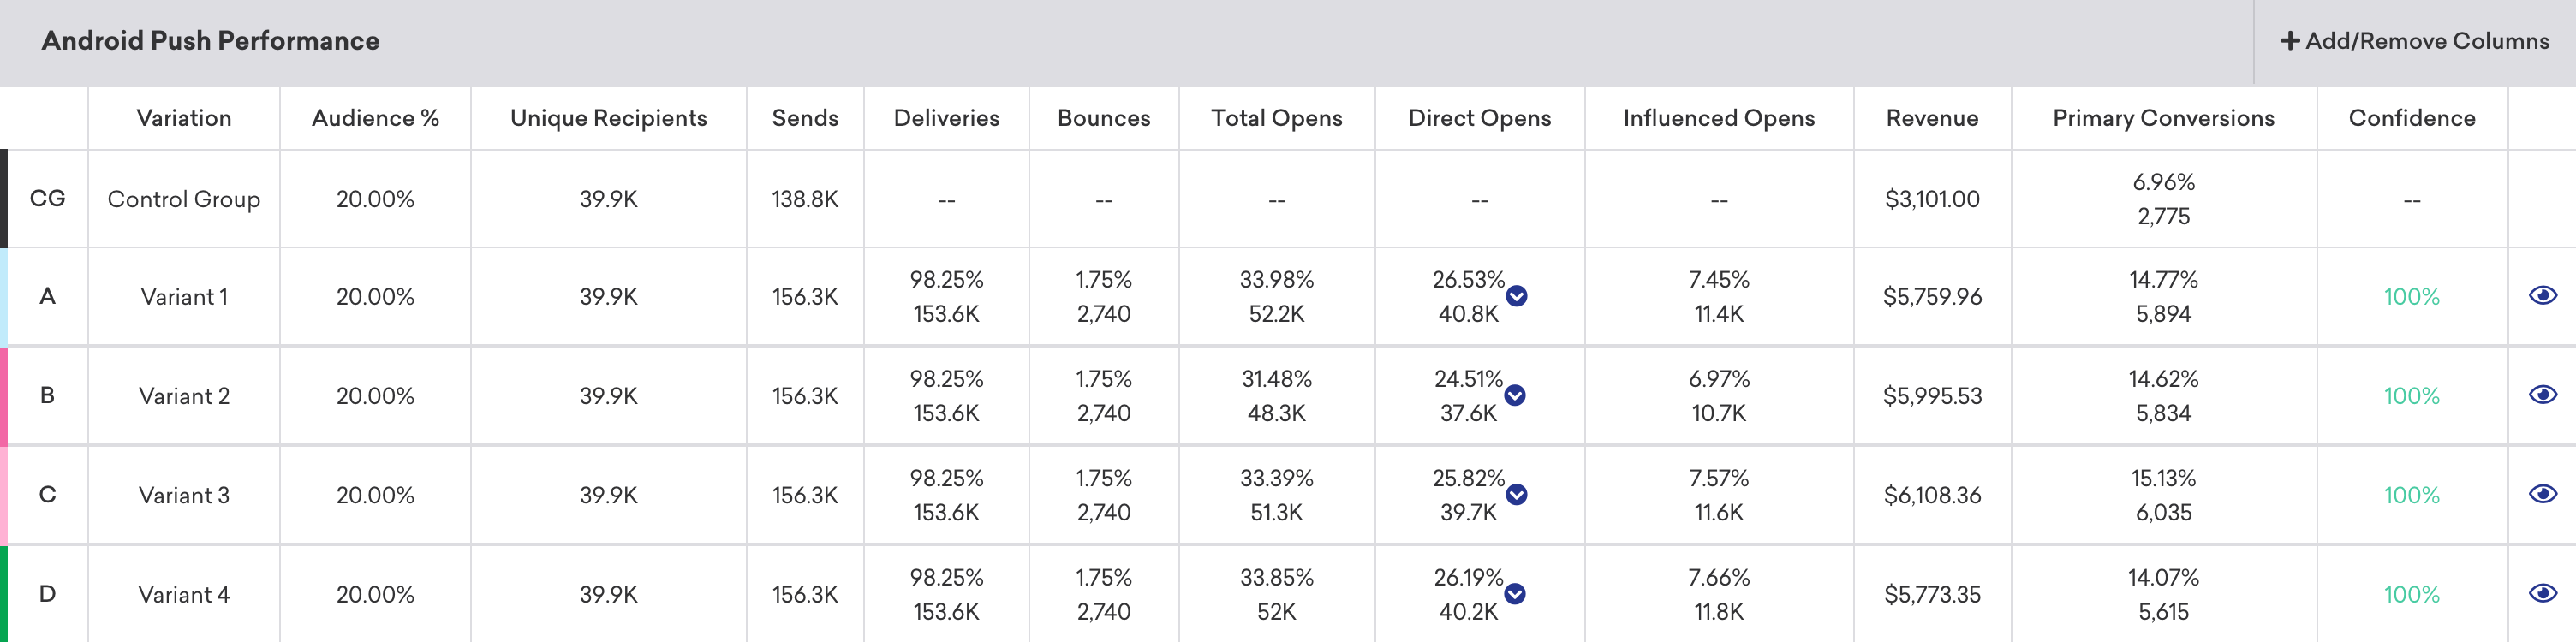
If you want to simplify your view, click Add/Remove Columns and clear any metrics as desired. By default, all metrics are displayed.
Push metrics
Here is a breakdown of some key metrics you may see while reviewing your message performance. For the full definitions of all push metrics, refer to the Report Metrics Glossary and filter by push.
| Metric | Description |
|---|---|
| Bounces | Bounces is the total number of messages that were unsuccessfully delivered to the intended recipients. See Bounced push notifications. |
| Direct Opens | Direct Opens is the total number of users who opened your app or website by directly pressing the notification. |
| Opens | Opens are instances including both Direct Opens and Influenced Opens in which the Braze SDK has determined, using a proprietary algorithm, that a push notification has caused a user to open the app. |
Delivery of notifications is a “best effort” by Apple Push Notification services (APNs). It is not intended to deliver data to your app, only to notify the user that there is new data available. The important distinction is that we will display how many messages we successfully delivered to APNs, not necessarily how many APNs successfully delivered to devices.
Tracking unsubscribes
Push unsubscribes aren’t included as a metric in campaign analytics, and depend on updates to a user’s push status from providers like Apple or Google. These updates can be infrequent and unpredictable. As a result, push unsubscribes are not included as a metric in push campaign analytics.
However, manually tracking push unsubscribes can still provide valuable insights into user responses to your notification frequency and content relevance. Here are two options for tracking push unsubscribes: Using segment filters or custom filters.
You can create a segment to identify users who aren’t push enabled, meaning they’re not subscribed or opted-in and don’t have a foreground push token. For example, to see the number of unsubscribes in your app, you would use an “OR” combination of the following segments:
Background or Foreground Push Enabled is falseHas Uninstalled

Note the segmentation filters are approximate and can’t be specifically tied to a date and campaign.
Logging a custom event for subscription change will log data points. Alternatively, use segment filters to identify and target users who aren’t push enabled.
For a different workaround, we also recommend creating a custom event for push unsubscribes based on whether a user’s push enabled status is true or false in order to track this metric.
Understanding opens
Even though Direct Opens and Influenced Opens include the word “opens”, they’re actually different metrics. Direct Opens refers to the direct opening of a push notification, as stated in the table above. Influenced Opens refers to the opening of an app, without opening a push notification within a specific time frame after receiving it. So, Influenced Opens refers to the app opens, not push notification opens.
Why push sends can exceed unique recipients
The number of Sends may exceed the number of Unique Recipients due to the following reasons:
- Re-eligibility is on: When re-eligibility is enabled in your campaign or Canvas settings, users who meet the segment and delivery criteria can receive the same push notification multiple times. This results in a higher number of total sends.
- Users have multiple devices: If re-eligibility is not enabled, the difference may be explained by users having multiple devices associated with their profile. For instance, a user could have both a smartphone and tablet, and the push notification is being sent to all registered devices. Each delivery counts as a send, but only one unique recipient is recorded.
- Users are assigned to multiple apps: If users are associated with more than one app (such as when testing a new app), they may receive the same push notification on each app. This contributes to a higher number of sends.
Why bounces occur
Bounces occur in Apple Push Notification services (APNs) when a push notification attempts delivery to a device that does not have the intended app installed. APNs also has the right to change tokens for devices arbitrarily. If you attempt to send to a user’s device in which their push token has changed in between when we previously registered their token (such as at the beginning of each session when we register a user for a push token) and the time of send, this would cause a bounce.
If a user disables push within their device settings on subsequent app open the SDK will detect that push has been disabled and notify Braze. At this point we will update the push enabled state to be disabled. When a disabled user receives a push campaign before having a new session, the campaign would successfully send and appear as delivered. The push will not bounce for this user. Following a subsequent session, when you attempt to send a push to the user Braze is already aware of whether we have a foreground token as such no notification is sent.
Push notifications that expire before delivery are not considered as failed and will not be recorded as a bounce.
Firebase Cloud Messaging (FCM) bounces could occur in three cases:
| Scenario | Description |
|---|---|
| Uninstalled applications | When a message attempts delivery to a device and the intended app is uninstalled on that device, the message will be discarded and the device’s registration ID will be invalidated. Any future attempts at messaging the device will return a NotRegistered error. |
| Backed up application | When an application is backed up, its registration ID could become invalid before the application is restored. In this case, FCM will no longer store the application’s registration ID and the application will no longer receive messages. As such, registration IDs should not be saved when an application is backed up. |
| Updated application | When an application is updated, the previous version’s registration ID may no longer work. As such, an updated application should replace its existing registration ID. |
Historical performance
The Historical Performance panel allows you to view the metrics from the Message Performance panel as a graph over time. Use the filters at the top of the panel to modify the stats and channels shown in the graph. The time range of this graph will always mirror the time range specified at the top of the page.
To get a day-by-day breakdown, click the hamburger menu and select Download CSV to receive a CSV export of the report.

Conversion event details
The Conversion Event Details panel shows you the performance of your conversion events for your campaign. For more information, refer to Conversion Events.

Conversion correlation
The Conversion Correlation panel gives you insight into what user attributes and behaviors help or hurt the outcomes you set for campaigns. For more information, refer to Conversion correlation.

Retention report
Retention reports show you the rates at which your users have performed a selected retention event over time periods in a specific campaign or Canvas. For more information, refer to Retention reports.
Funnel report
Funnel reporting offers a visual report that allows you to analyze the journeys your customers take after receiving a campaign or Canvas. If your campaign or Canvas uses a control group or multiple variants, you will be able to understand how the different variants have impacted the conversion funnel at a more granular level and optimize based on this data.
For more information, refer to Funnel reports.
 Edit this page on GitHub