In-app message reporting
This reference article covers in-app message reporting and analytics including campaign details, message performance, and historical performance.
Viewing analytics
Once you’ve launched your campaign, you can return to the details page for that campaign to view key metrics. Navigate to the Campaigns page and select your campaign to open the details page. For in-app messages sent in Canvas, refer to Canvas analytics.
Looking for definitions for the terms and metrics listed in your report? Refer to our Report Metrics Glossary and filter by in-app message.
From the Campaign Analytics tab, you can view your reports in a series of panels. You may see more or less than those listed in the sections below, but each has its own useful purpose.
Time range
By default, the time range for Campaign Analytics will display the last 90 days from the current time. This means that if the campaign was launched more than 90 days ago, the analytics will display as “0” for the given time range. To view all analytics for older campaigns, adjust the reporting time range.
Campaign details
The Campaign Details panel shows a high-level overview of the entire performance for your in-app message.
Review this panel to see overall metrics such as the number of messages sent to the number of recipients, the primary conversion rate, and the total revenue generated by this message. You can also review delivery, audience, and conversion settings from this page.

In Canvas, you’ll see in-app message performance mapped onto the Canvas you’ve created. You can use the control panel at the top of the page to clear other messaging types (channels) and only view the in-app messages in your Canvas.

Estimated Audience and Current Audience
Depending on how large your workspace is, the Campaign Details panel may label audience statistics Estimated Audience or Current Audience.
The following table explains when each label is used and what it means.
| Footer label | When it is used |
|---|---|
| Estimated Audience | Braze does not run a full-database count by default. Audience size is estimated from a sample and extrapolated, similar to the Reachable Users range in the segment builder. Margins of error are expected, especially for large workspaces or small segments as a share of the workspace. |
| Current Audience | Braze can compute the default statistic with a full scan of workspace profiles, so the displayed audience size is a current, unsampled count (still subject to channel reachability, subscription rules, and other targeting options). |
For details on sampling behavior, Calculate exact statistics, and segmenting Reachable users, see Measure segment size.
Changes Since Last Viewed
The number of updates to the campaign from other members of your team is tracked by the Changes Since Last Viewed metric on the campaign overview page. Select Changes Since Last Viewed to view a changelog of updates to the campaign’s name, schedule, tags, message, audience, approval status, or team access configuration. For each update, you can see who performed the update and when. You can use this changelog to audit changes to your campaign.
In-App Message Performance
The In-App Message Performance panel outlines how well your message has performed across various dimensions. The metrics in this panel vary depending on your chosen messaging channel, and whether or not you are running a multivariate test. You can click on the Preview icon to view your message for each variant or channel.
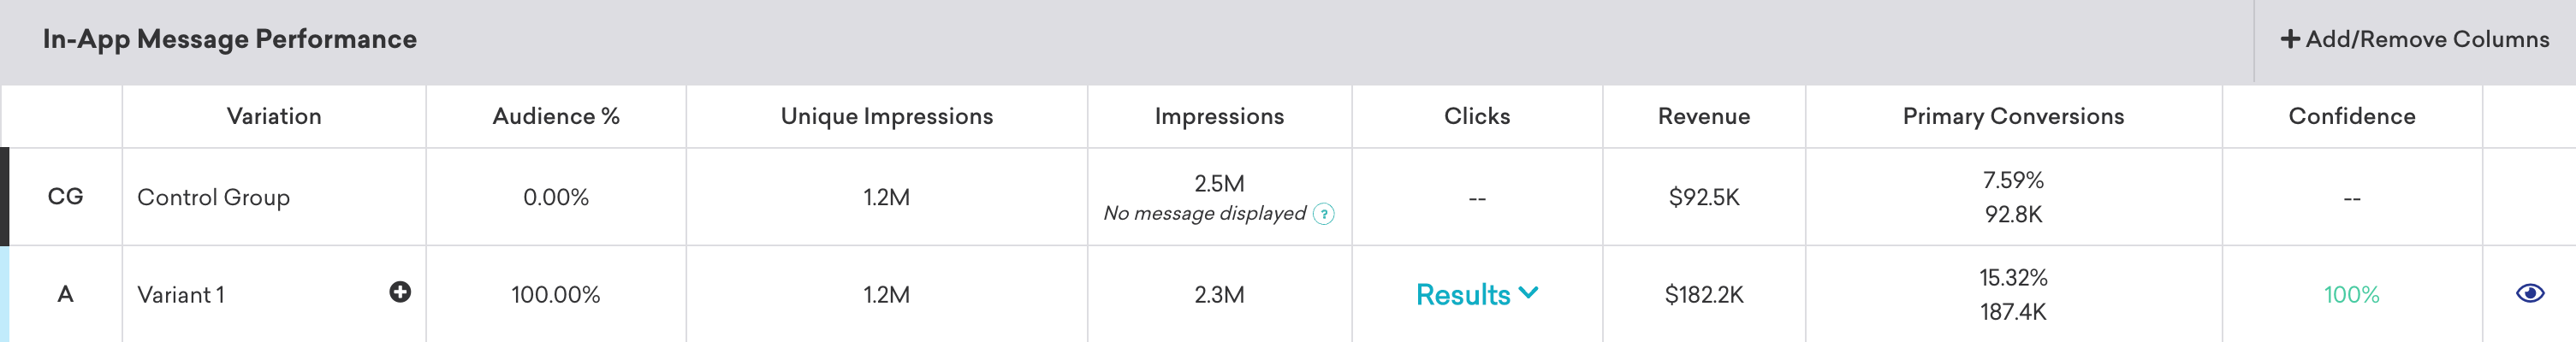
If you want to simplify your view, click Add/Remove Columns and clear any metrics as desired. By default, all metrics are displayed.
In-app message metrics
Here are some key in-app message metrics you may see in your analytics. To see the full definitions of all in-app message metrics used in Braze, refer to our Report Metrics Glossary.
Reporting for Button 1 Clicks and Button 2 Clicks only works when you specify the Identifier for Reporting as “0” and “1” respectively in the in-app message.

| Metric | Definition |
|---|---|
| Body Clicks |
Body Clicks occur when a user clicks on a message that doesn't have buttons (Button 1, Button 2) and was created with the traditional editor, and when a message created with the HTML editor or drag-and-drop editor uses brazeBridge.logClick() with no arguments.
|
| Button 1 Clicks | Button 1 Clicks is the total number of clicks on Button 1 of the message. |
| Button 2 Clicks | Button 2 Clicks is the total number of clicks on Button 2 of the message. |
| Unique Impressions | Unique Impressions is the total number of users who have viewed a message from a given campaign. An impression is logged only when the message becomes visible on a user's screen. |
| Total Impressions | Total Impressions is the number of times a message is viewed. Braze logs an impression only when the message becomes visible to the user on their screen. For example, if a message is placed at the bottom of a page, the impression is not logged until the user scrolls down and the message comes into view. If a user is shown the same message twice, it will count as two impressions. |
| Conversions (B, C, D) | Conversions (B, C, D) are additional conversion events added after the primary conversion event. This is the number of times a defined event occurred after interacting with or viewing a received message from a Braze campaign. |
| Total Conversions | Total Conversions is the total number of times a user completes a specific conversion event after viewing an in-app message campaign. |
| Conversion Rate | Conversion Rate is the percentage of times a defined event occurred compared to all recipients of a message. This defined event is determined when you build the campaign. |
| Close Message | Close Message is the total number of clicks on the close button of the message. This only exists for in-app messages created in the drag-and-drop editor, not the traditional editor. |
Discrepancies between control groups and variants
When an in-app message campaign has a 50-50 variant split, sometimes the control group will have a slightly higher percentage than the variant (such as 51% for the control group and 49% for the variant). This discrepancy is caused by a difference in rendering time.
The distribution between control and variant groups is intended to be roughly even, but assignment to a variant occurs when the in-app message is actually sent to the device. Some users may never trigger the in-app message (for example, they never perform the action that triggers the required custom event), which can cause differences in group sizes.
Historical performance
The Historical Performance panel allows you to view the metrics from the Message Performance panel as a graph over time. Use the filters at the top of the panel to modify the stats and channels shown in the graph. The time range of this graph will always mirror the time range specified at the top of the page.
To get a day-by-day breakdown, click the hamburger menu and select Download CSV to receive a CSV export of the report.

If you select to only send to users who can see the latest Braze version of in-app messages (Generation 3), your Target Audience does not adjust to reflect your choice.
Conversion event details
The Conversion Event Details panel shows you the performance of your conversion events for your campaign. For more information, refer to Conversion Events.

Conversion correlation
The Conversion Correlation panel gives you insight into what user attributes and behaviors help or hurt the outcomes you set for campaigns. For more information, refer to Conversion correlation.

Retention report
Retention reports show you the rates at which your users have performed a selected retention event over time periods in a specific campaign or Canvas. For more information, refer to Retention reports.
Funnel report
Funnel reporting offers a visual report that allows you to analyze the journeys your customers take after receiving a campaign or Canvas. If your campaign or Canvas uses a control group or multiple variants, you will be able to understand how the different variants have impacted the conversion funnel at a more granular level and optimize based on this data.
For more information, refer to Funnel reports.
 Edit this page on GitHub