Email metrics that matter: How to track campaign success the right way
Published on July 18, 2025/Last edited on July 18, 2025/12 min read

Team Braze
The days of measuring email performance by open rate alone are over. With privacy updates reshaping how marketers access and interpret engagement data, and with inbox competition fiercer than ever, relying on superficial stats can lead teams in the wrong direction.
Instead, lifecycle and CRM marketers are shifting focus toward metrics that map more directly to what actually matters: Customer action, campaign goals, and long-term value. Whether your emails are designed to onboard, convert, or re-engage, the ability to measure impact clearly—and act on that data fast—has become an in-demand skill.
In this guide, we’ll cover the essential email metrics in 2025, explain how to align them with your goals, and explore the tactics that turn numbers into meaningful performance gains. We’ll also look at how leading brands are using data to build smarter email strategies—along with the reporting habits that separate reactive marketers from proactive ones.
Contents
- What are email metrics, and why do they matter?
- 10 essential customer email metrics to track
- Email performance KPIs that go deeper
- Email reporting best practices
- How CRM and lifecycle teams can improve email performance
- Real-world wins: Better metrics, better outcomes
- Final thoughts
- Email metrics FAQs
What are email metrics, and why do they matter?
Email metrics are the data points that show how your messages are performing—whether people are opening them, clicking through, converting, unsubscribing, or ignoring them altogether.
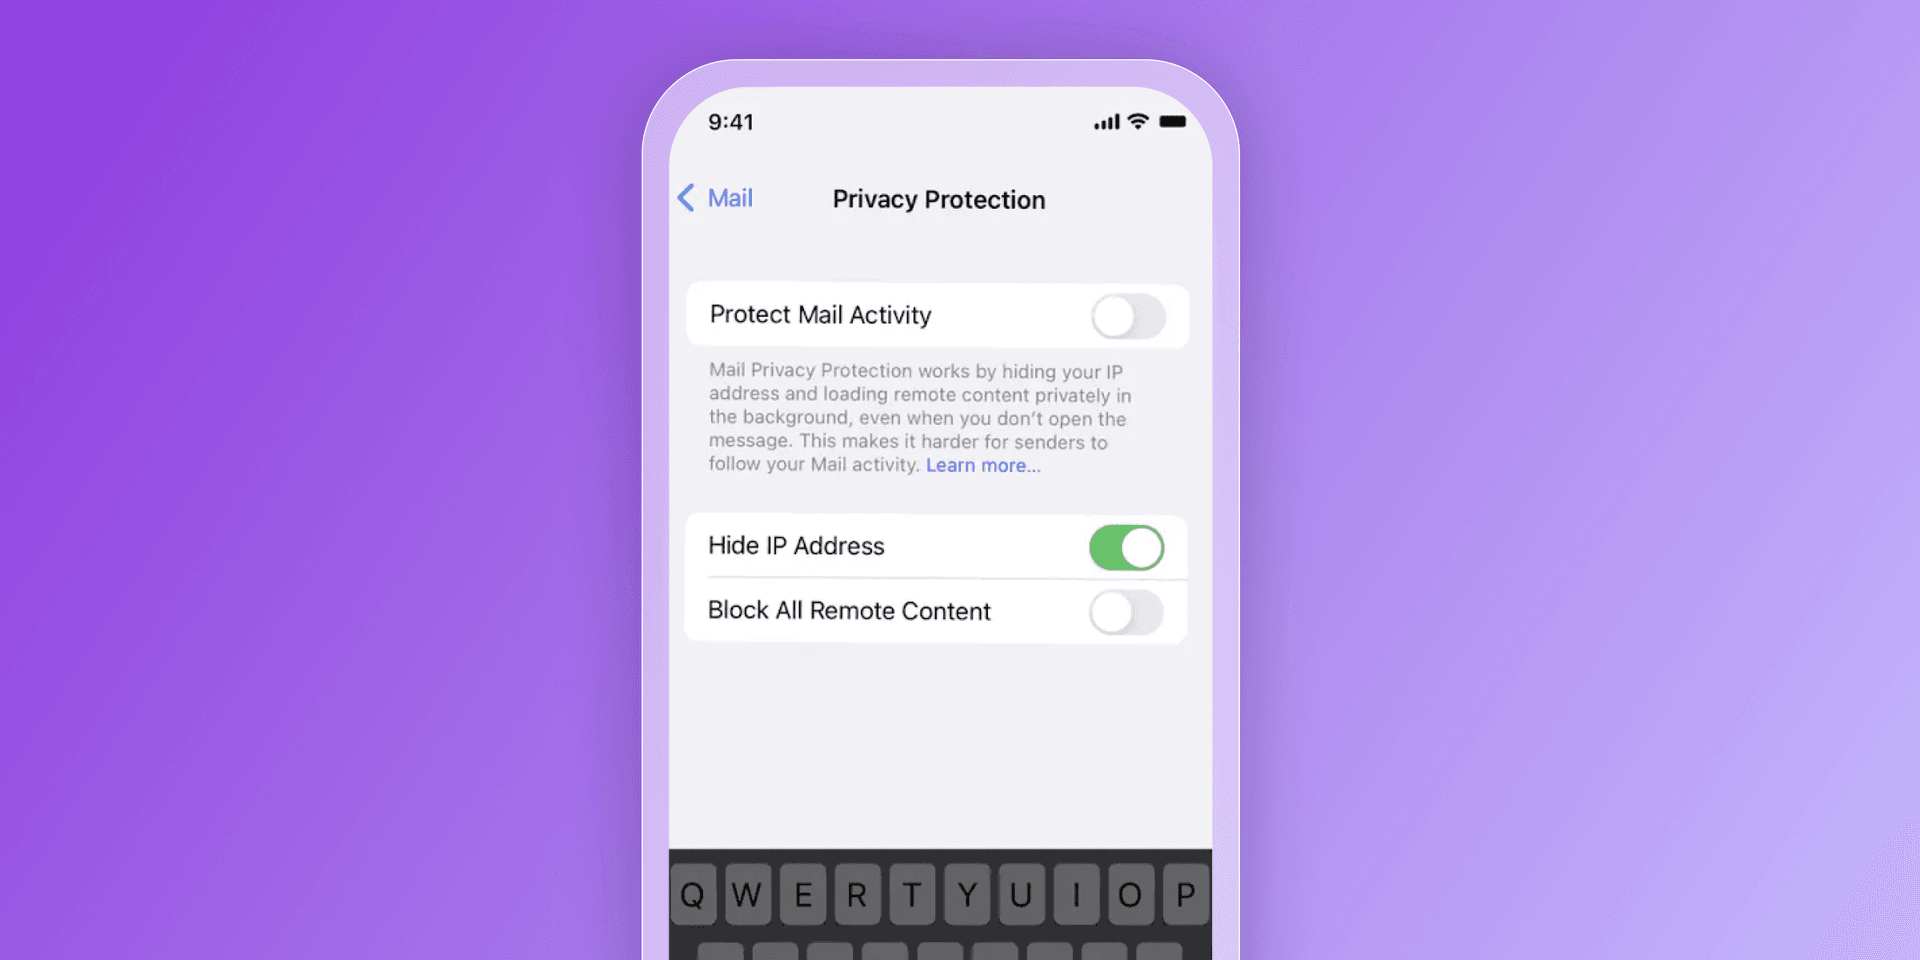
Vanity metrics, like total opens or raw send volume, may look impressive at a glance, but they often fail to reflectcustomer behavior or business impact. That’s especially true post-Apple Mail Privacy Protection (MPP), which automatically preloads email content and inflates open rates—making it harder to know if someone saw your message or not.
Effective email reporting means looking past these surface-level stats. It’s about tracking goal-specific performance across the entire customer lifecycle: Acquisition, engagement, conversion, and retention. The right email metrics help you answer bigger questions:
- Are we reaching the right people at the right time?
- Is our content prompting meaningful action?
- What’s driving long-term loyalty—and what’s not?
Email metrics reveal how your campaigns connect to customer intent and how you can adjust in real time to increase their impact.
10 essential customer email metrics to track
So you’ve finished the technical steps to get your email program configured correctly. You’ve gone through the IP warming process. You and your team have come up with the most engaging and killer content that will resonate with your audience. You start sending live campaigns, and now it’s time to track and report on these essential email metrics.
1. Open rate
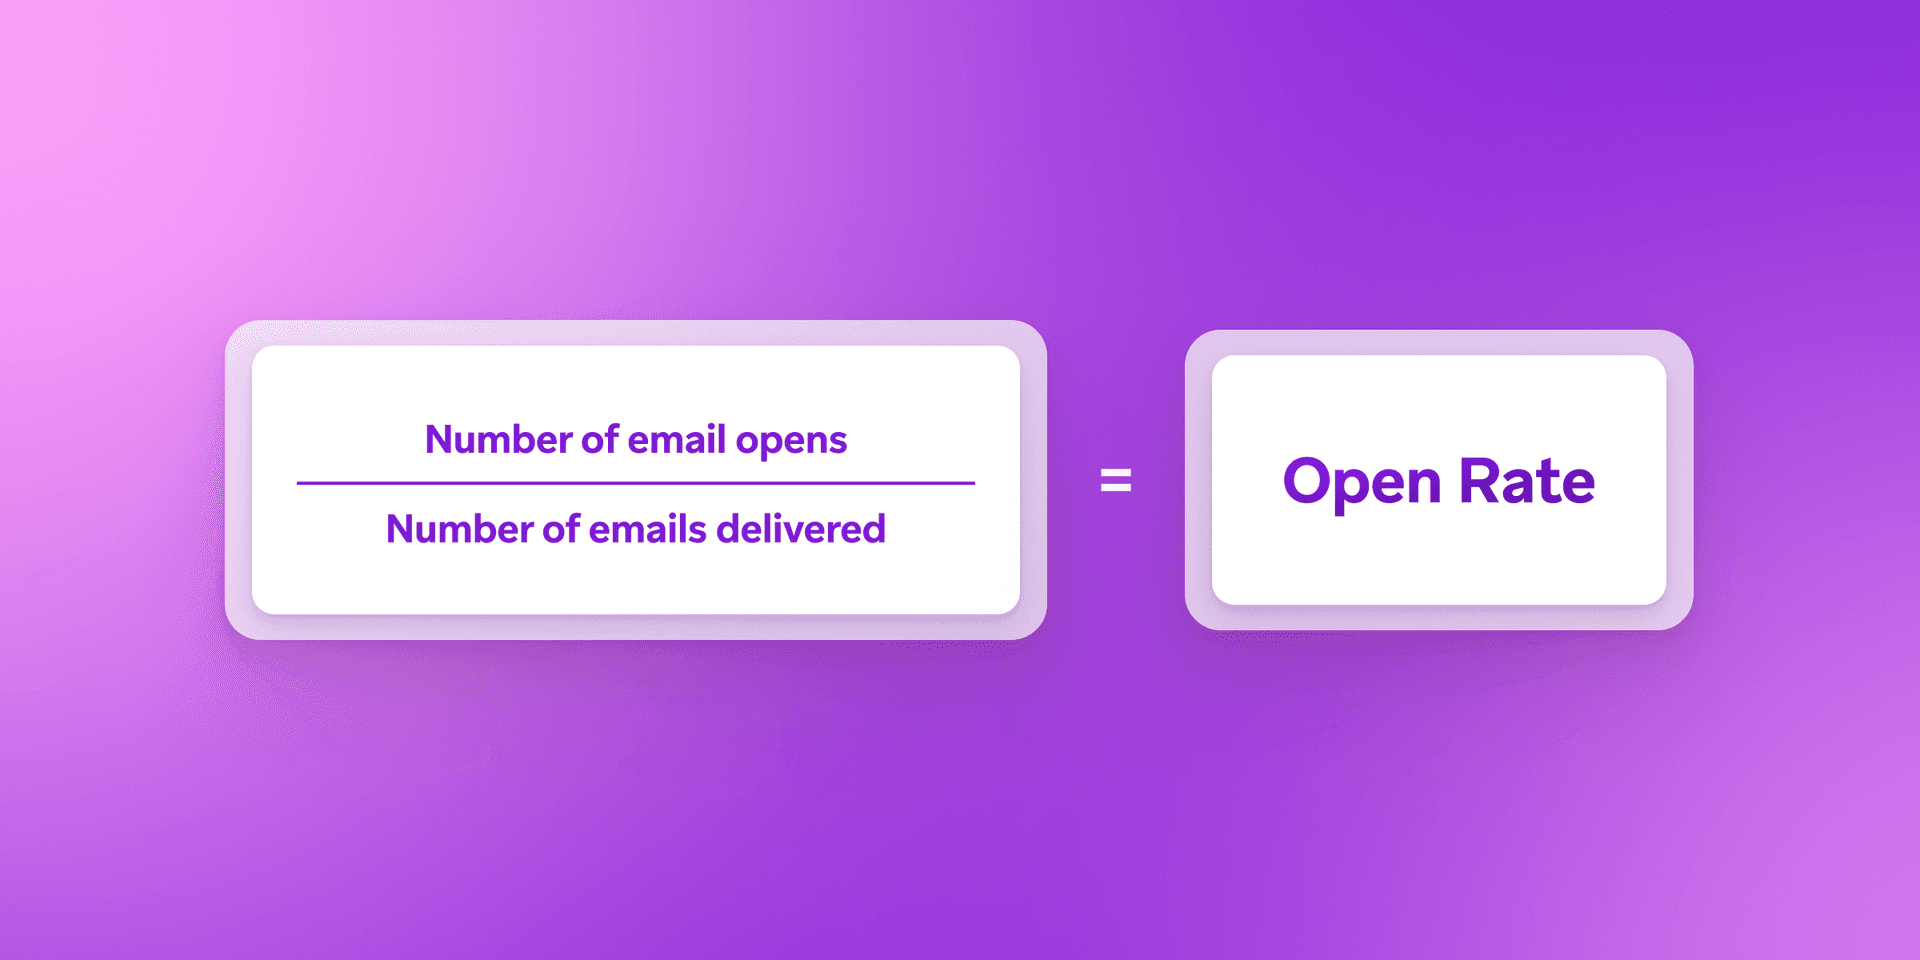
Your email open rate is the total number of email opens your messages receive, divided by the number of emails delivered. The open rate should give you a good sense of your audience’s overall audience engagement, including repeat email openers and other outliers.
2. Click rate
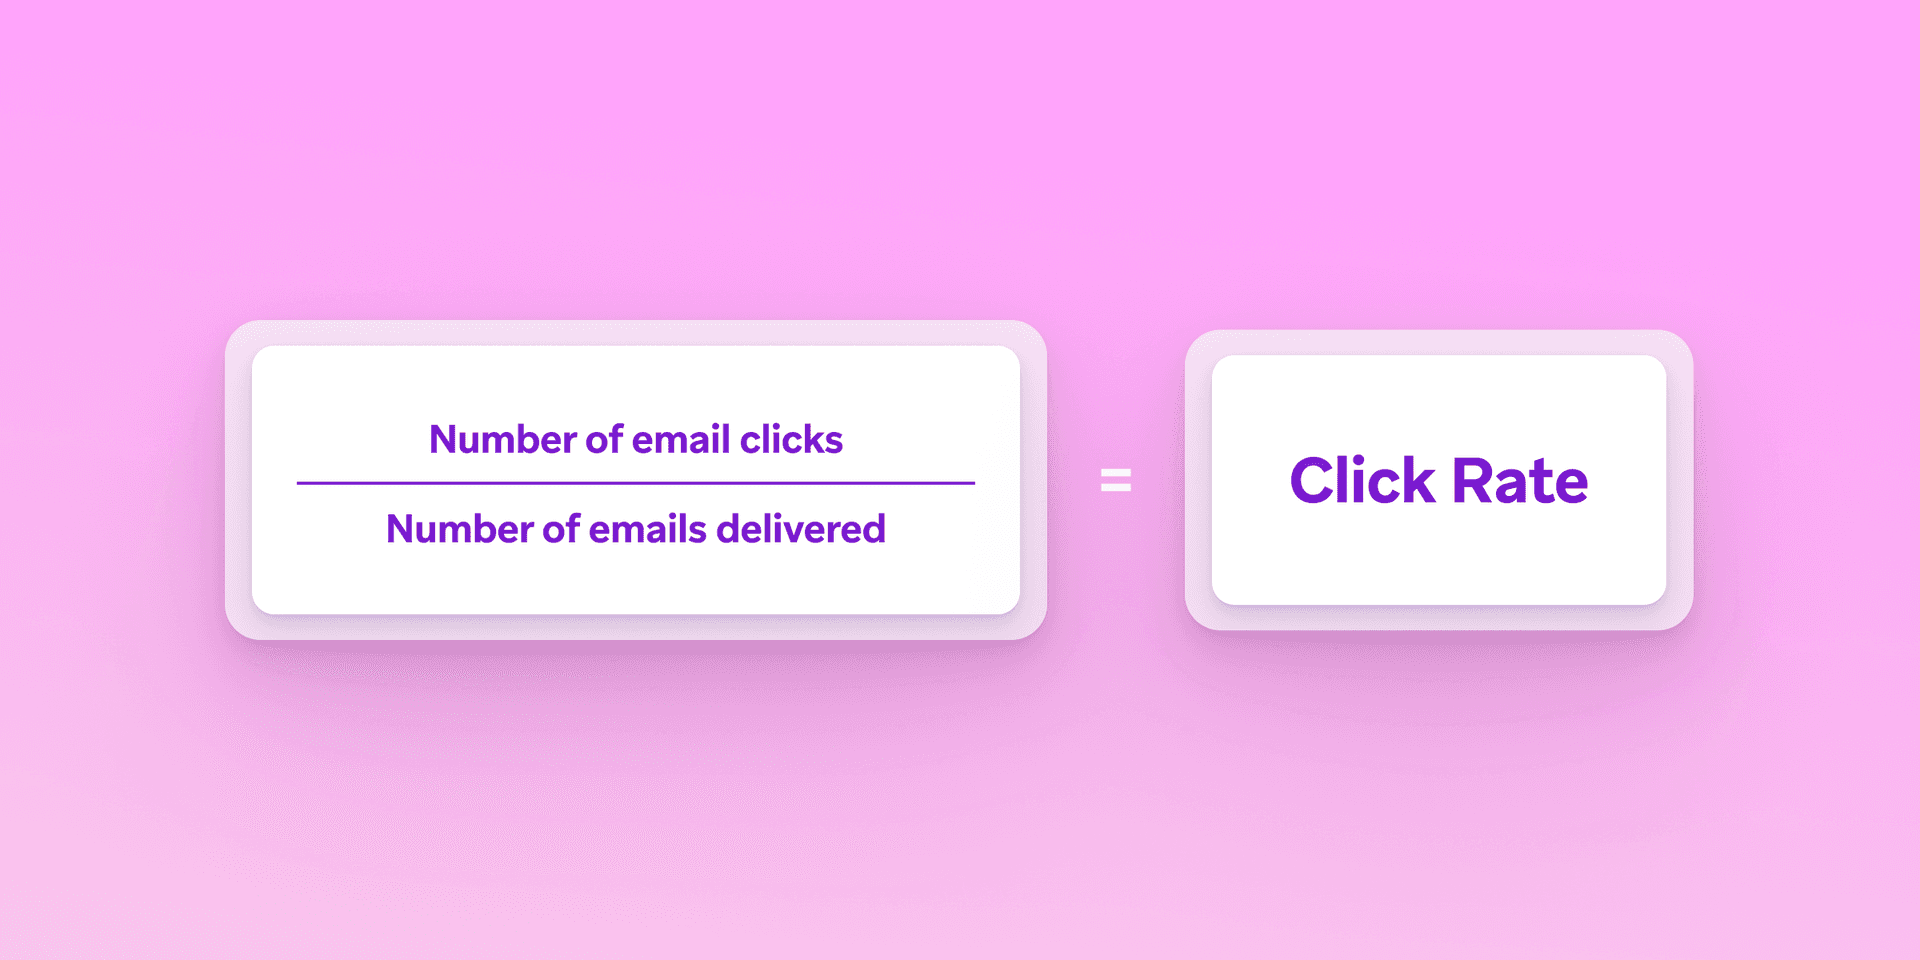
Your email click rate is the total number of clicks your emails receive, divided by the total number of emails delivered. Like your open rate, your click rate gives high-level insights into your customers’ engagement with your email program, including customers who come back to an email to re-engage.
3. Unique open rate
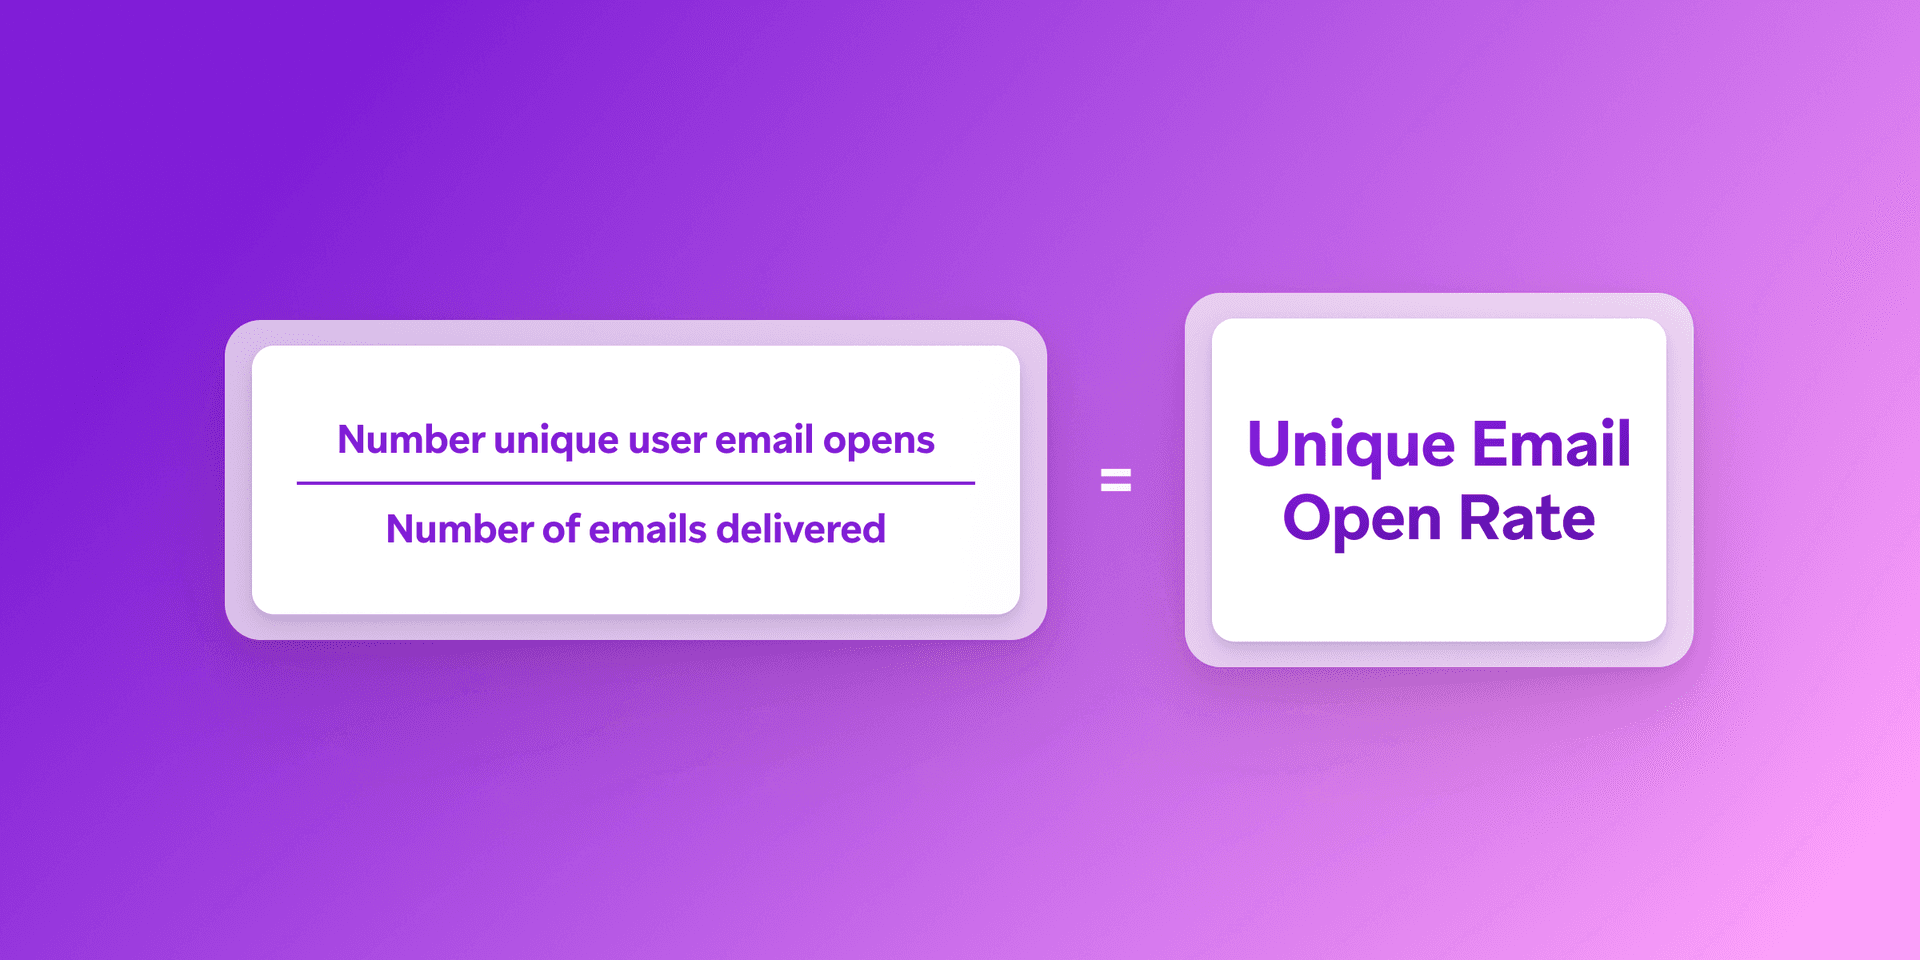
Your unique open rate in a given email campaign is the total number of unique recipient email opens divided by the number of emails delivered in the campaign. That means that if one of your customers opens a given campaign five times, it only counts as one unique open, but five total opens. This metric can help make it clearer how your subject line is performing, since it’s the first piece of content that users see and is instrumental in nudging them to open the email in the first place.
4. Unique click-through rate
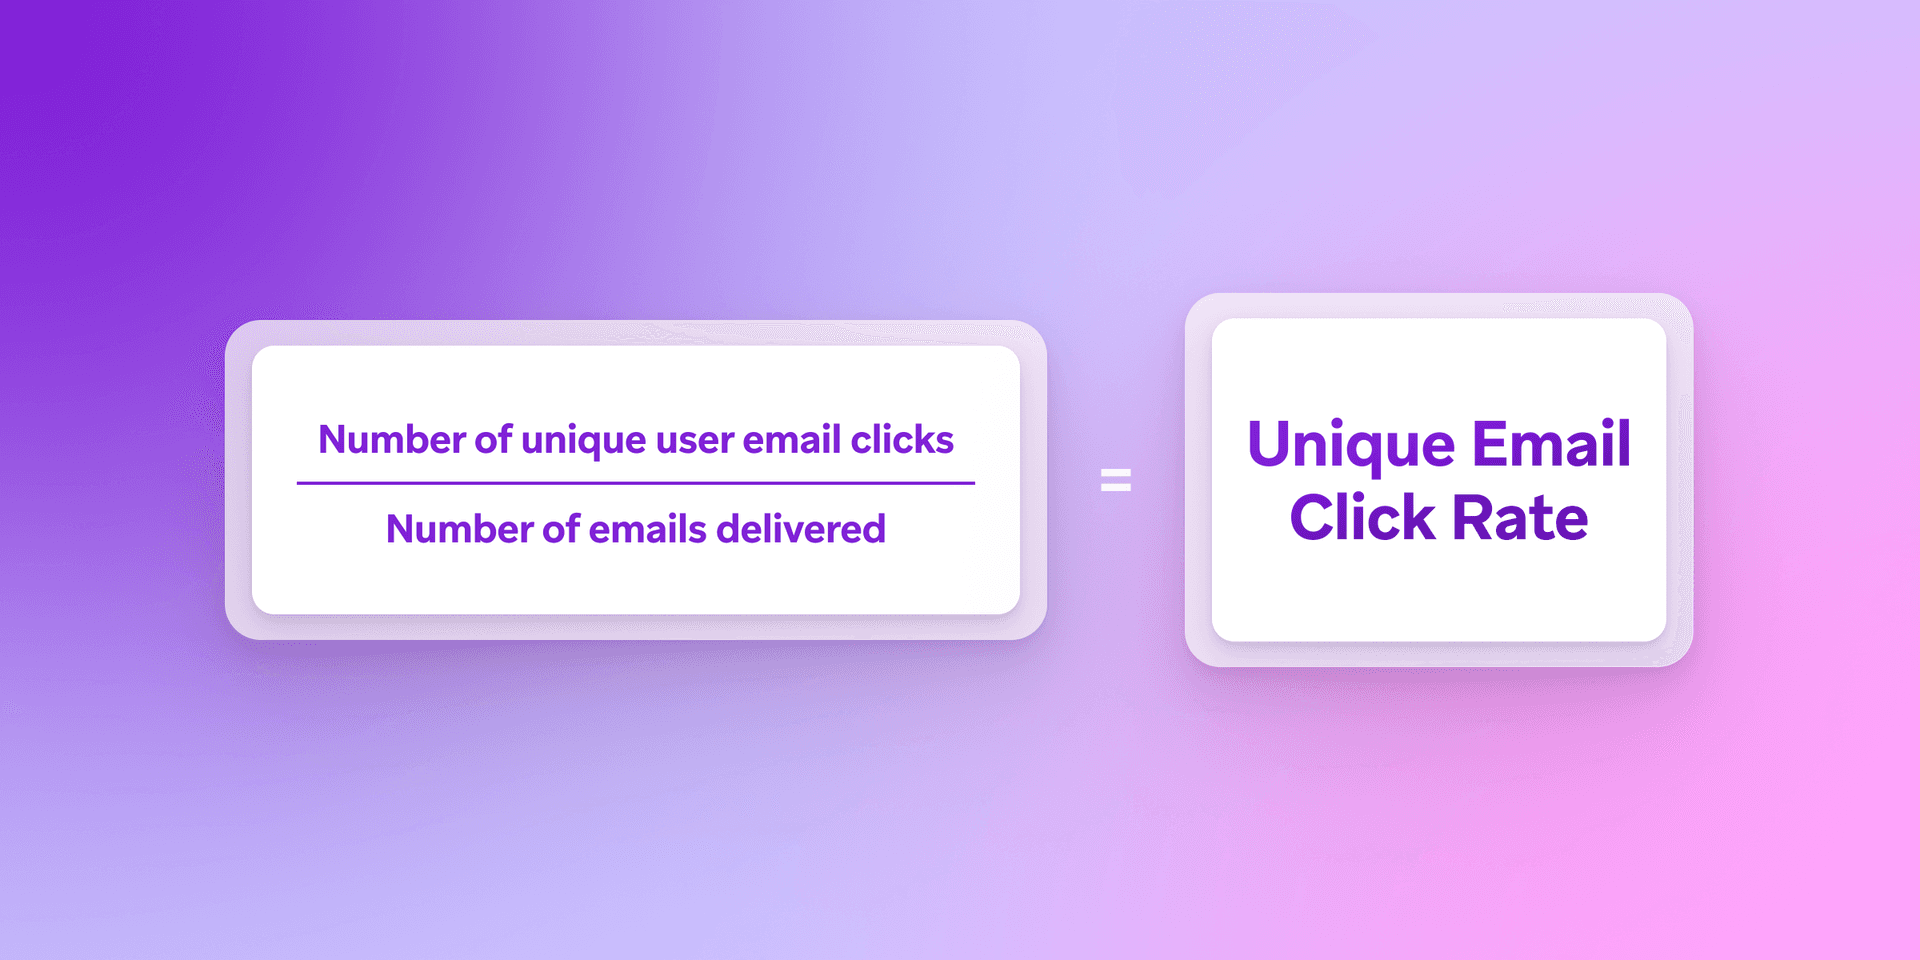
Your unique click-through rate in a given email campaign is the total number of unique recipient email clicks divided by the number of emails delivered in the campaign. That means that if one of your users clicked on all three links in an email you sent, they’d generate three clicks, but only one unique click. In general, a high unique click-through rate is a strong indicator of a clear, powerful call-to-action (CTA), since that’s the primary driver of in-message clicks.
5. Click-to-open rate
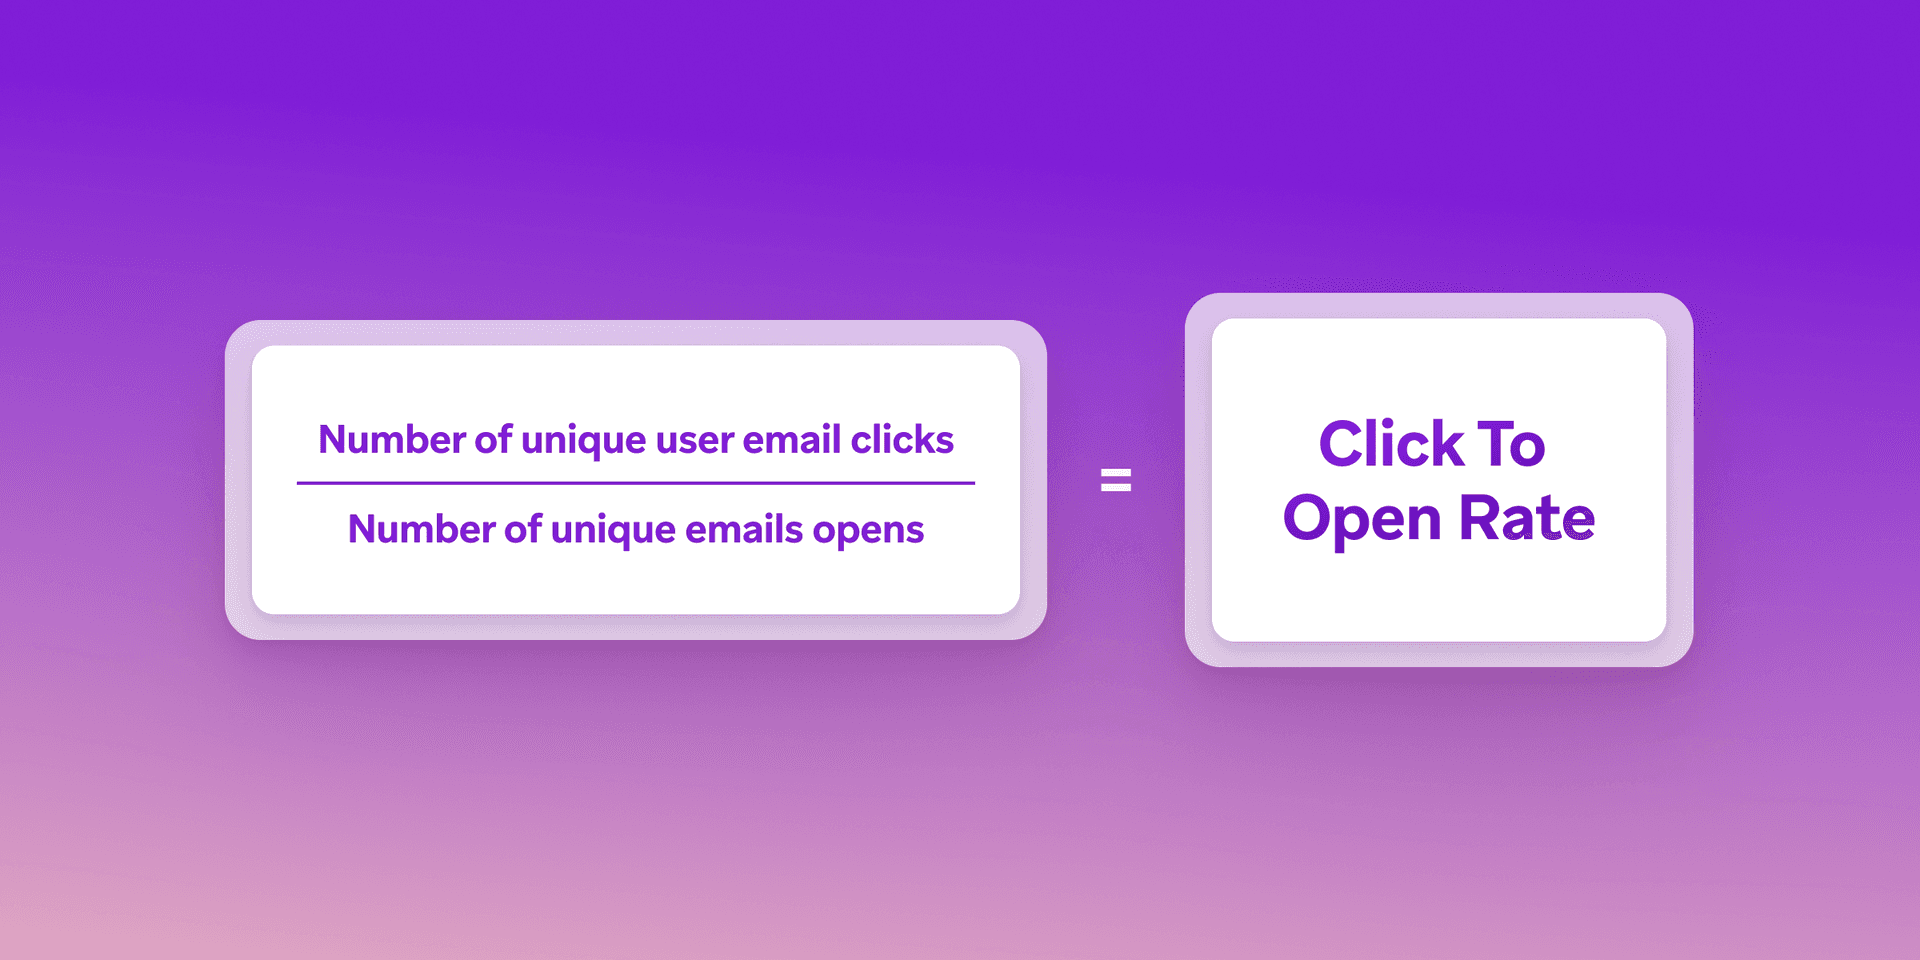
Your click-to-open rate is calculated by dividing the number of unique clicks that your emails received by the number of unique opens. In other words, out of everyone who opened, how many clicked? In general, if the subject line of the email does a good job matching the message’s body and main CTA, you’ll see a stronger click-to-open rate for that campaign.
6. Open rate by domain
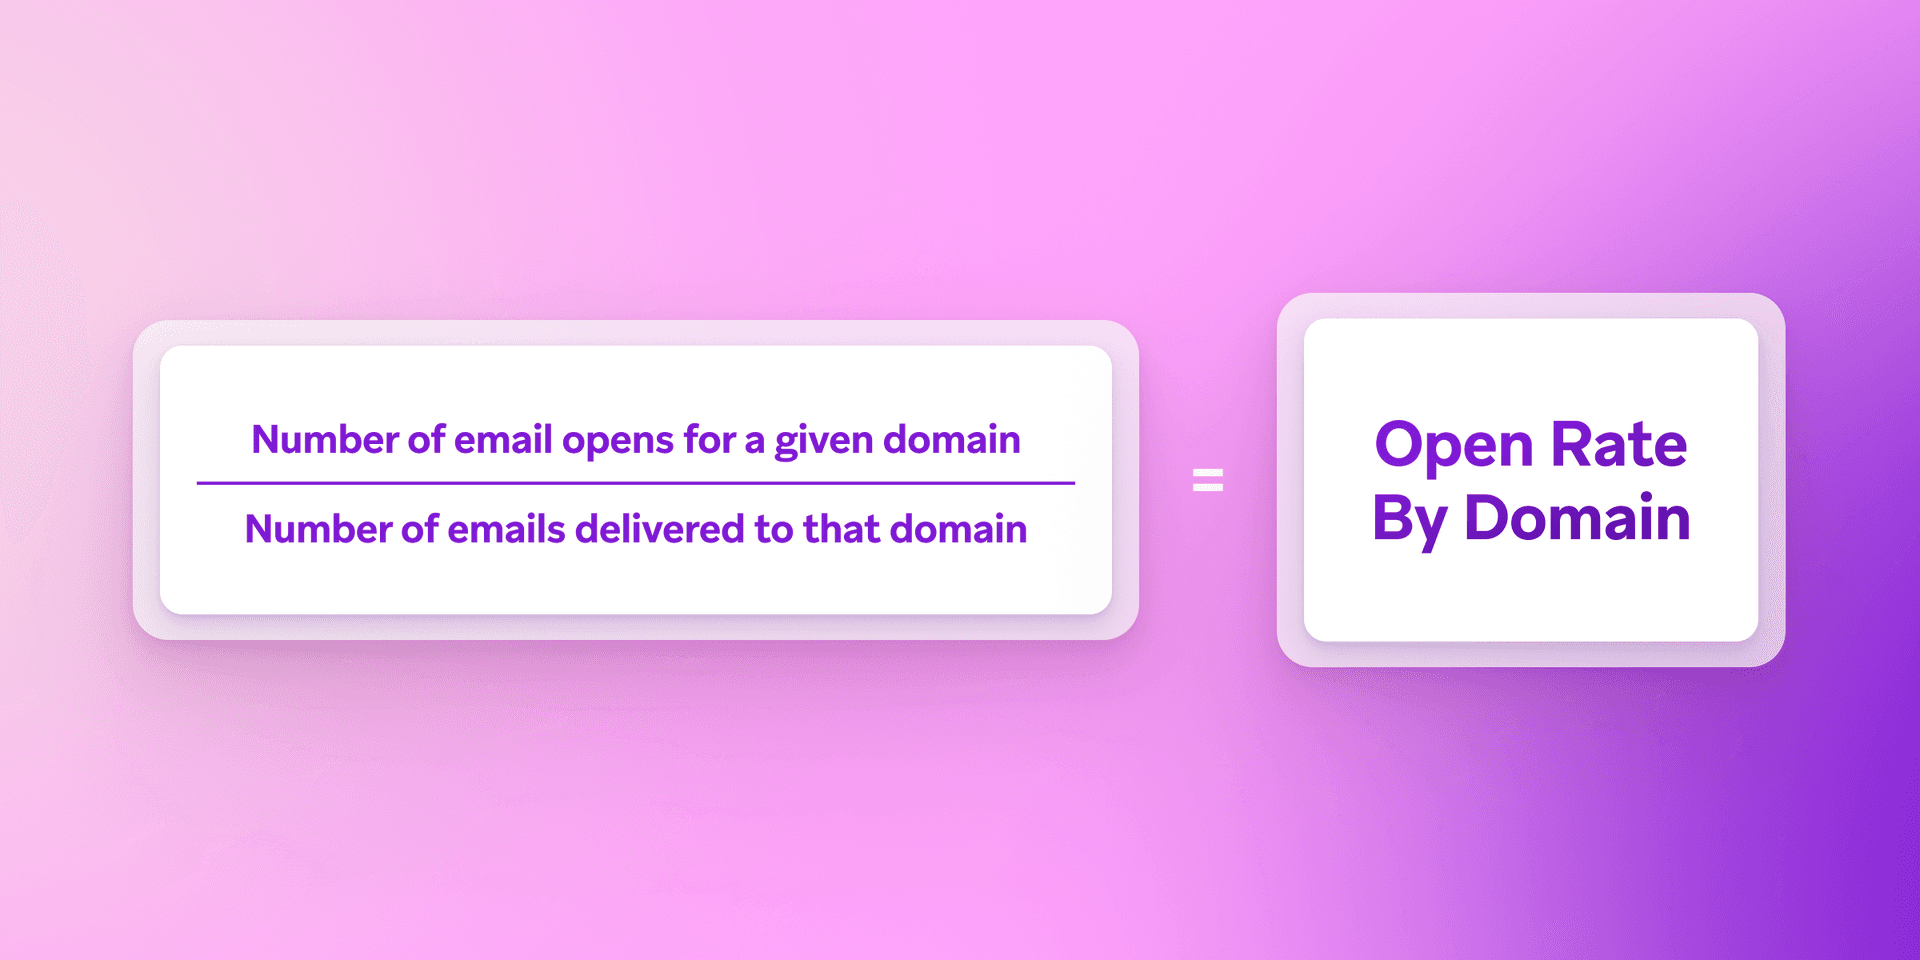
Your open rate by domain is the number of email opens for users on a given domain—think Gmail, Hotmail, Yahoo, etc.—divided by the number of emails delivered to that domain. This metric can be useful if you’re looking to understand how your email campaigns are performing at different ISPs/mailbox providers, and whether you have deliverability issues at a particular domain (Gmail, for instance).
7. Click rate by domain
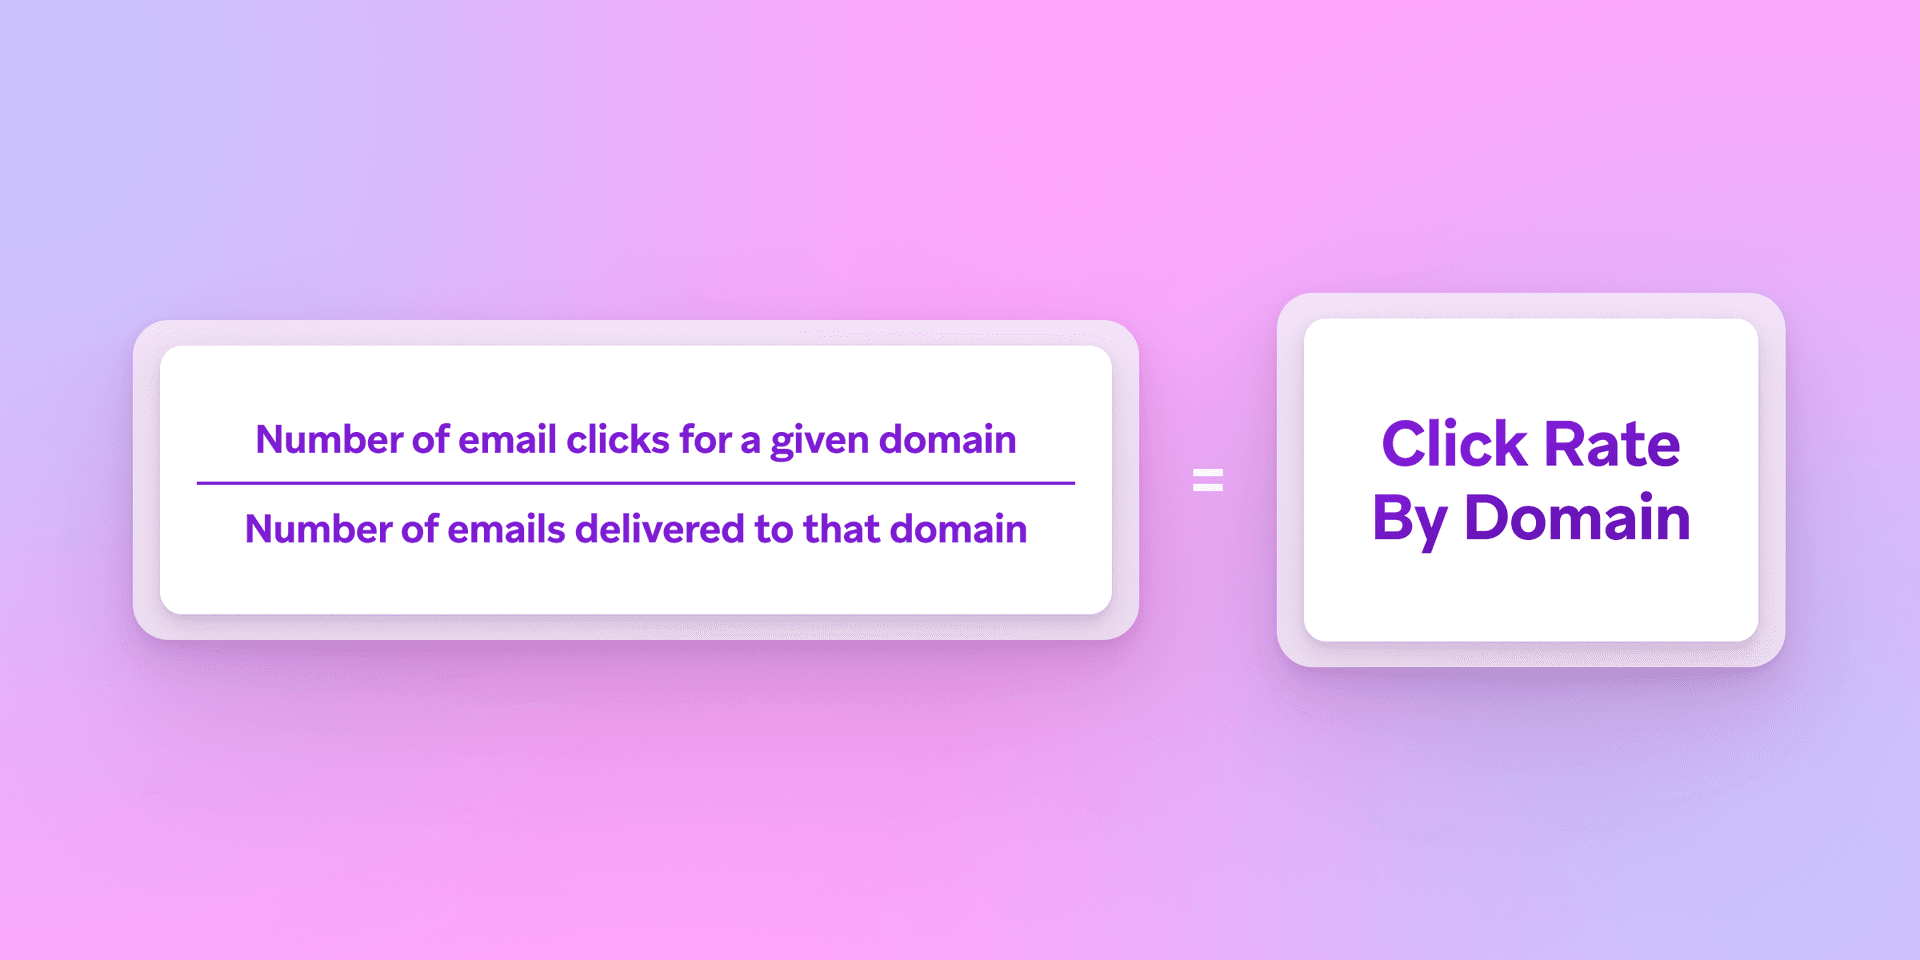
Your click rate by domain is the number of email clicks for users on a given domain—think Gmail, Hotmail, Yahoo, etc.—divided by the number of emails delivered to that domain. This metric can provide clues when your email is being negatively impacted by domain differences in how messages are displayed in users’ inboxes, among other insights.
8. Hard bounce rate
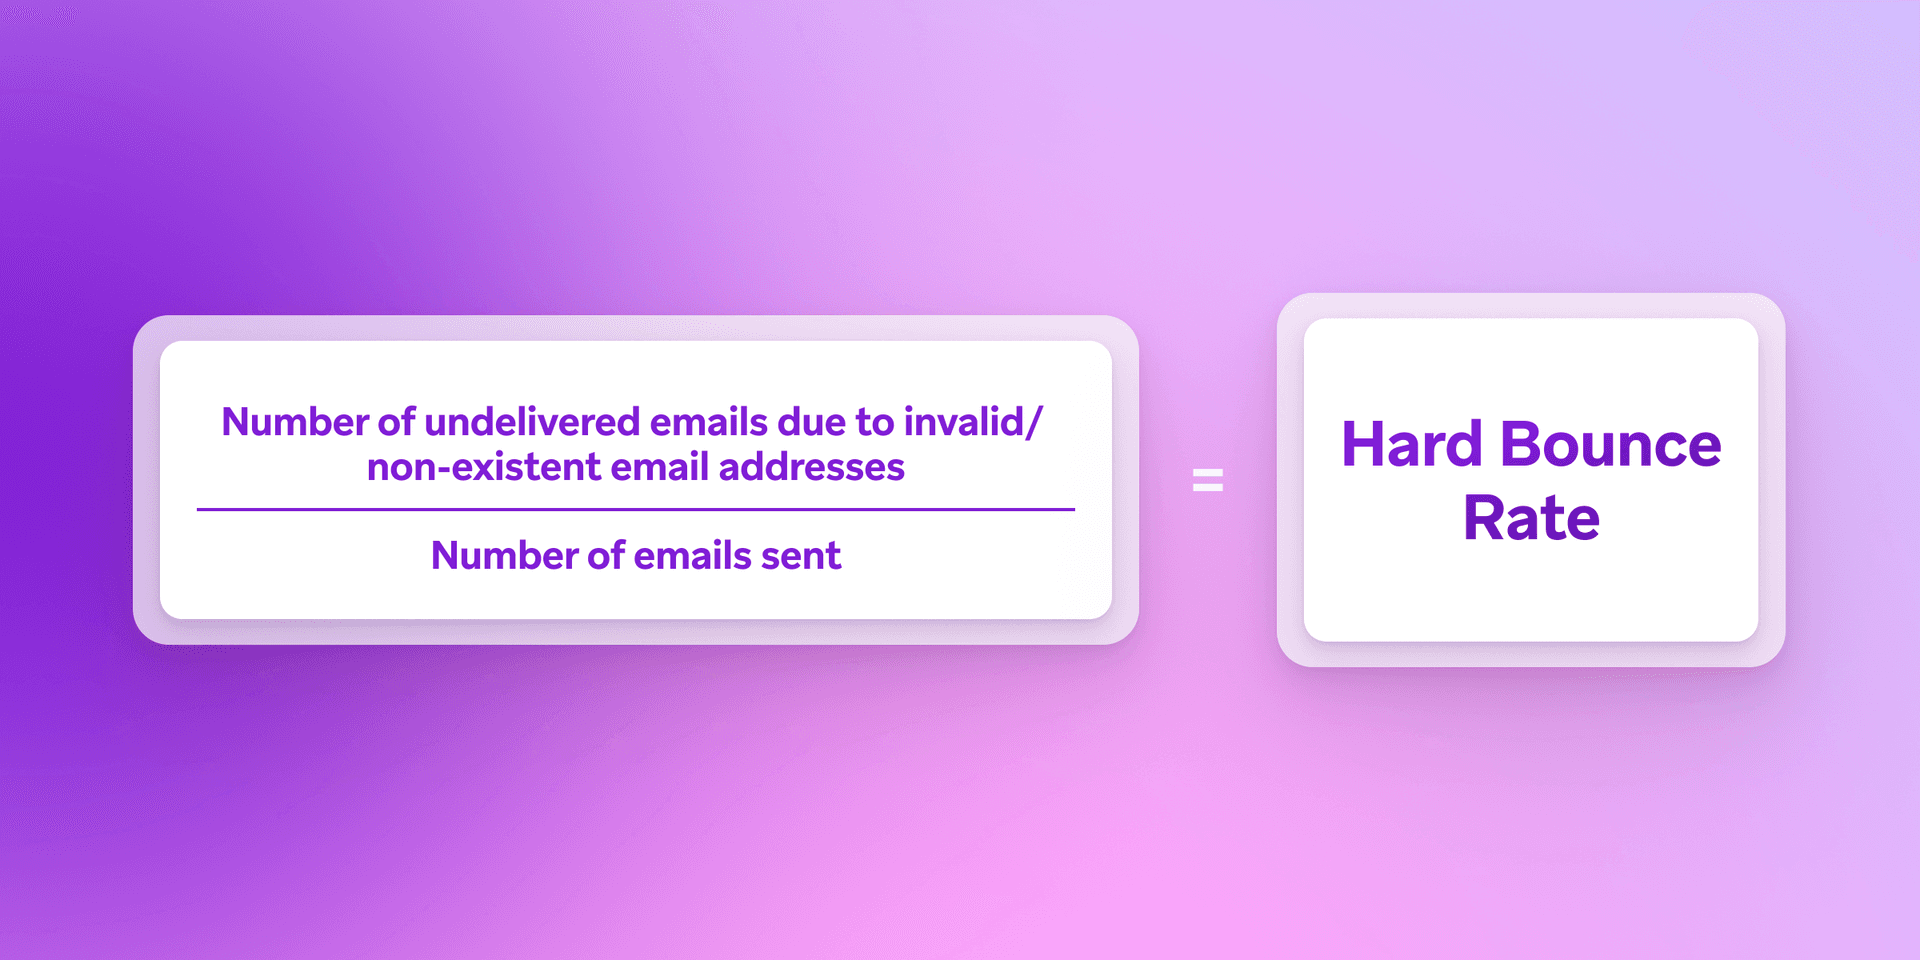
Your hard bounce rate is the number of emails that weren’t delivered due to invalid or nonexistent email addresses divided by the total number of emails sent. Keeping an eye on this metric can give brands insight into how much of their email list is inaccurate or out of date.
9. Spam report rate
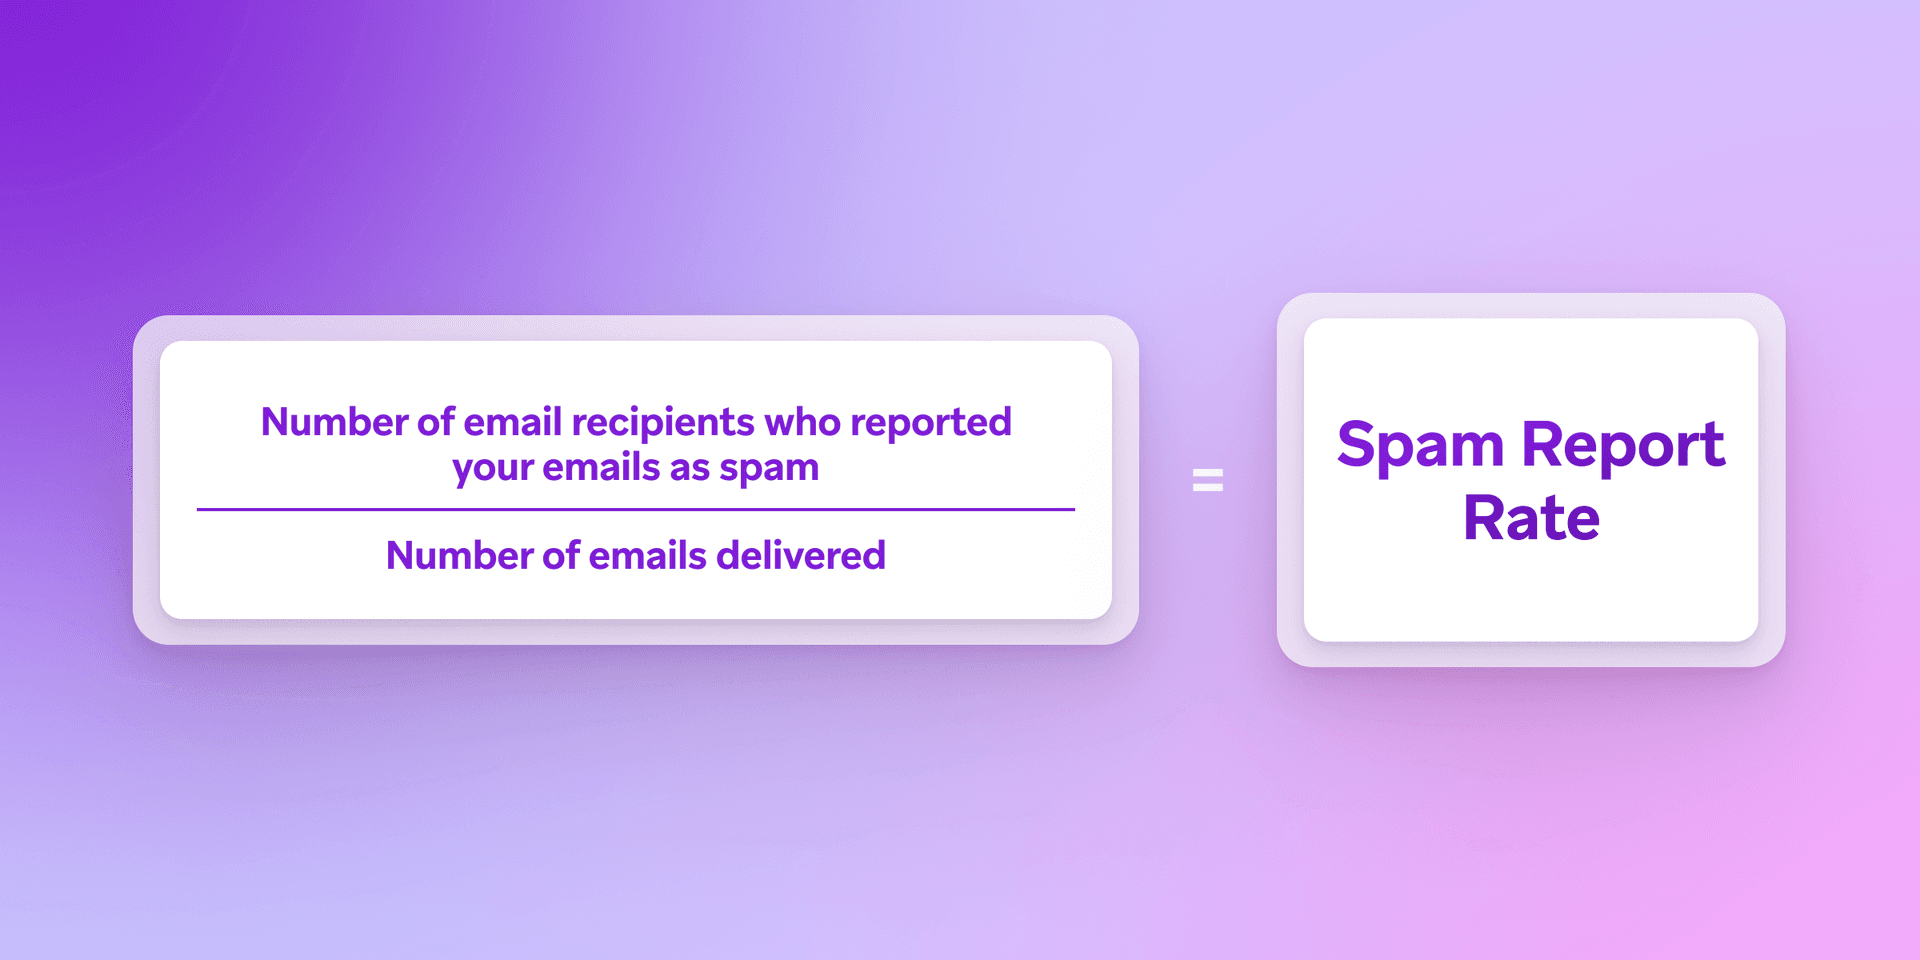
Your spam report rate is the number of email recipients who report your emails as spam divided by the number of emails you delivered. This metric can do a lot to highlight potential issues with your email and to identify campaigns that may be driving up spam reports.
10. Unsubscribe rate
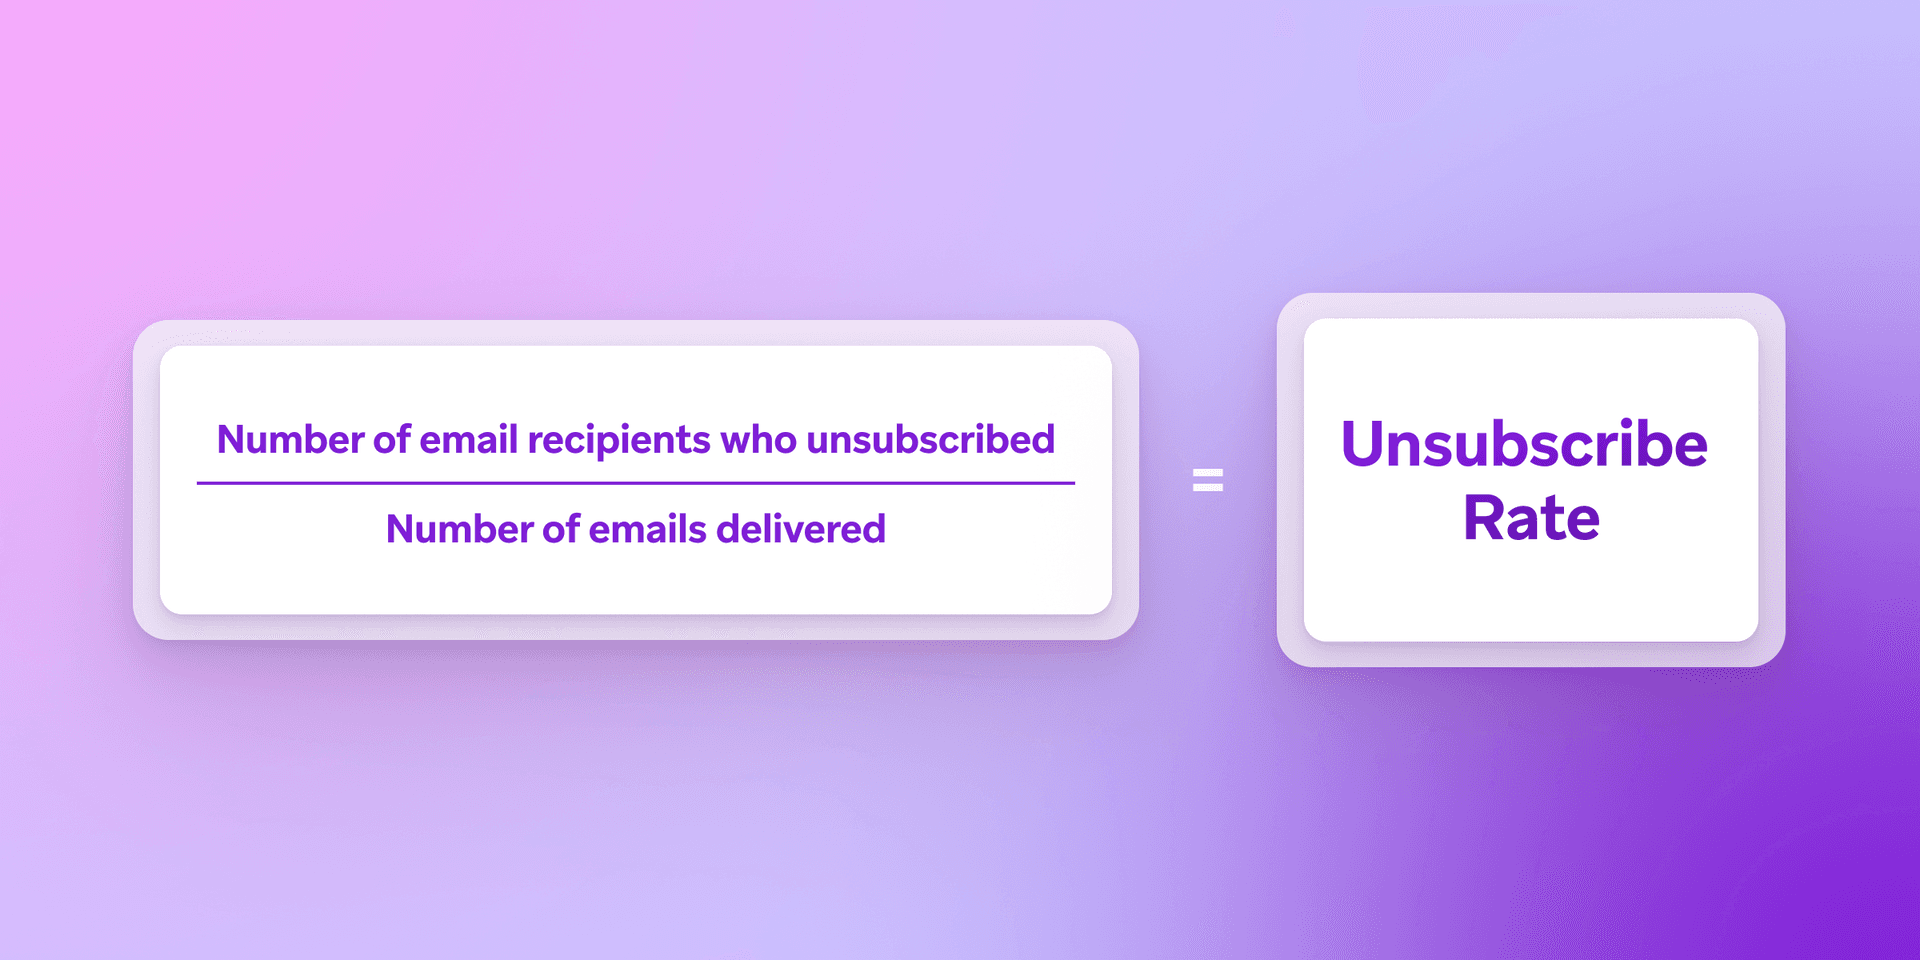
Your unsubscribe rate is the number of people who unsubscribed from your email list divided by the number of emails delivered. As with your spam report rate, this metric can help brands better understand what campaigns are negatively impacting your email list size, making it easier to optimize future outreach.
Email performance KPIs that go deeper
The foundational metrics give you a pulse check, but if you want to drive real performance, you need to go further. These additional email performance KPIs help connect engagement data to broader goals like conversion, retention, and ROI. They’re especially valuable for teams running high-volume campaigns or looking to optimize across lifecycle stages
Conversion rate
What it is: The percentage of recipients who took a desired action after clicking your email (e.g., purchase, sign-up, booking).Why it matters: This is where engagement becomes outcome. Conversion rate is one of the clearest indicators of campaign effectiveness.Use it for: Measuring how well your messaging drives real business results, especially in acquisition or monetization campaigns.
Soft bounce rate
What it is: Emails that weren’t delivered due to temporary issues (like a full inbox or server delay), divided by total sent.Why it matters: Soft bounces don’t hurt your sender reputation immediately, but patterns can reveal systemic delivery problems.Use it for: Flagging technical issues and improving long-term deliverability.
Email complaint rate
What it is: The percentage of recipients who reported your email as spam.Why it matters: Even a small number of complaints can have an impact on inbox placement and sender trust.Use it for: Catching relevance or permission issues early, especially when experimenting with new segments or formats.
Email list growth rate
What it is: [(New subscribers − Unsubscribes) ÷ Total subscribers] x 100Why it matters: This metric captures both acquisition and attrition. Growth is good, but sustainable growth with a healthy unsubscribe rate is better.Use it for: Evaluating whether your acquisition tactics are bringing in the right people—and whether your content is keeping them.
Revenue per email
What it is: Total revenue generated, divided by the number of emails sent.Why it matters: Helps you calculate ROI at the message or campaign level.Use it for: Prioritizing high-value campaigns and spotting underperforming tactics. Particularly useful in eCommerce and travel.
In this webinar, we'll explore tools and tactics leading brands are using to make it easier for them to self-serve, improve their outcomes, and own engagement from the first email to the final report.
Email reporting best practices
Tracking metrics is only the first step. Turning them into decisions is next. The best-performing teams use their metrics to inform timing, targeting, and creative strategy. That begins with making your reporting process smarter.
Align KPIs with campaign goals
Start by defining what success actually looks like. A welcome series might prioritize unique open rate and list growth, while a post-purchase email could be judged by repeat conversion rate or revenue per email. Matching metrics to purpose keeps your reporting focused and your insights relevant.
Segment your reporting
Averages can be misleading. A 30% open rate might look strong—until you realize one audience segment is underperforming by half. Break your reports down by cohort, behavior, or campaign type to help spot opportunities and surface friction points faster.
Track by lifecycle stage
Customers don’t often want the same thing at the same time—and your reporting should reflect that. Segmenting metrics by lifecycle stage helps you identify where people are dropping off and where to double down.
Use A/B testing to validate changes
Don’t just assume a new CTA or design will perform better—test it. A/B testing helps you isolate variables and make data-backed adjustments to your strategy. Even small lifts can compound over time.
Keep reporting connected
Metrics are most powerful when they lead to action. That’s why it’s important to use a reporting setup fueled by your segmentation, campaign triggers, and testing tools. When insights flow into your execution tools, you can act faster and optimize in real time.
How CRM and lifecycle teams can improve email performance
For CRM and lifecycle marketers, email performance is a feedback loop that shapes targeting, messaging, and timing, with different metrics that matter at each stage. Acquisition efforts often lean on open rates, click-through rates, and list growth, while retention work benefits more from unsubscribe rates, CTOR, conversions, and revenue per email.
But tracking the right data is only part of the equation. That data also needs to be accessible. When reporting lives in a silo—or requires manual wrangling to make sense—teams can’t respond quickly. Building dashboards or shared reports that reflect real-time metrics makes it easier for campaign owners, creatives, and channel leads to course-correct for the wins.
Real-world wins: Better metrics, better outcomes
These brands collected metrics and then used them to shape smarter campaigns. Here’s how a focus on the right data helped them improve retention, boost conversions, and build stronger connections.
Mercari lists smarter metrics for a 70% GMV boost
Mercari, launched in Japan in 2013, is a community-powered marketplace app designed to simplify the process of selling items. Expanding to the US in 2014, Mercari aimed to make selling as straightforward as buying, targeting American consumers looking to declutter and embrace resale.
The challenge
In a competitive U.S. market saturated with buying options, Mercari needed to differentiate itself by enhancing the seller experience. The goal was to streamline the selling process and engage users effectively to increase listings and transactions.
The strategy
Mercari partnered with Braze to leverage a customer engagement platform capable of delivering personalized, targeted messaging at scale. This collaboration focused on understanding user behavior to drive meaningful interactions and encourage more listings.
The results
Over nearly three years, Mercari's use of Braze contributed to growth in the US market.
- Achieved a 70% year-over-year increase in US gross merchandise volume (GMV).
- Reached 2 million monthly active users in the US
- Surpassed 45 million app downloads in the US, with over 150,000 new listings posted daily.
Following these successes, Mercari expanded its use of Braze to Japan, aiming to replicate the improved customer experience and increased lifetime value observed in the U.S. market.
Peacock personalizes the spotlight for a 20% drop in churn
Peacock is a leading streaming service from NBCUniversal, offering everything from original series to live sports and next-day network TV. As competition in the streaming space grows, Peacock focuses on deepening user loyalty and encouraging upgrades from free to paid subscriptions.
The challenge
Peacock was looking for a way to celebrate individual subscribers’ viewing milestones, encourage free users to convert, and generate excitement for the year ahead. They wanted to build stronger relationships that would increase subscription rates and reduce unsubscribes.
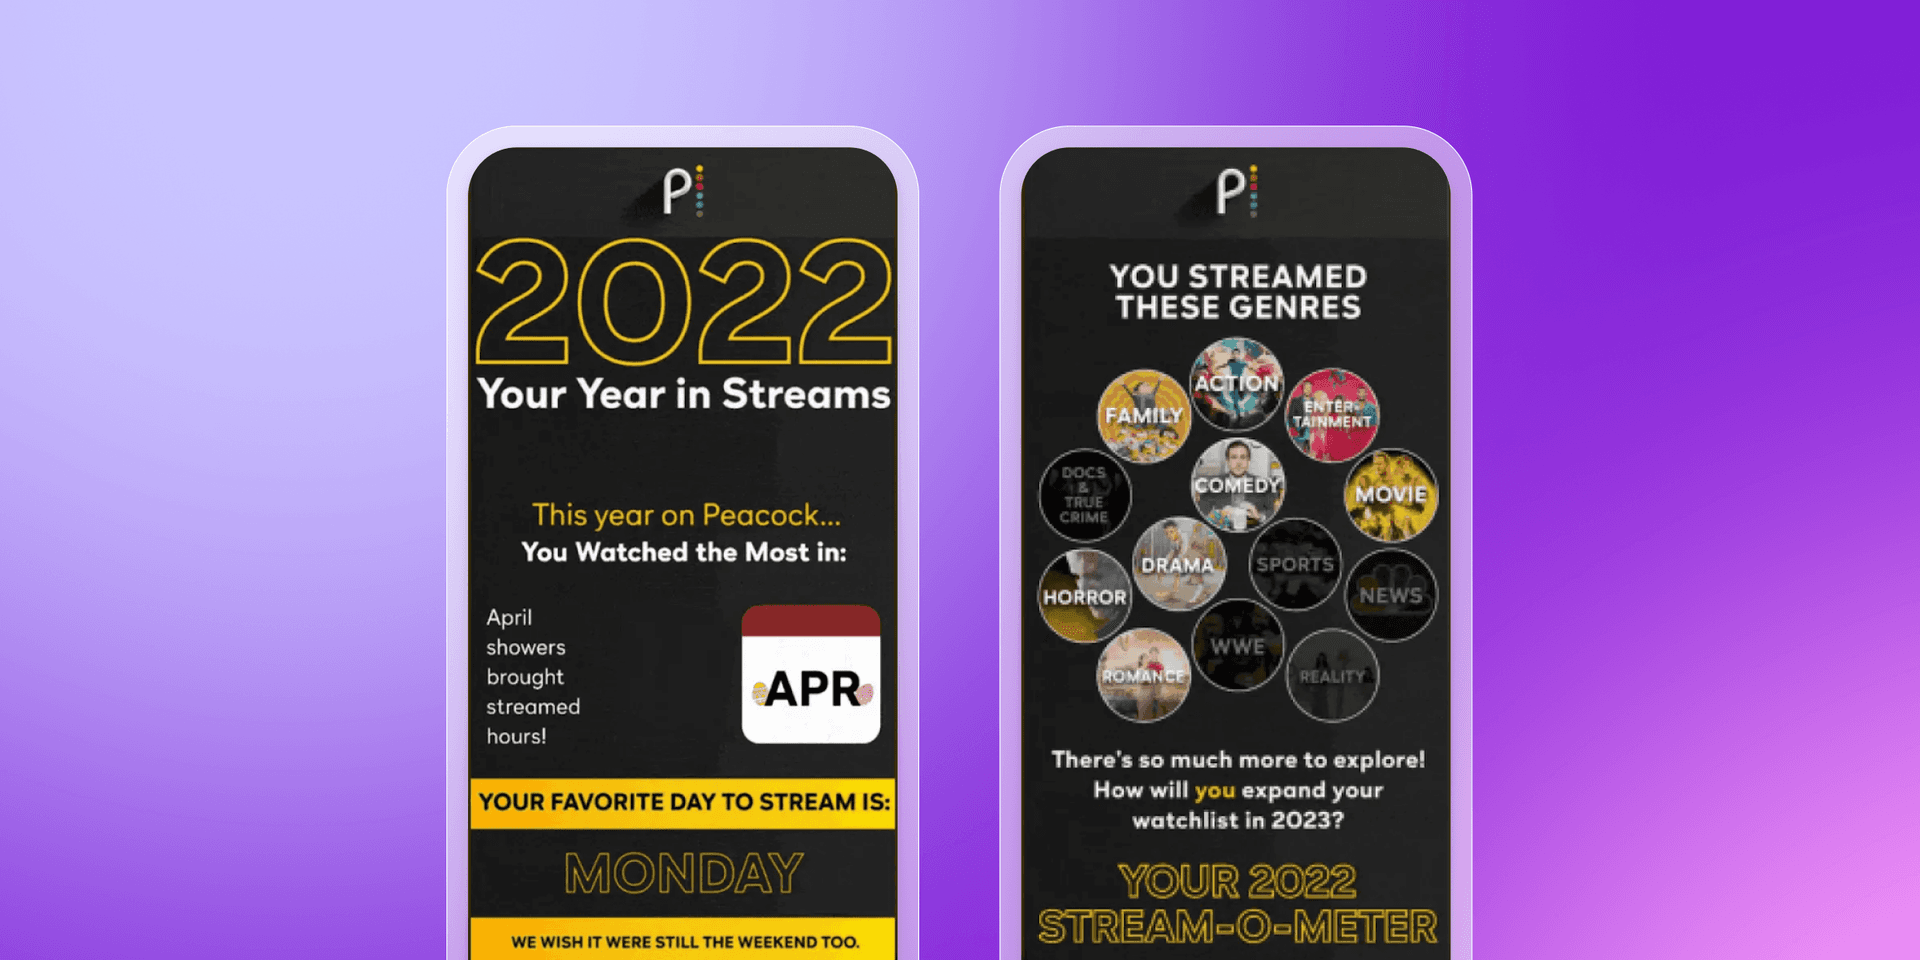
The strategy
Working with Braze and Braze Alloys partners mParticle and Movable Ink, the team launched a personalized year-in-review campaign. Using real viewing data, each message highlighted users’ favorite genres, engagement habits, and total content consumed—delivered across email and in-app channels.
The results
Peacock measured the campaign’s impact by comparing engaged recipients with a control group. The data told a clear story:
- 20% decrease in churn rate over 30 days
- 6% increase in upgrades from free to paid subscriptions
- 2-point lift in return-to-view content rate
By tapping into personal viewing behavior, Peacock turned engagement metrics into meaningful moments—and measurable business outcomes.
Final thoughts
Email marketing has never been short on data, but the real advantage lies in knowing which metrics deserve your attention. Tracking opens and clicks is still useful, but if you're aiming for sustainable engagement, conversions, and retention, you need to go deeper.
By focusing on meaningful KPIs tied to lifecycle goals and building reporting habits that support action, not just analysis, CRM and lifecycle teams can create campaigns that learn and improve over time. Messaging reaches inboxes, resonates, drives outcomes, and builds stronger customer relationships.
And when you're ready to turn insight into action, platforms like Braze can help. From real-time dashboards to journey analytics and custom reporting tools, Braze makes it easier to track the metrics that matter and move faster on what they’re telling you.
Email metrics FAQs
What is a good open rate for email marketing?
A good unique open rate typically falls between 30% and 40%, though results vary by industry and audience. Apple MPP has made open rates less reliable, so it's wise to pair this metric with click-through and conversion data.
How is click-through rate different from click rate?
Click-through rate (CTR) measures the percentage of delivered emails that resulted in at least one click. Click rate may include all clicks—even multiple ones from the same person—so CTR is usually a better gauge of overall engagement.
What email metrics should I track for retention vs. acquisition?
For acquisition, prioritize unique open rate, click-through rate, and list growth. For retention, look at unsubscribe rate, click-to-open rate (CTOR), conversions, and revenue per email to assess long-term value and loyalty.
How do I benchmark my email performance?
Start with industry benchmarks, but the most useful comparisons come from your own segments. Break down performance by campaign type, audience behavior, or lifecycle stage. Use your email platform’s reporting tools to build benchmarks that reflect your unique goals.
Related Tags
Be Absolutely Engaging.™
Sign up for regular updates from Braze.
Related Content
 Article8 min read
Closing deals, driving growth for customers, and the team behind it: Life as an Account Executive at Braze
July 17, 2026 Article12 min read
BrazeAI™ marketing tools: The complete guide to AI-powered customer engagement
July 17, 2026 Article12 min read
AI email marketing: How to use AI to run smarter email programs
July 16, 2026