The Top 3 Ways to Calculate User Retention Rate with Formulas
Published on October 10, 2016/Last edited on October 10, 2016/7 min read


Team Braze
In 1999, NASA’s Mars Climate Orbiter burned up as it entered the Martian atmosphere. The reason? Mismeasurement. Thrust was reported by the software in newtons but interpreted as pounds. Mobile marketing may not be rocket science (though sometimes it may feel that way), but the takeaway is the same: understand what you’re measuring if you want to keep your ship together.
Your customers are the lifeblood of your company so knowing how many customers you have is critical. One key metric for measuring how successful your brand is in keeping customers is retention rate. Just as there are multiple ways to measure thrust on a rocket ship, there are multiple ways to measure retention. Depending on your business model, some ways make more sense than others.
Let’s dig into our three most common (and arguably most useful) retention methodologies. You’ll learn how to calculate retention rates, when and how to use them, and what the strengths and limitations of each are.
The Top 3
The three most popular methods are classic, range, and rolling retention.
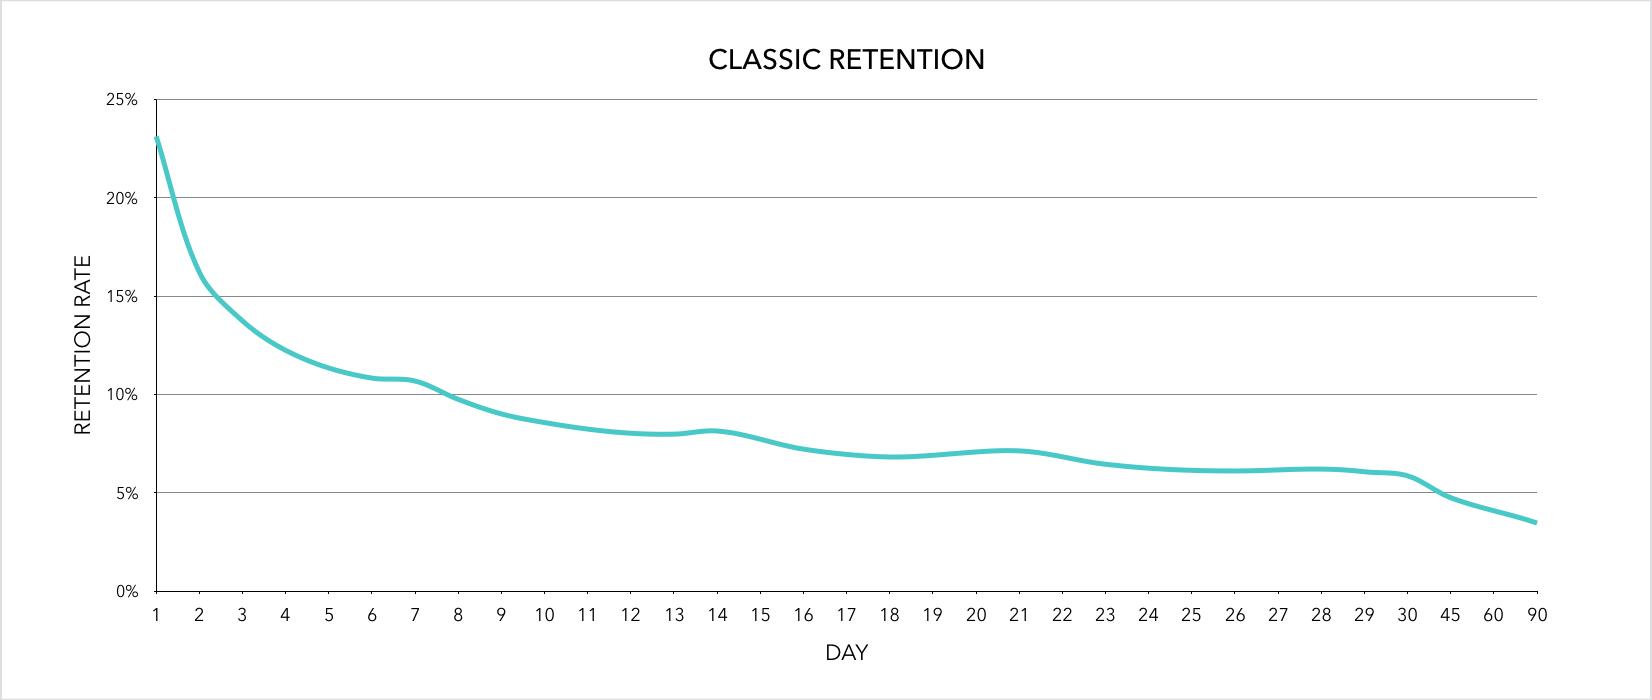
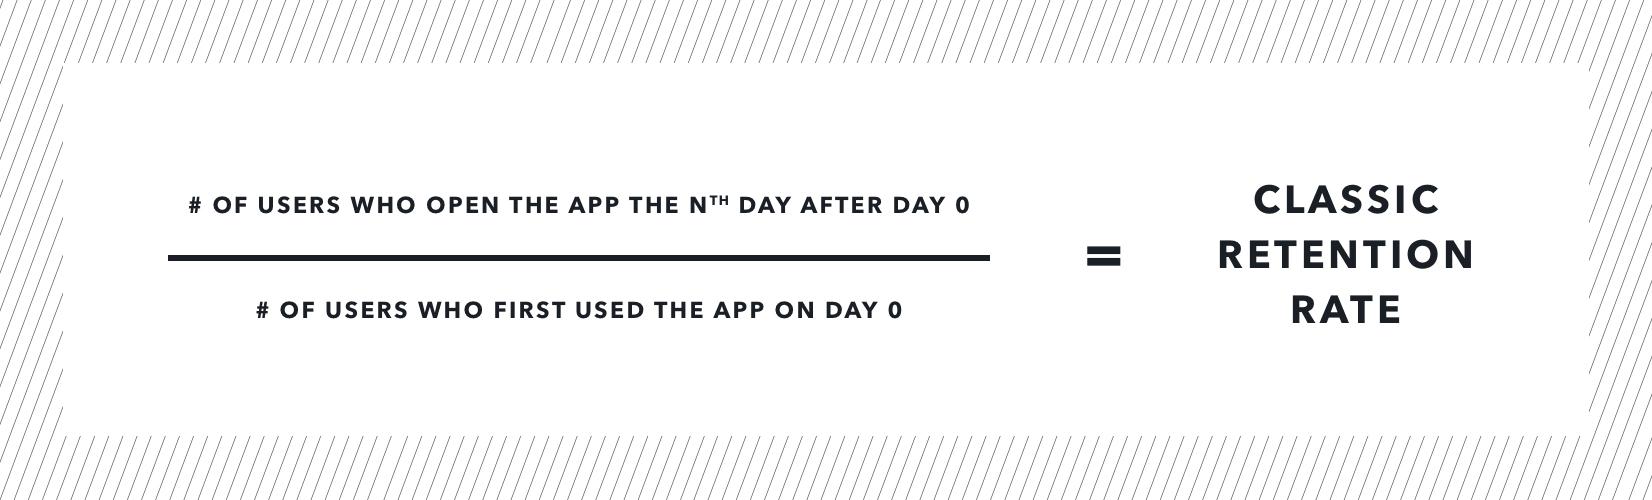
Classic retention, also known as Day N or Retention by Day, is the percent of new users who come back on a specific day.
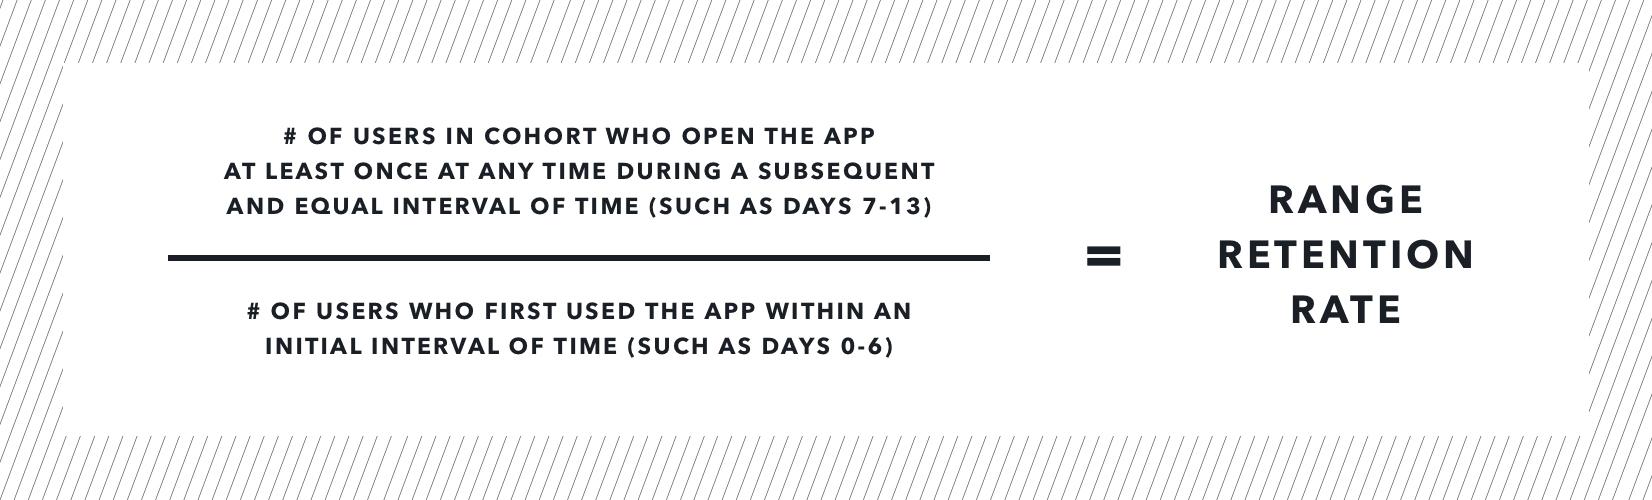
Range retention is similar to classic retention with a measurement period that spans multiple days.
Rolling, or return retention is the percent of new users who return on or after a specific day.
Classic retention
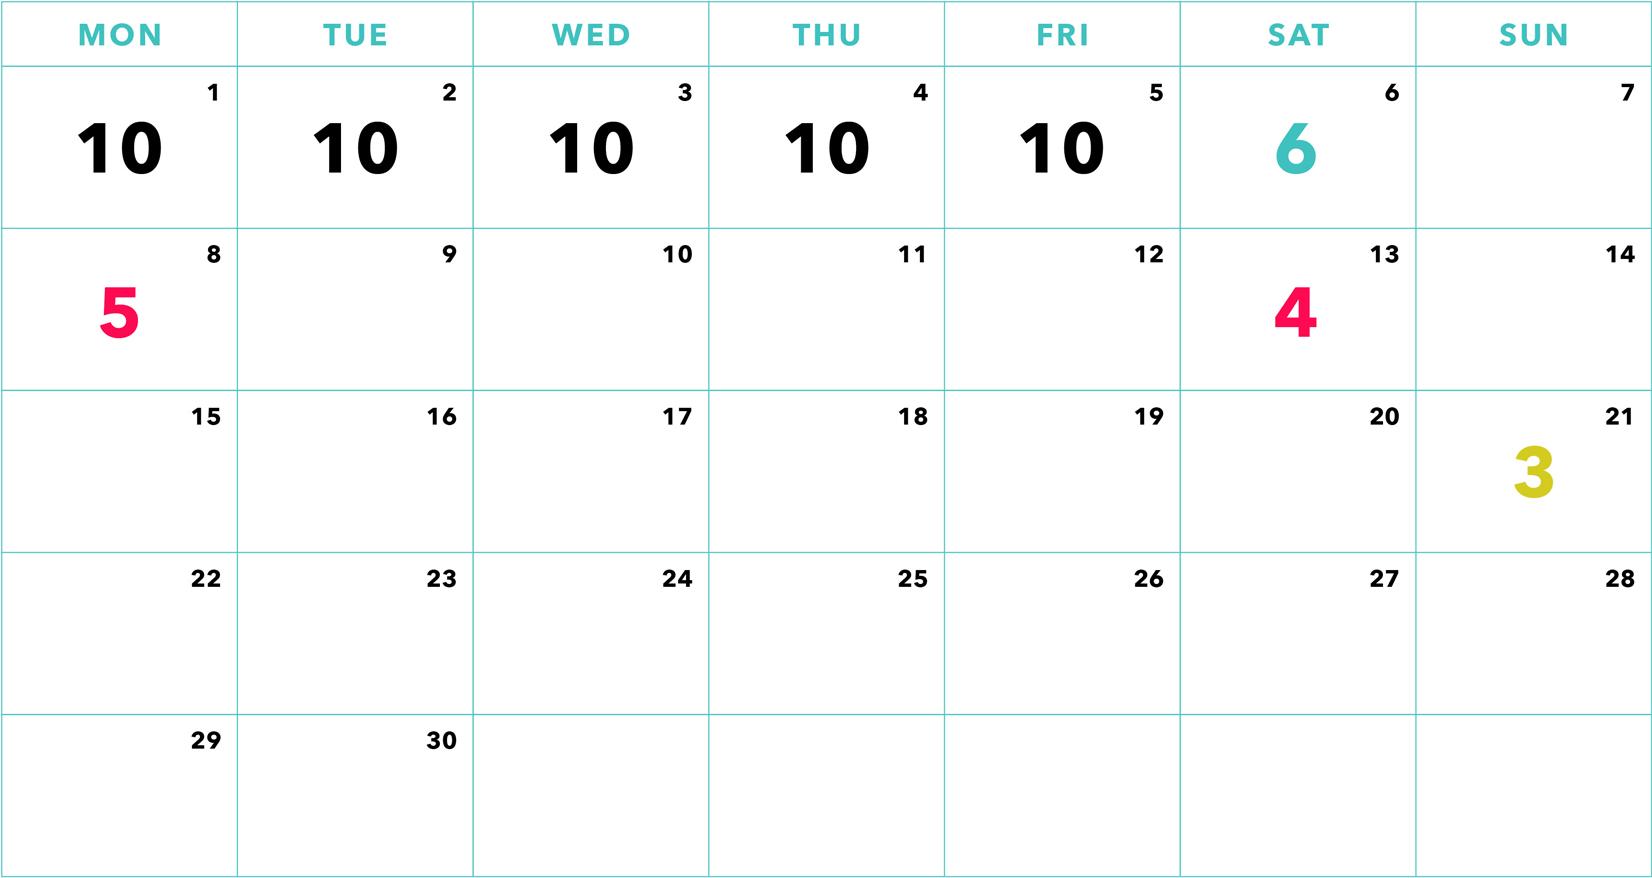
Imagine you have 10 users who first use your app on Monday, the first of the month. Three of those users come back the next day on Tuesday, the second of the month, and two come back the following day on Wednesday, the third of the month. Your Day 1 retention rate is 3/10 or 30%. Your Day 2 retention rate is 2/10 or 20%. If five people were to come back 89 days from Monday the 1st (not shown), your Day 90 retention rate would be 5/10 or 50%.
Note that the two individuals who came back on Day 2 could be all, some, or none of the three that came back on Day 1. That is to say, each day is calculated independently.
Benefits
- Daily granularity
- Easy to explain
- Easy to calculate
Limitations
- Sensitive to noise from whatever may be happening on a specific day
How should I be using this?
If you’re launching a 1-day user acquisition campaign and want to measure the stickiness of those new users acquired through the campaign, Classic Retention is the methodology you should use. If you want to look at overall day-to-day retention rather than retention of a specific day, consider averaging several days together to minimize the daily noise. For example, averaging the last 15 Sundays will give you the average behavior of a new user who first uses the app on a Sunday. Alternatively, averaging every day in a month would give you the average retention rate of new users who first used the app that month.
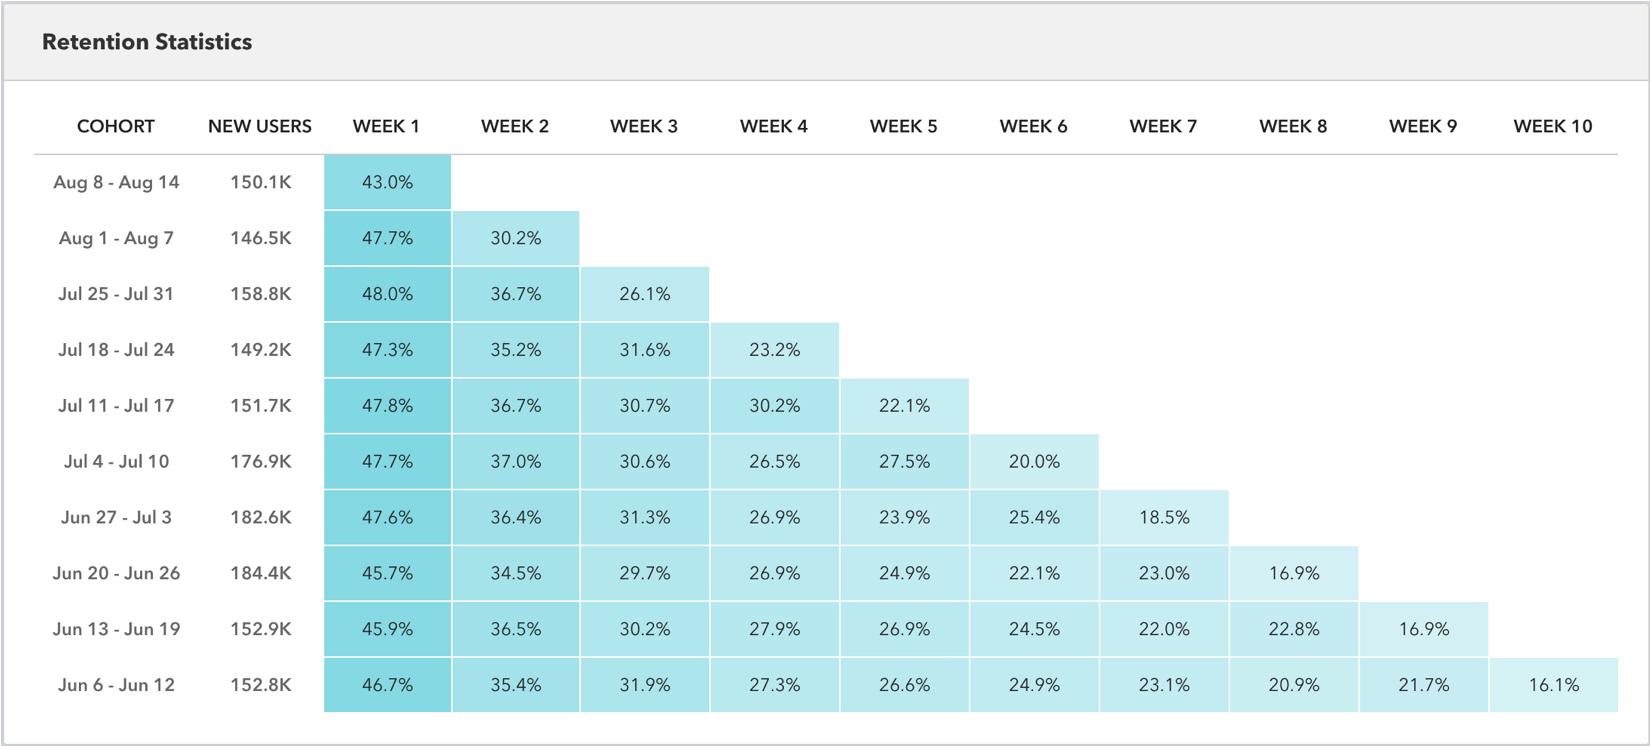
Range retention
While any interval of time can be used, 7-day weekly ranges or 30-day monthly ranges tend to be the most common and intuitive. Let’s look at an example using a 7-day weekly range.
You have 10 new users every day for five days during the first week. On Saturday, the 6th of the month, six users come back. Some time during the subsequent week, nine unique users come back, five on the 8th and four on the 13th. In the third week, three users come back, all on the 21st. The first period retention is 9/50 or 18%. The second period retention is 3/50 or 6%.
The activity from the six visitors on the 6th is not counted because we’re looking at 7-day blocks of time and all activity in the first seven days are lumped together as the initial activity. For the same reason we wouldn’t count multiple interactions on the first day under classic retention methodology, we don’t count multiple interactions in the first week under a weekly range methodology. The concept is identical if we used a 30-day monthly range.
Benefits
- Smooths out some of the day-to-day noise
- Easy to explain
- Good for looking at trends or patterns over a longer period of time
Limitations
- Weekly granularity means you don’t know if the activity is occurring at the beginning or end of the range
- Longer lag time since you have to wait multiples of your date range for results
How should I be using this?
We suggest using this approach to monitor the health of your business at a high level. Think through the range that makes the most sense for your business model and user base. Use a 7-day range when you know there’s a weekly behavior pattern, such as with food delivery or TV shows. Use a 30-day range when you know there are monthly behavior patterns, like bill paying.
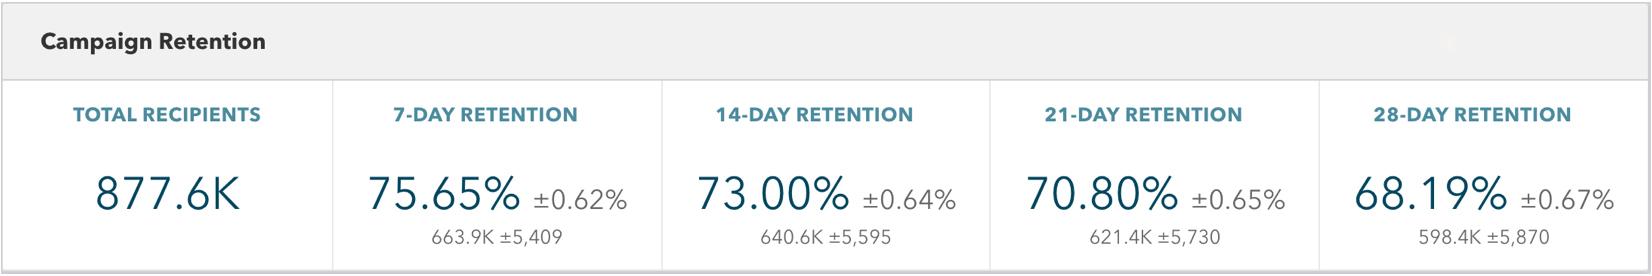
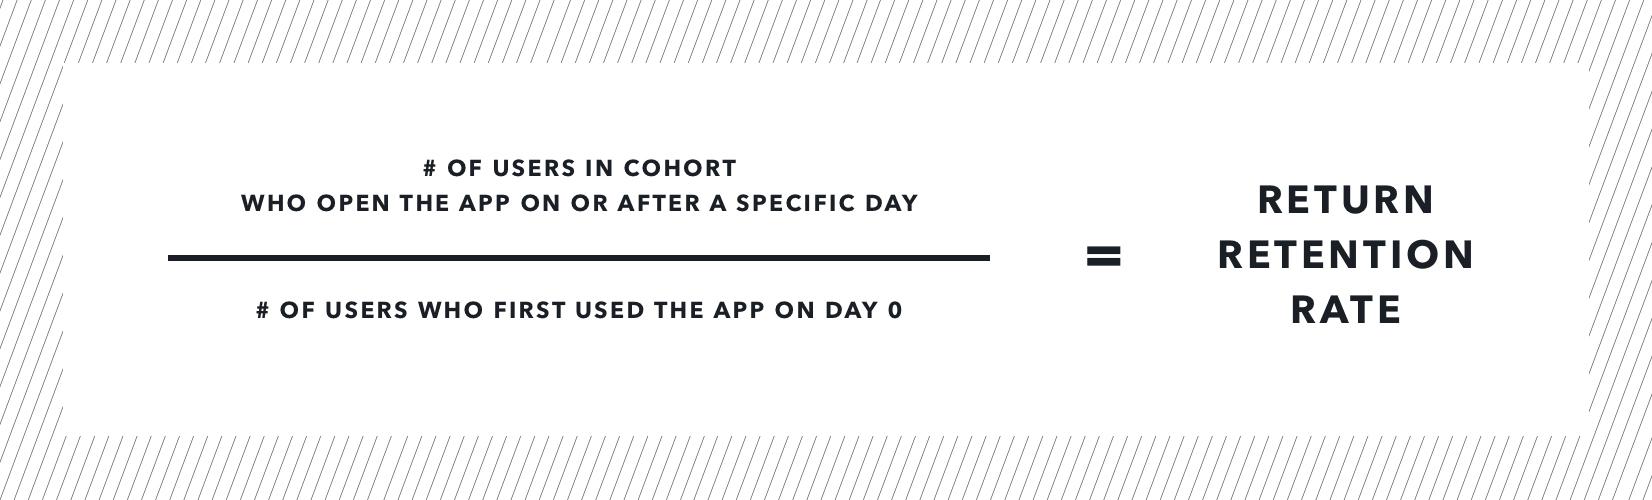
Rolling or return retention
Sometimes you want just one simple answer. Rather than combing over how many users are coming back today vs. tomorrow, or in two weeks vs. in three weeks, you just want to know how many customers you’ve successfully built a long-term relationship with. Rolling retention gives you that one number. Of course, is has its blind spots, too, which we’ll discuss.
To understand how rolling retention is calculated, let’s go back to our example of 10 new users on the first of the month. On the 7th, user A comes back. On the 10th, user B comes back. On the 15th, user C comes back and again on the 16th. Your Day 7 retention is 3/10 or 30% because users A, B, and C all came back on Day 7 or after. Your Day 14 retention is 1/10 or 10% because only user C came back on or after Day 14.
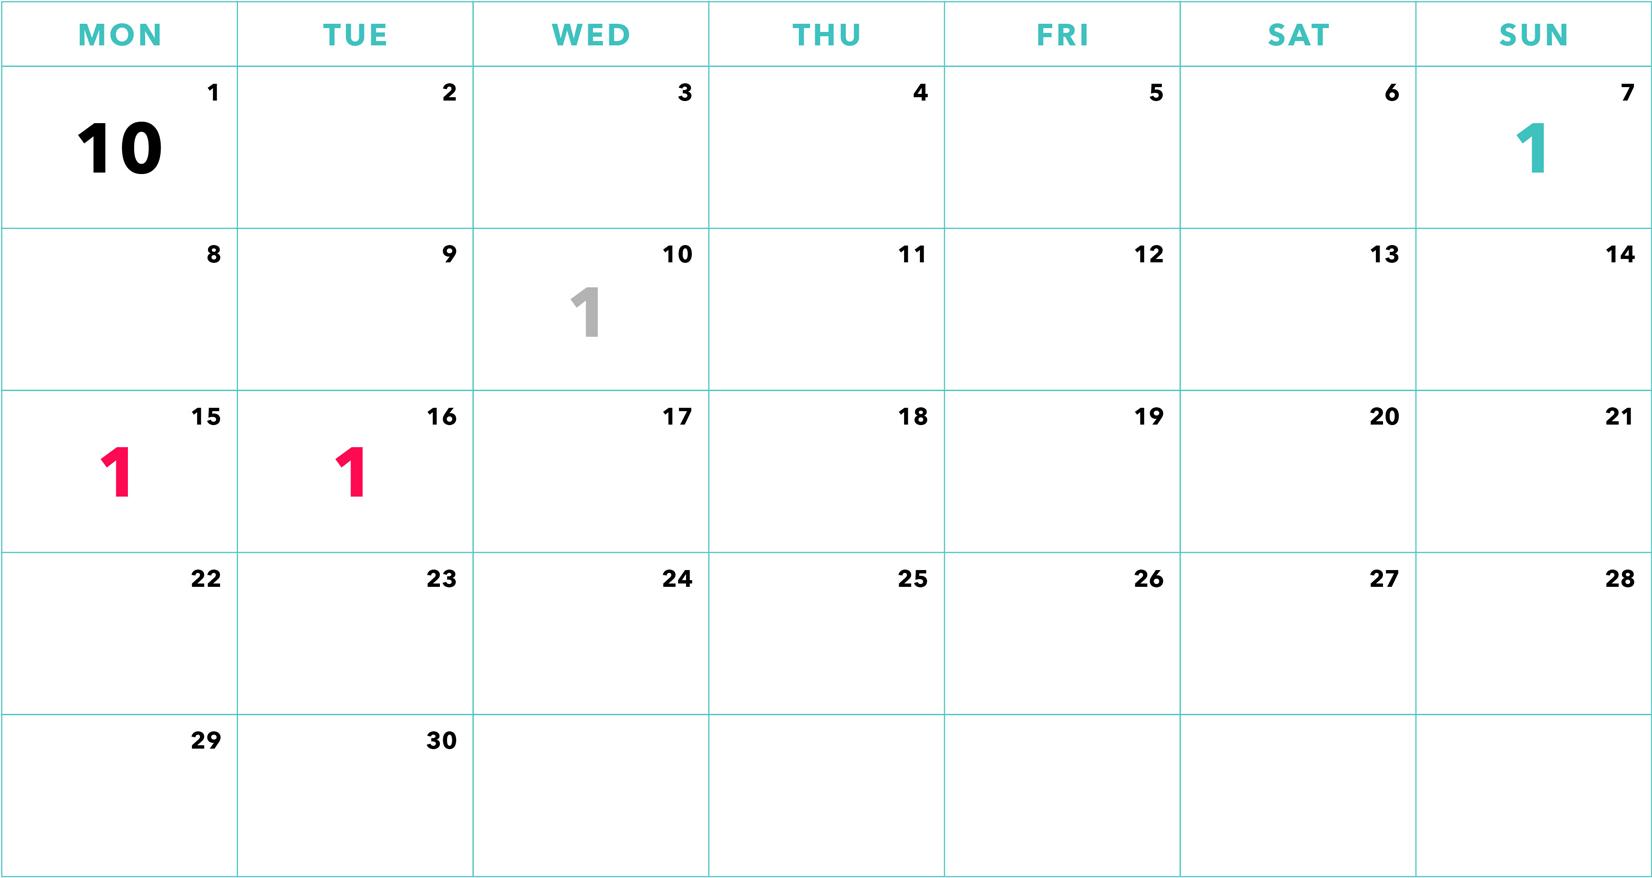
It doesn’t matter if a user comes back one time or 100 times after the day you’ve selected. At the same time, if you select Day 7 as the day to measure against, it doesn’t matter if the user comes back on Day 7 or Day 700.
Benefits
- Fast to calculate, requiring only two data points: date of first use and last use
- Reflects the stickiness of your app in one metric
Limitations
- Open-ended nature of methodology means the numbers can be constantly changing
- Treats a daily active user the same as a user who comes back only once after the measurement day
How should I be using this?
We recommend using this to supplement other KPIs and being mindful of the time frames used in the calculation. If you’re looking at a Day 3 rolling retention and pulling in a year of data, you may be missing out on a lot of detail. If you find that you have a low Day 30 rolling retention and high sessions per user, it could mean your app is grabbing user interest at first but struggling to keep it after a month of use.
What does Braze use?
In the Braze platform, you’ll see weekly range retention automatically calculated, which is great for day-to-day monitoring of your overall marketing efforts. You can also use classic retention to identify inflection points in activity and messaging effectiveness, especially when used with complex, multichannel, multi-step onboarding campaigns. Averaging multiple days together also offers insights into user behavior either during the week or week over week.
What’s next?
Now that you know the different ways of measuring retention rate and their related formulas, check out five tactics you can use to improve retention. For more on customer engagement, check out our comprehensive guide.

Be Absolutely Engaging.™
Sign up for regular updates from Braze.