The Secret to Improving Your App Metrics? Knowing How They’re Connected
Published on December 06, 2016/Last edited on December 06, 2016/10 min read


Team Braze
As mobile increasingly becomes the dominant way that customers engage with brands, it’s becoming more and more important for marketers to have a mobile-first strategy in place to communicate with, retain, and monetize their audiences. But you can’t get the full benefit of your mobile marketing tools and tactics if you don’t have a clear picture of what results you’re getting now and how those results stack up to mobile marketing benchmarks for your industry and the mobile space as a whole.
Appboy recently released Digits Volume 1, Fall 2016 Mobile Marketing Benchmarks Report, which draws on data from more than 500 apps and 6.5 billion push notifications to identify benchmarks for push notification opt-ins and opens, as well as user retention and average monthly app sessions. To give marketers more insight into the effectiveness of their mobile strategy, we took a deep dive into these metrics and their implications during our “Your App Metrics Are Telling You How To Make Them Better” webinar, part of Appboy’s Relate Live series of digital events.
Today, we’re taking a look at key points from that discussion, which featured me (Todd Grennan, senior content producer at Appboy) and Jesse Tao, Appboy’s senior manager for business intelligence. We’ll look at some of the metrics covered in the report, how to understand them and their relationship with each other, and what marketers can do to improve on their mobile results.
Let’s get started!
Why metrics matter
Without context, it’s impossible to tell how your mobile marketing is performing. A push notification opt-in rate of 50% can be impressive (since it’s significantly above the iOS average of 40%), or a sign of trouble (since it’s far, far below the average seen for Android medical + health + fitness apps) depending on your brand’s industry and the mobile operating system you’re looking at.
“In our increasingly complex and competitive mobile world, understanding how your brand is doing versus your industry is essential,” Jesse says. “Vanity metrics no longer cut it. And if you look at your metrics in isolation, without comparing them against industry and mobile benchmarks, you run the risk of missing out on the bigger picture.”
Why we chose the metrics we did
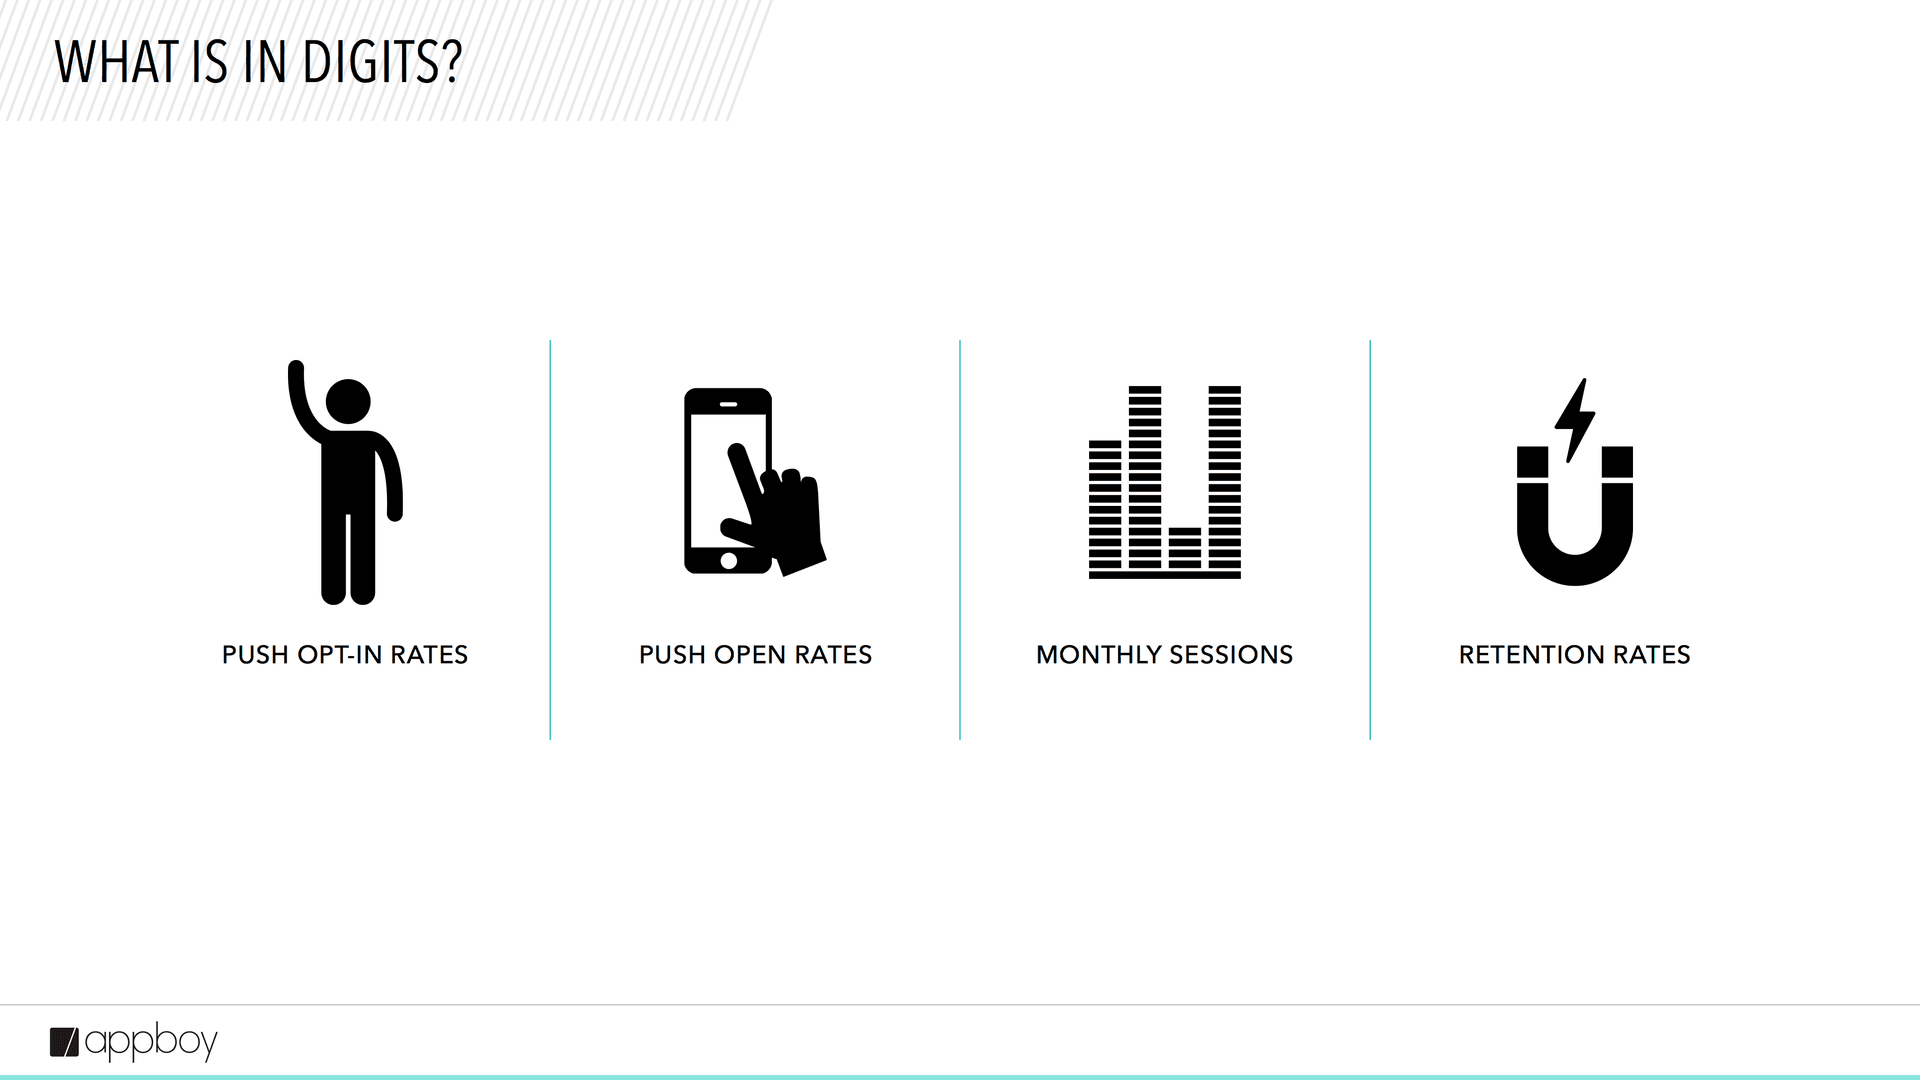
The Digits data report provides a lot of information about the results that brands are seeing with their mobile apps and mobile messaging by listing detailed data on four main mobile metrics:
- Push notification opt-in rates
- Push notification direct open and total open rates
- Average monthly app sessions
- User retention by day
Your brand’s push notification opt-in rate has a direct impact on whether you can reach members of your audience with this important messaging channel; your push open rate provides insight into whether your messages are inspiring action among their recipients; your app’s average monthly sessions show how engaged your audience is with your mobile presence; and your day-by-day retention rates directly impact the success of your mobile strategy over the long term.
“Why did we choose these metrics? Because they’re powerful,” Jesse says. “They’re powerful both individually and when you look at them in unison.”
What marketers can learn from the relationship between these metrics
None of these metrics exist in a vacuum. “You need a user to be opted in before you can send him or her a push,” Jesse notes. “And a push is meant to drive users into the app and generate sessions. And that kind of ongoing activity is what drives user retention over time.” But while it’s possible to view these four metrics as part of a linear process, be careful not to miss other relationships that can exist between them: “For instance,” Jesse says, “just because retention is at the end and push opt-in is near the start doesn’t mean that the two metrics aren’t connected.”
The odds are pretty strong that your brand will perform better in some of these metrics than others. And there’s a lot you can learn by digging deeper into the relationships between the results you’re seeing—for instance, if you’re seeing above average push opt-ins and below average push opens, your marketing needs different tweaks than if you’re seeing the reverse.
During the webinar, Jesse identified three relationships between the metrics that are particularly meaningful when it comes to understanding the success of your mobile marketing efforts. We’re going to take a minute to walk through WHY these relationships are significant, what they mean for your marketing, and how to act on the information they provide:
1. Push opt-in rate vs. push open rate
Each one of these relationships can help marketers understand something important about how users are responding to their mobile efforts. “When you look at push opt-in rates versus push open rates,” Jesse says, “you’re seeing how receptive your audience is to your mobile messaging.”
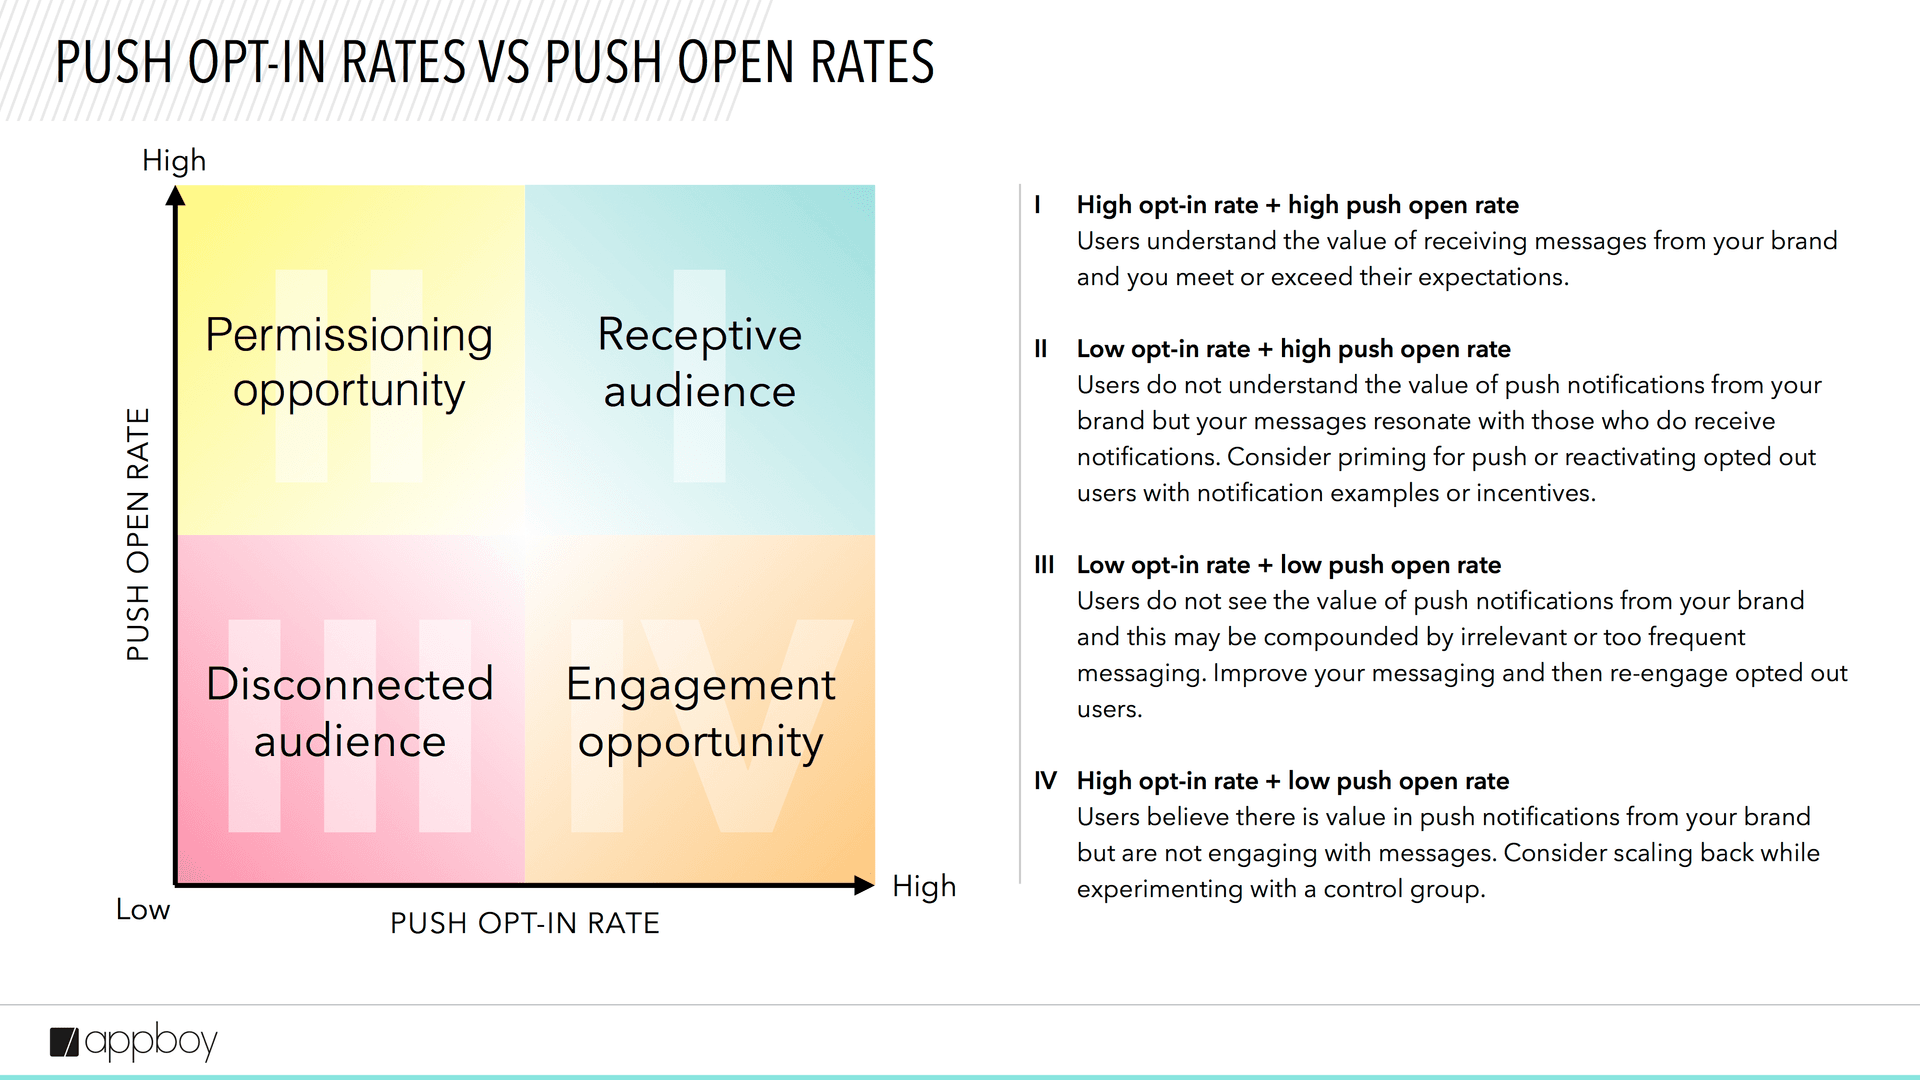
If your rate for both metrics is above average, that means your audience generally sees value in hearing from you and that your messaging is likely meeting or exceeding your customers’ expectations. On the other hand, if you’re seeing low rates for both opt-ins and opens, that suggests your users don’t see the benefit of letting you message them, and that the users who DO let you send them push notifications find the messages to be of low value—whether because they’re too frequent, irrelevant, or otherwise not of interest.
For brands that see strong push notification opt-ins but low opens, the message is clear: your audience is willing to give your outreach a chance, but what you’re currently sending them isn’t fitting the bill. However, if you’re seeing low opt-ins, but strong opens among customers who have opted in, that suggests your messaging is resonating, but the value of agreeing to receive your outreach isn’t clear when users log their first sessions.
2. Push open rate vs. average monthly sessions
By looking at push notification open rates in conjunction with average monthly app sessions, “marketers can get insight into how engaged users are with their brand,” Jesse says. “That’s powerful.”
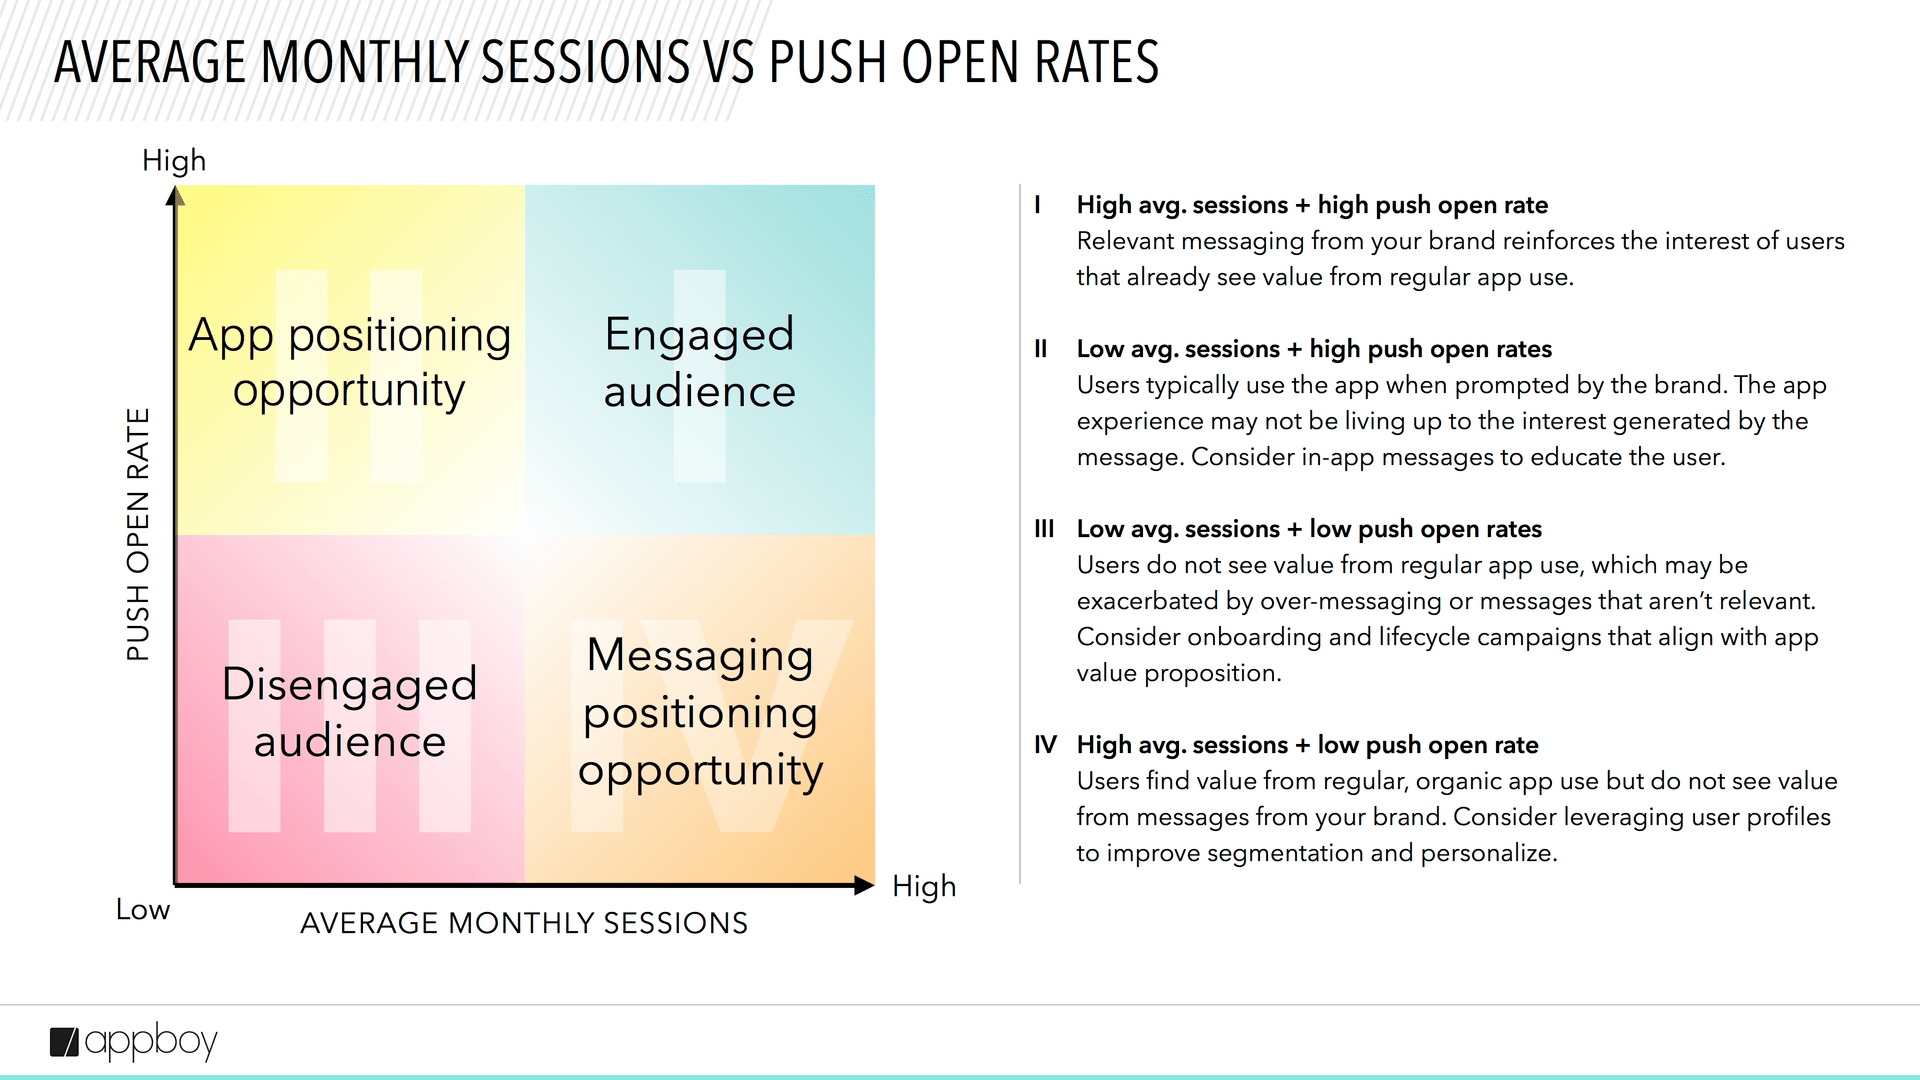
Brands that see higher-than-average push opens and average monthly sessions are blessed with a really engaged user base. “These customers regularly interact with messaging and organically use the app on their own,” Jesse explains, “so the messaging and the app usage may be organically influencing each other, creating a powerful virtuous cycle.” Conversely, apps that see low rates for both metrics are struggling with users who aren’t involved with your brand or its messaging, making it hard to turn them into loyal users.
If you’re seeing low average sessions but high push open rates, that can mean that your customers are willing to open your app when they receive a message, but aren’t interested enough in what you’re offering to log sessions organically. On the other hand, brands that experience high average sessions but see lower-than-average push opens have an audience that’s genuinely engaged with their app and the experience it provides, but aren’t seeing value in the messaging they’re getting.
3. Average monthly sessions vs. user retention rate
If marketers look at their app’s average monthly sessions in concert with its user retention rate, they can gain valuable insight into how active their audience is.
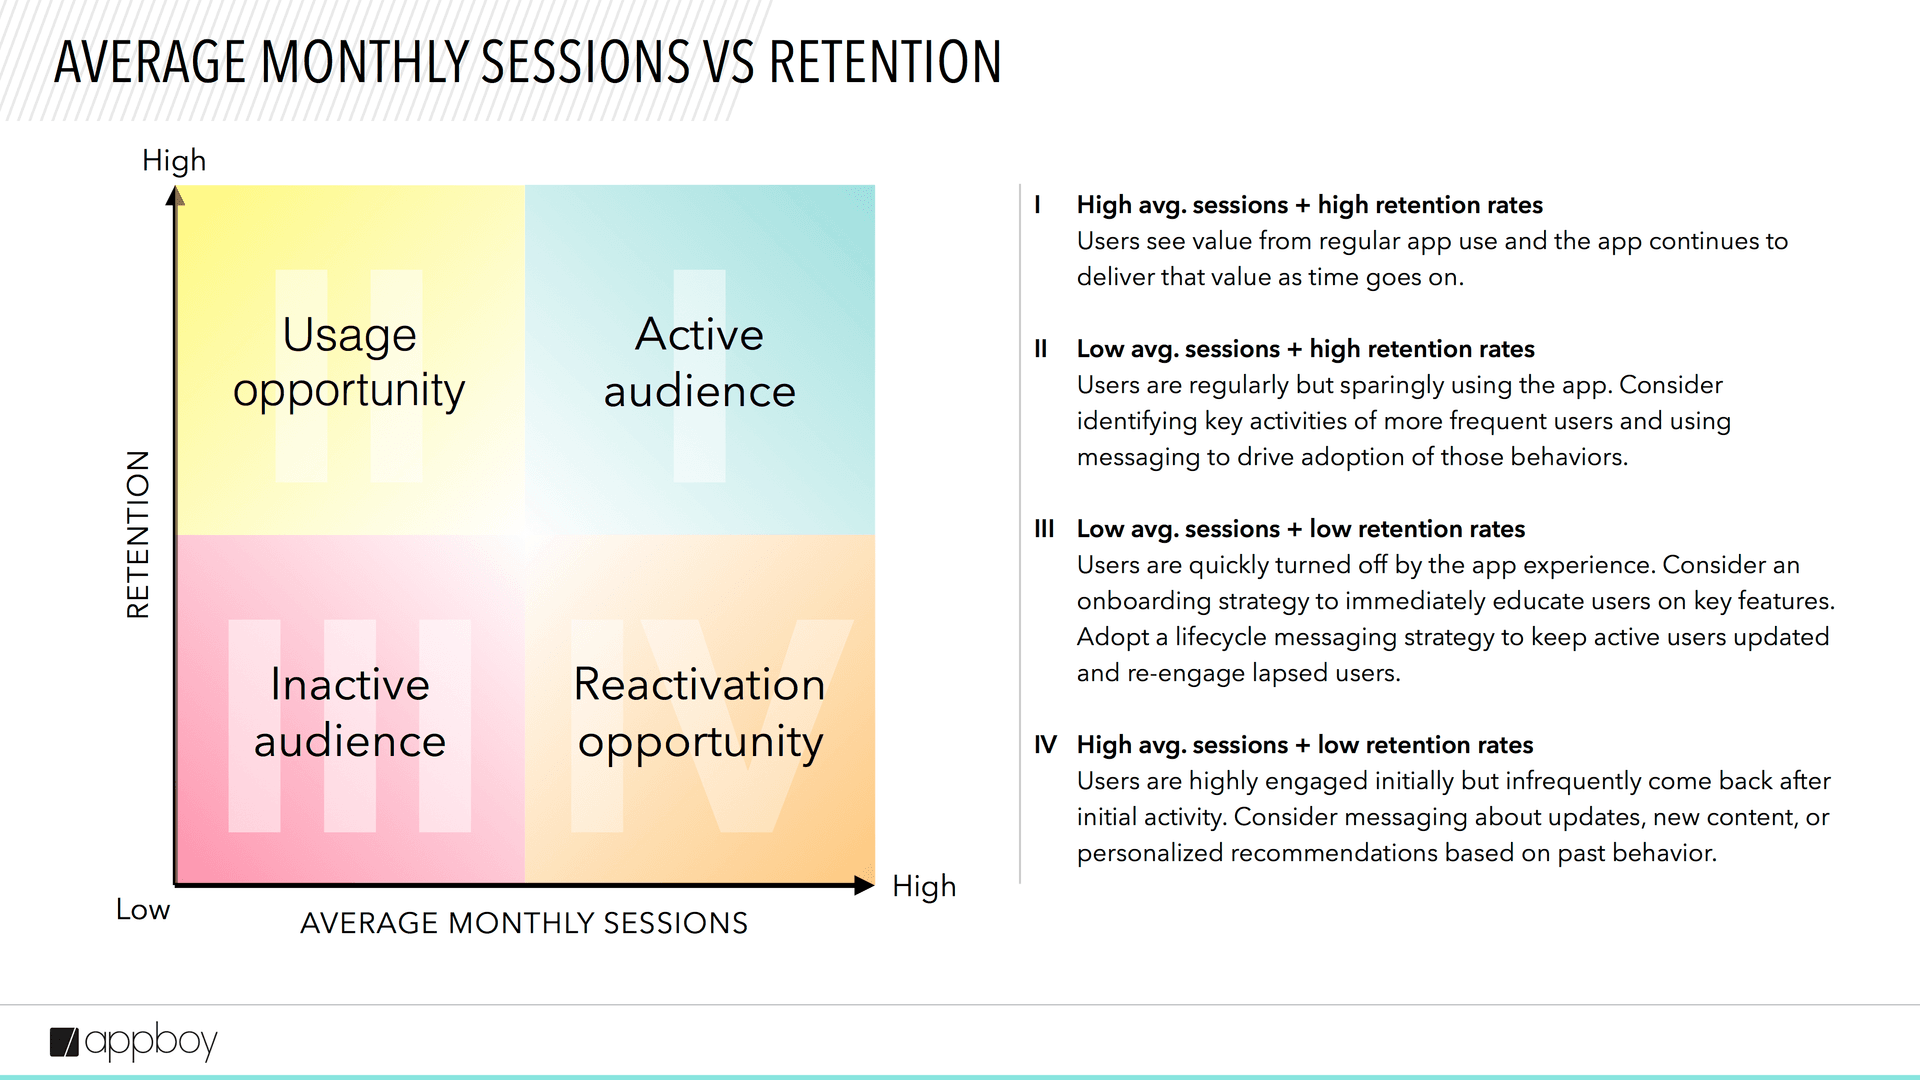
If you’re seeing high average sessions and a higher-than-average retention rate, congratulations—you have the kind of active audience that strong, long-term customer/brand relationships are built on. If, on the other hand, you’re seeing weak results for both these metrics, that’s a serious danger sign: not only are your users not using your app very often, they’re also not sticking around over the long haul, reducing the number of people you can engage with effectively and reducing the impact of your customer acquisition work.
Apps that experience low average monthly sessions but high retention are in an interesting situation: their audience base sees value in the app and continues using it month after month, but doesn’t see the benefit in using the app more regularly. That’s not necessarily a problem, but it makes sense to look at more frequent users and see if they exhibit behaviors that could be encouraged in the rest of your user base. It’s more of a problem if your brand’s app has high average sessions but low retention—that suggests that users are highly active at first but lose interest in your app over time, requiring escalating acquisition rates to maintain a growing customer base.
How marketers can improve their results
While it’s important to understand what your mobile results are and what they mean about how your audience is experiencing your brand, that insight alone isn’t enough—you have to be able to do something about your results if they aren’t where you need them to be.
During the webinar, we covered a number of different mobile marketing tools and tactics that brands can use to improve their mobile marketing numbers. But different metrics require different approaches. Think about which metrics are the most meaningful for your business before leaping in and trying to change everything all at once.
1. Improving your push notification opt-in rate
If your push notification opt-in rate is lagging behind the average for your vertical, that’s a big deal—push is a powerful tool for engaging (and re-engaging) users and can be a key part of your multichannel marketing strategy. To convince more of your audience to agree to enable push notifications, make sure to prime them for push by using other messaging channels to walk them through the benefits of receiving push notifications from your brand. If you already have a significant number of users who have opted out, consider using push re-permission campaigns to nudge them to re-enable push notifications going forward.
2. Improving your push notification open rates
Push notifications can do a lot to support your brand’s customer engagement and retention efforts—but only if people actually look at them. Want to increase the odds they do? Using message personalization to individually customize the push notifications that your users receive boosts related conversions by 27%, while adding an image or GIF to your messages increases engagement with its CTA by 57%, significantly increasing the chances that users engage with outreach. Additionally, if your marketing platform supports send-time optimization (which uses customer engagement data to deliver messages when each user is most likely to engage), using that tool has been shown to increase engagement with outreach by 25%.
3. Bolstering your average monthly app sessions
An app that no one uses can’t contribute to your brand’s customer base or bottom line. But getting customers to regularly return to the app can be as hard or harder than getting them to download it in the first place. Thankfully, there are a few simple tools that can do a lot to encourage your audience to come back consistently. Consider taking advantage of transactional and activity messaging campaigns to remind your audience about the value of your app in appealing, non-intrusive ways. And once you’ve gotten customers to come back to the app, make use of in-app outreach channels like in-app messages and News Feed Cards to keep them up to speed on new features, let them know about relevant promotions, and support a responsive, appealing user experience.
4. Boosting your user retention rate
A strong user retention rate is essential to the long-term health of your business. To ensure that you’re doing everything you can to persuade your customers to stick around, check out our blog post on beating today’s soul-crushing app retention odds.
What now?
To get the full benefit of the webinar, check out the complete presentation below.
Your App Metrics Are Telling You How To Make Them Better: The Digits Data Report from Braze (formerly Appboy)
Be Absolutely Engaging.™
Sign up for regular updates from Braze.
Related Content
 Article3 min read
July 2026 Bonfire Marketer of the Month: Cleo’s Holly Jacobson
July 27, 2026 Article8 min read
Closing deals, driving growth for customers, and the team behind it: Life as an Account Executive at Braze
July 17, 2026 Article12 min read
BrazeAI™ marketing tools: The complete guide to AI-powered customer engagement
July 17, 2026