App engagement metrics: From onboarding to long-term loyalty
Published on July 24, 2025/Last edited on July 24, 2025/10 min read

Team Braze
In the bustling bazaar of mobile apps, where every swipe and tap is a potential transaction, understanding app engagement metrics is akin to having a treasure map. It’s not just about finding the gold; it’s about knowing how to keep it shiny and valuable.
If you're a marketer feeling the pressure of tight deadlines, don't worry! This article is here to be your go-to resource, breaking down the essentials of app engagement metrics and packed with actionable insights to help you thrive.
What is app engagement?
App engagement refers to the level of interaction and activity users have with a mobile application, reflecting how often and in what ways they utilize its features and content.. High app engagement means users find value in your app, leading to increased retention, loyalty, and ultimately, revenue.
Engagement can manifest in various ways: Completing tasks, making purchases, sharing content, or simply returning to the app like a favorite café that keeps customers coming back for their daily fix. Understanding app engagement is important for marketers, as it directly impacts the app's success and longevity in a competitive market.
Why app engagement metrics matter
Let’s face it: Launching an app is just the beginning. It’s like throwing a party and realizing no one showed up. According to recent data, 77% of users abandon an app within the first three days of downloading it. If your app isn’t engaging, it’s likely to end up in the digital graveyard alongside countless others.
But why do users disengage? By focusing on app engagement metrics, marketers can identify pain points and optimize the user journey from onboarding to long-term loyalty.
Understanding the psychology of mobile app user engagement metrics
To truly grasp app engagement, it’s essential to understand the psychology behind user behavior. Users are driven by emotions, desires, and habits. By tapping into these psychological triggers, marketers can craft messages and experiences that resonate deeply.
For instance, using scarcity (limited-time offers) can create a sense of urgency, while social proof (user testimonials) can make users feel like they’re part of an exclusive club. It’s all about making users feel special, like they’ve just discovered a hidden gem in a crowded marketplace.

The role of data in shaping engagement strategies
As we navigate the landscape of app engagement, data emerges as our trusty compass. It’s not just numbers on a screen; it’s the key to unlocking user engagement patterns. By analyzing this data, marketers can make informed decisions that enhance user experiences and drive engagement.
Emphasizing the importance of A/B and multivariate testing can help marketers refine their strategies. Experimenting with different messaging, designs, and features allows for continuous improvement based on real user feedback, helping to keep your app relevant and engaging.
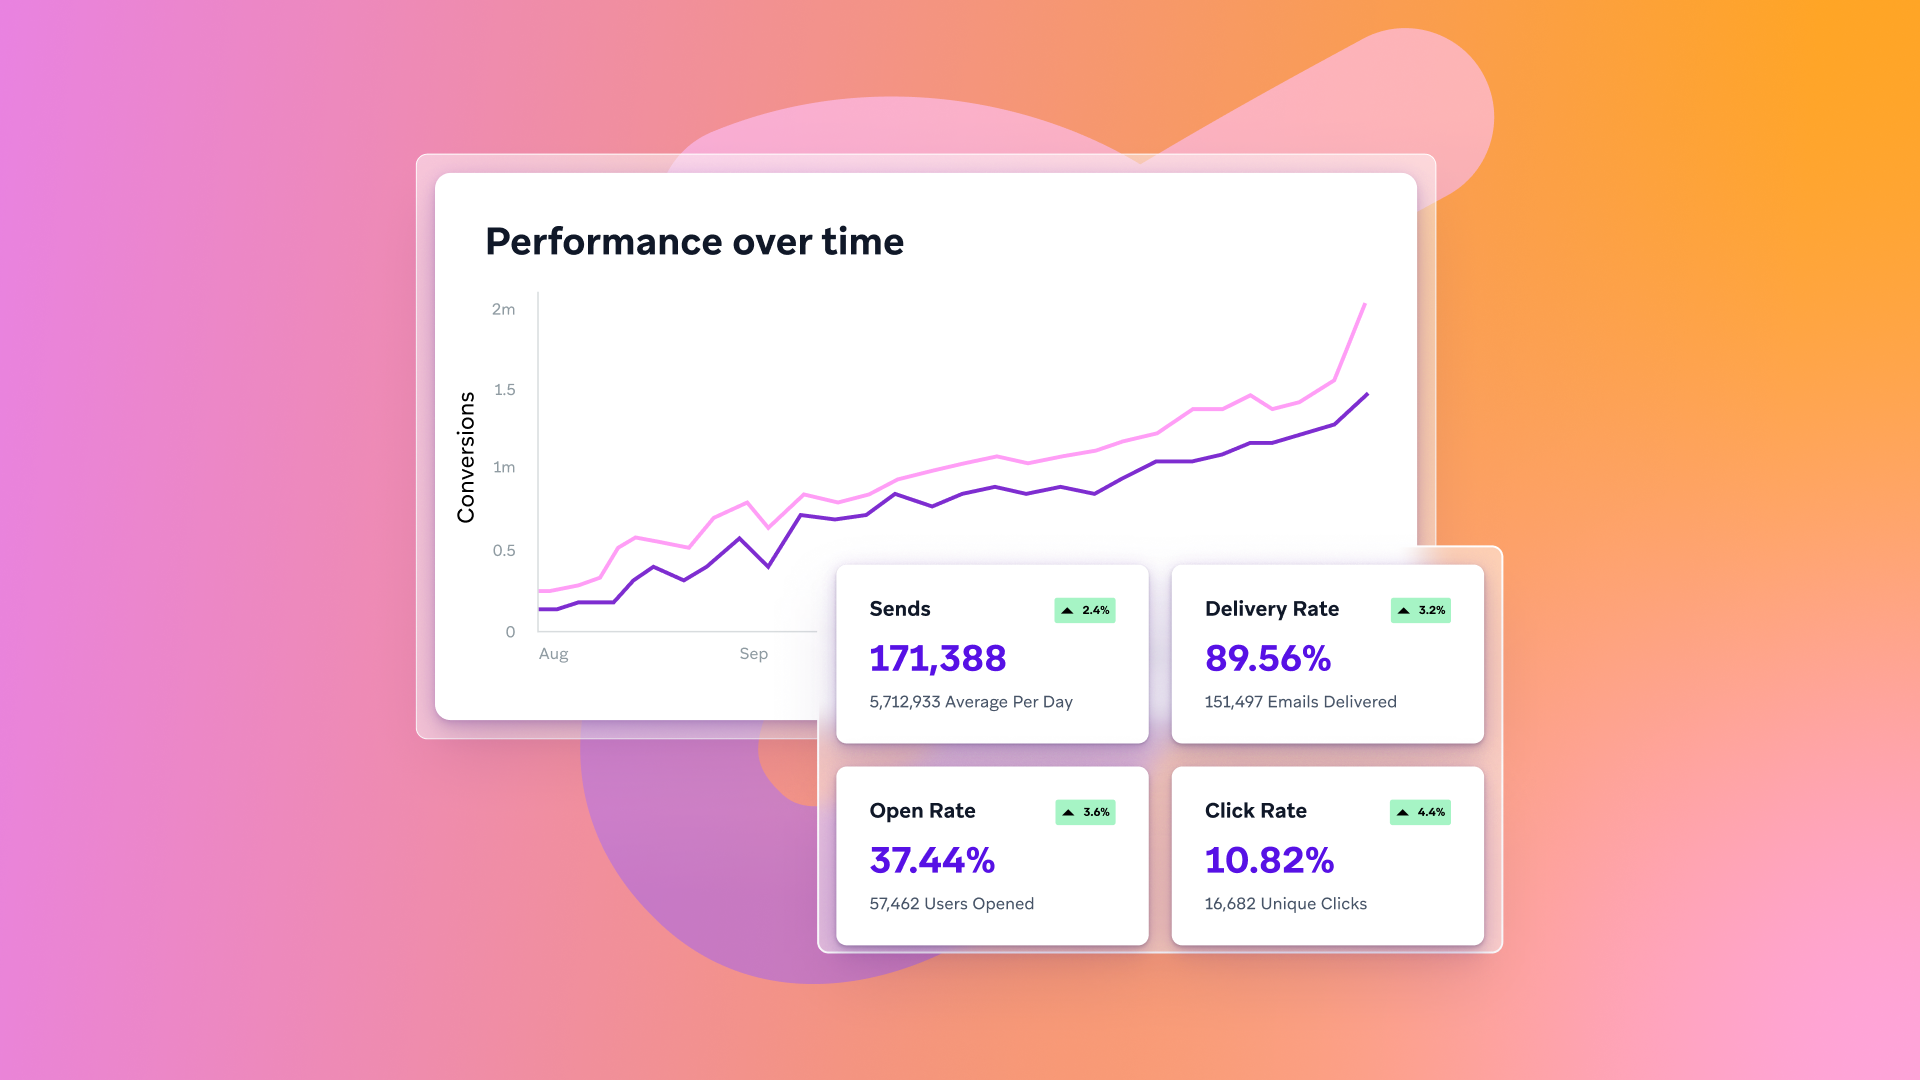
Key mobile app engagement metrics to track
Here’s a detailed list of key metrics that every marketer should track, along with explanations of what they are, how to calculate them, and why they matter.
1. Daily active users (DAU)
What it is: DAU measures the number of unique users who engage with your app daily.
How to calculate it: Count the number of unique users who open your app in a 24-hour period.
Why it matters: DAU gives you a snapshot of your app’s daily performance. A steady or growing DAU likely indicates that users find value in your app and are returning regularly..
2. Monthly active users (MAU)
What it is: MAU tracks the number of unique users who engage with your app over a month.
How to calculate it: Count the number of unique users who open your app in a 30-day period.
Why it matters: MAU helps you understand your app’s long-term engagement trends. Comparing DAU and MAU can reveal insights into user retention and engagement patterns.
3. Retention rate
What it is: Retention rate measures the percentage of users who return to your app after their first visit.
How to calculate it: (Number of users who return after a specific period / Total number of users) x 100.
Why it matters: A high retention rate can indicate that users find your app valuable enough to stick around. It’s a critical metric for assessing user loyalty.
4. Churn rate
What it is: Churn rate measures the percentage of users who stop using your app over a specific period.
How to calculate it: (Number of users lost during a period / Total number of users at the start of the period) x 100.
Why it matters: Understanding churn helps you identify issues that may be driving users away. A high churn rate signals a need for improvement in user experience.
5. Session length
What it is: Session length measures the average time users spend in your app during a single session.
How to calculate it: Total time spent in the app / Number of sessions.
Why it matters: Longer session lengths often indicate higher engagement levels. If users are spending more time in your app, they’re likely finding it useful and enjoyable.
6. Session frequency
What it is: Session frequency tracks how often users open your app within a specific timeframe.
How to calculate it: Total number of sessions / Total number of unique users.
Why it matters: High session frequency suggests that users are actively engaging with your app. It’s a good indicator of user interest and satisfaction.
7. User lifetime value (LTV)
What it is: LTV estimates the total revenue a user will generate throughout their relationship with your app.
How to calculate it: Average revenue per user (ARPU) x Average user lifespan.
Why it matters: Understanding LTV helps you allocate marketing resources effectively. It allows you to understand how much you can spend to acquire new users while remaining profitable.
8. Customer acquisition cost (CAC)
What it is: CAC measures the cost of acquiring a new user.
How to calculate it: Total marketing expenses / Number of new users acquired.
Why it matters: Keeping CAC low while maximizing LTV is a key part of sustainable growth. A high CAC can eat into profits and hinder your app’s success.
9. In-app engagement metrics
What it is: These metrics track specific user actions within your app, such as clicks, shares, and purchases.
How to calculate it: Use analytics tools to monitor user interactions and behaviors.
Why it matters: In-app engagement metrics provide insights into how users interact with your app’s features. They help you identify popular content and areas for improvement.
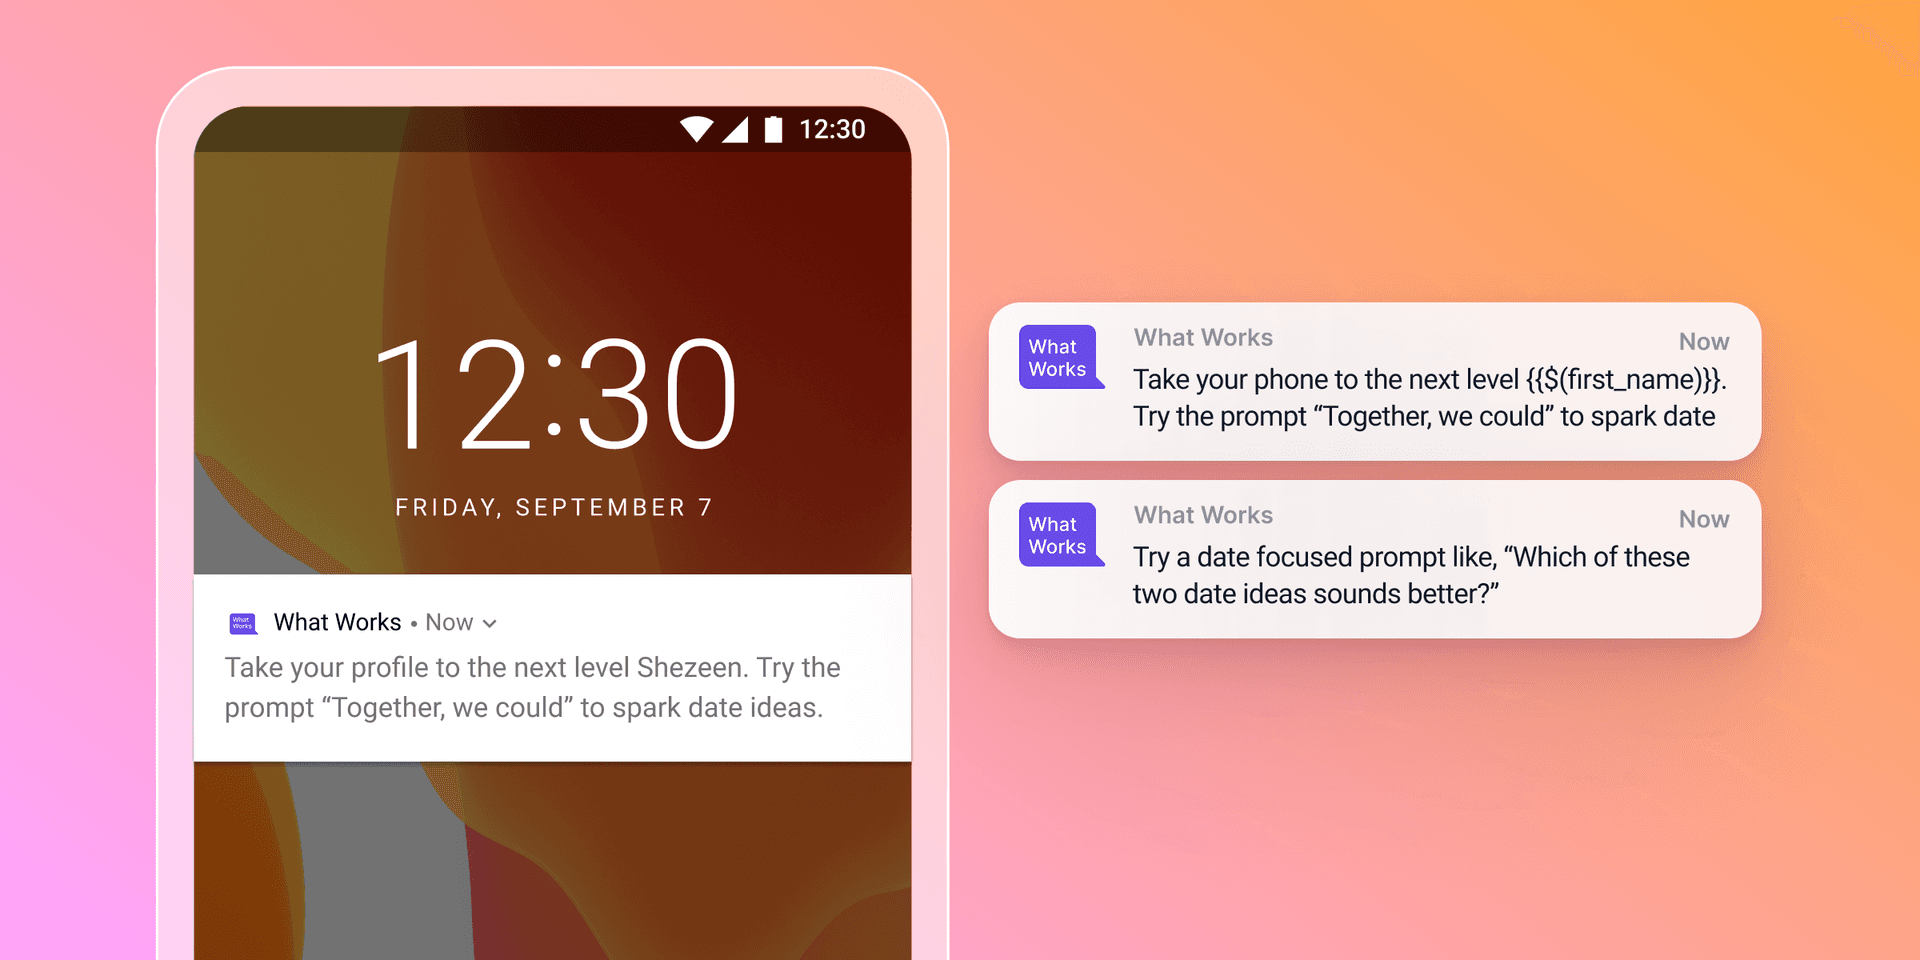
10. Push notification engagement
What it is: This metric measures how users respond to push notifications sent by your app.
How to calculate it: (Number of users who engage with a notification / Total number of notifications sent) x 100.
Why it matters: Effective push notifications can drive user engagement. Monitoring this metric helps you refine your messaging strategy.
11. Conversion rate
What it is: Conversion rate measures the percentage of users who complete a desired action, such as making a purchase or signing up for a newsletter.
How to calculate it: (Number of users who complete the action / Total number of users) x 100.
Why it matters: A high conversion rate indicates that your app effectively encourages users to take action. It’s a key metric for assessing the success of your marketing efforts, like knowing how many guests at your party actually stayed for dessert.

User engagement metrics for apps: Turning insights into action
Understanding these app engagement metrics is not just about collecting data; it’s about transforming insights into actionable strategies. Each metric tells a story about user behavior and preferences. For instance, if you notice a high churn rate, it may indicate that users are not finding the value they expected. This insight can prompt you to investigate the onboarding process or the app’s features.
Similarly, a low retention rate could signal that users are not being adequately engaged after their initial visit. This could lead to strategies focused on improving user experience, such as enhancing personalization or introducing gamified elements.
By interpreting these metrics, marketers can prioritize their efforts, allocate resources effectively, and ultimately create a more engaging app experience that resonates with users.
In this guide, we take a look at the refreshed Braze Report Builder and new Dashboard Builder tool, exploring how marketing teams can leverage technology to veimpro their campaign outcomes and support stronger customer relationships.
Top 5 tips for improving app engagement metrics
1. Optimize onboarding and personalize experiences
Streamline your onboarding process so users can understand your app’s value quickly. Use clear instructions and highlight key features. Additionally, leverage user data to personalize experiences. Tailor content, recommendations, and notifications based on user behavior and preferences to foster a deeper connection.
2. Implement gamification and community features
Make your app more engaging by incorporating gamification elements like rewards and challenges. This motivates users to interact more frequently. Additionally, create a sense of community by encouraging user interaction through forums, chat rooms, or social sharing options. This fosters connections and keeps users coming back.
3. Use push notifications strategically
Push notifications can enhance engagement when used wisely. Send timely reminders about important updates, offers, or new features, but avoid overwhelming users with excessive notifications. A well-timed push can drive users back into the app and keep them informed without being intrusive.
4. Regularly update your app and gather user feedback
Keep your app fresh by regularly releasing updates that introduce new features, fix bugs, and enhance performance. Communicate these updates to users to encourage exploration. Additionally, actively seek user feedback through surveys or in-app prompts. Use this feedback to make informed improvements and show users that their opinions matter.
5. Monitor metrics and leverage data-driven tools
Regularly track and analyze your app engagement metrics to identify trends and areas for improvement. Use analytics tools to gain insights into user behavior and make data-driven decisions. Consider leveraging a customer engagement platform like Braze for tools designed to enhance engagement and drive personalized customer experiences.
Real life example: How Hinge Drove 200% More App Engagement With Cross-Channel Messaging
Problem: Hinge wanted to transform the dating app experience by fostering real relationships instead of allowing users to endlessly swipe through options.
Strategy: To achieve this, Hinge launched its “Most Compatible” campaign, which pairs users every 24 hours with potential matches based on their preferences and activity within the app. This initiative was supported by a cross-channel messaging campaign powered by Braze, utilizing email, push notifications, and in-app messaging to maximize user engagement.
Results: The campaign resulted in a remarkable 200% increase in click-through rates for emails and push notifications. Hinge’s approach ensured that every user touchpoint—from profile setup to notifications—was designed to support authentic connections, ultimately leading to more successful dates.
Key Takeaway: Building a dating app that’s “designed to be deleted” means every email, push notification, and in-app message needs to be calibrated to promote authentic connections between users. By using Braze to build creative messaging campaigns, Hinge ensures users frequently engage not only with the app but also with each other in a more effective way.
Final thoughts: Embrace a culture of continuous improvement
As you embark on your journey to enhance app engagement metrics, remember that it’s not a one-time effort but a continuous process. Embrace a culture of experimentation and improvement. Regularly revisit your strategies, stay attuned to user feedback, and adapt to changing user needs.
Ready to transform your app engagement strategy? Explore how Braze can empower your app team with data-driven tools and personalized customer experiences. Let’s make sure that your app is one that users love and can’t live without, because in the end, it’s all about making connections that matter.
FAQs about app engagement metrics
What are app engagement metrics?
App engagement metrics are quantitative measures that track how users interact with a mobile application. These metrics include Daily Active Users (DAU), Monthly Active Users (MAU), retention rates, churn rates, session lengths, and more. They help marketers understand user behavior, identify trends, and optimize the app experience.
Why are app engagement metrics important?
App engagement metrics are important because they provide insights into user behavior and preferences, allowing marketers to make data-driven decisions. By understanding how users engage with the app, brands can improve user retention, reduce churn, and ultimately increase revenue and customer lifetime value.
What are the key app engagement metrics to track?
Key app engagement metrics include Daily Active Users (DAU), Monthly Active Users (MAU), retention rate, churn rate, session length, session frequency, User Lifetime Value (LTV), Customer Acquisition Cost (CAC), in-app engagement metrics, push notification engagement, app store ratings and reviews, and conversion rate. Each metric offers unique insights into user behavior and app performance.
How can I improve app engagement metrics?
To improve app engagement metrics, focus on optimizing the onboarding process, personalizing user experiences, implementing gamification elements, using push notifications strategically, and regularly updating the app based on user feedback. Additionally, leveraging data-driven tools can help you monitor and analyze engagement metrics effectively.
What tools can help with tracking app engagement metrics?
Related Tags
Be Absolutely Engaging.™
Sign up for regular updates from Braze.
Related Content
 Article8 min read
Closing deals, driving growth for customers, and the team behind it: Life as an Account Executive at Braze
July 17, 2026 Article12 min read
BrazeAI™ marketing tools: The complete guide to AI-powered customer engagement
July 17, 2026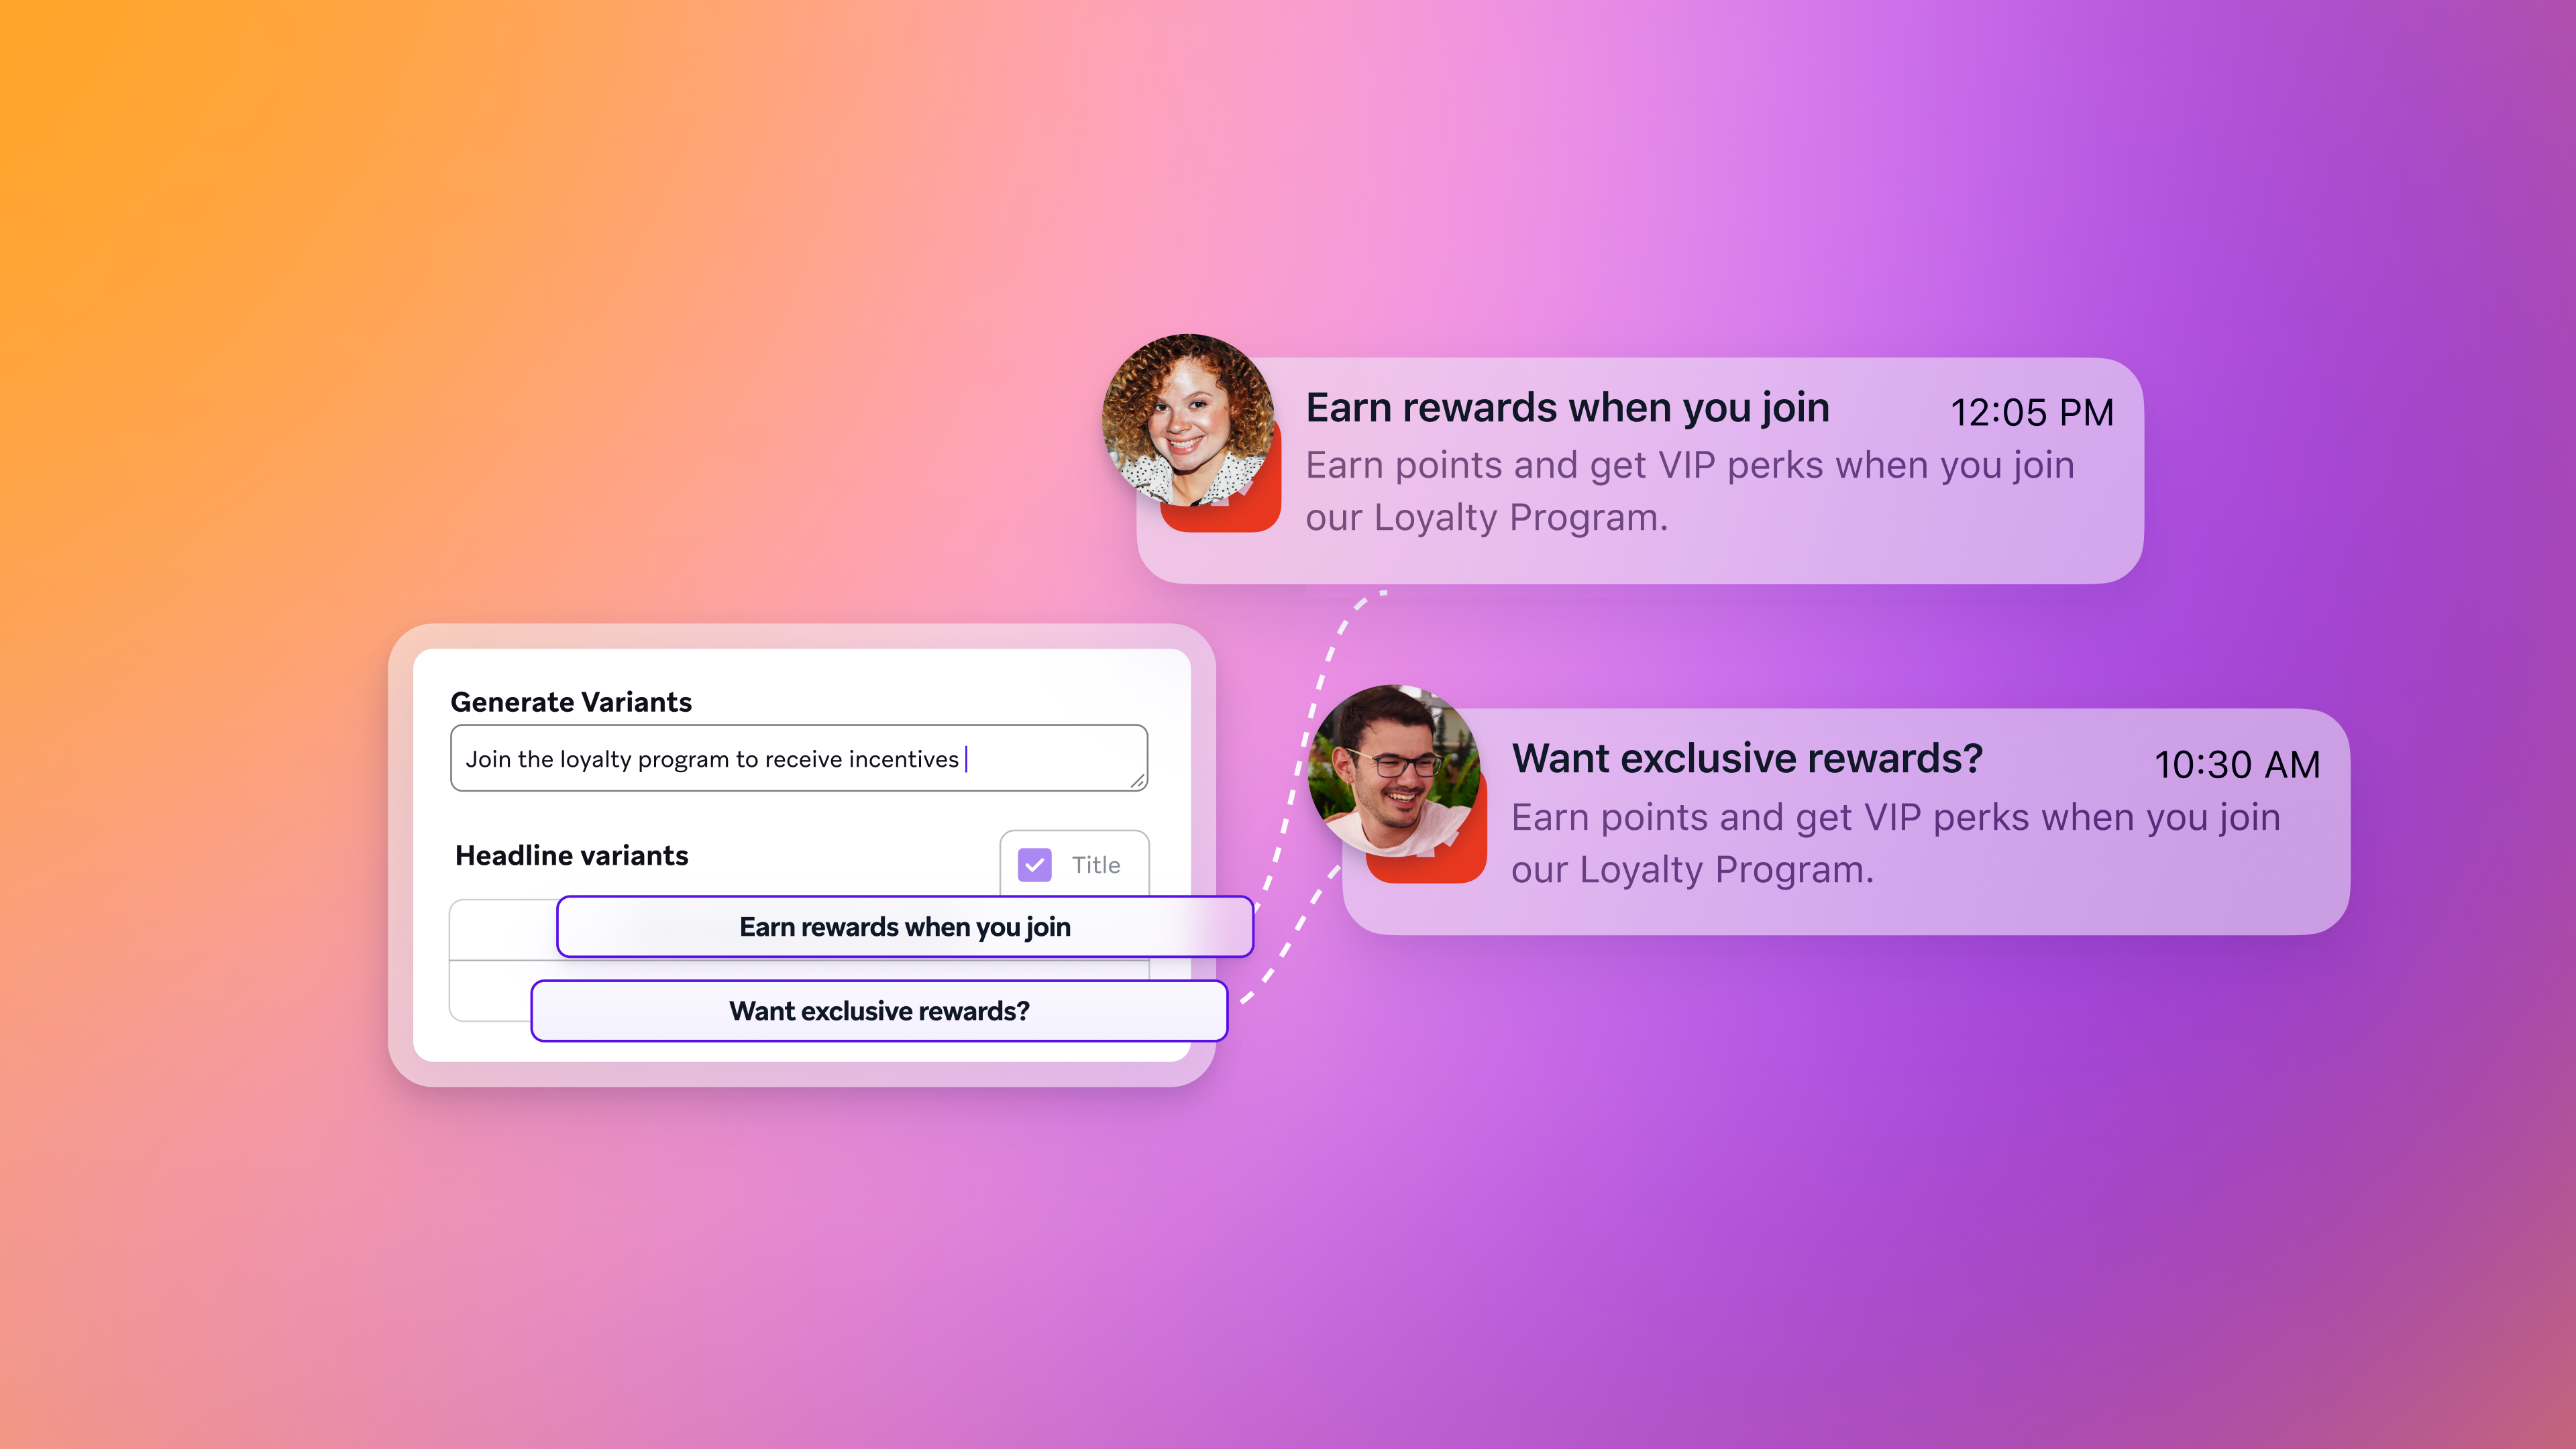 Article12 min read
AI email marketing: How to use AI to run smarter email programs
July 16, 2026