8 Tips to Get More Value from Your Reporting
Published on October 08, 2021/Last edited on October 08, 2021/5 min read
Team Braze
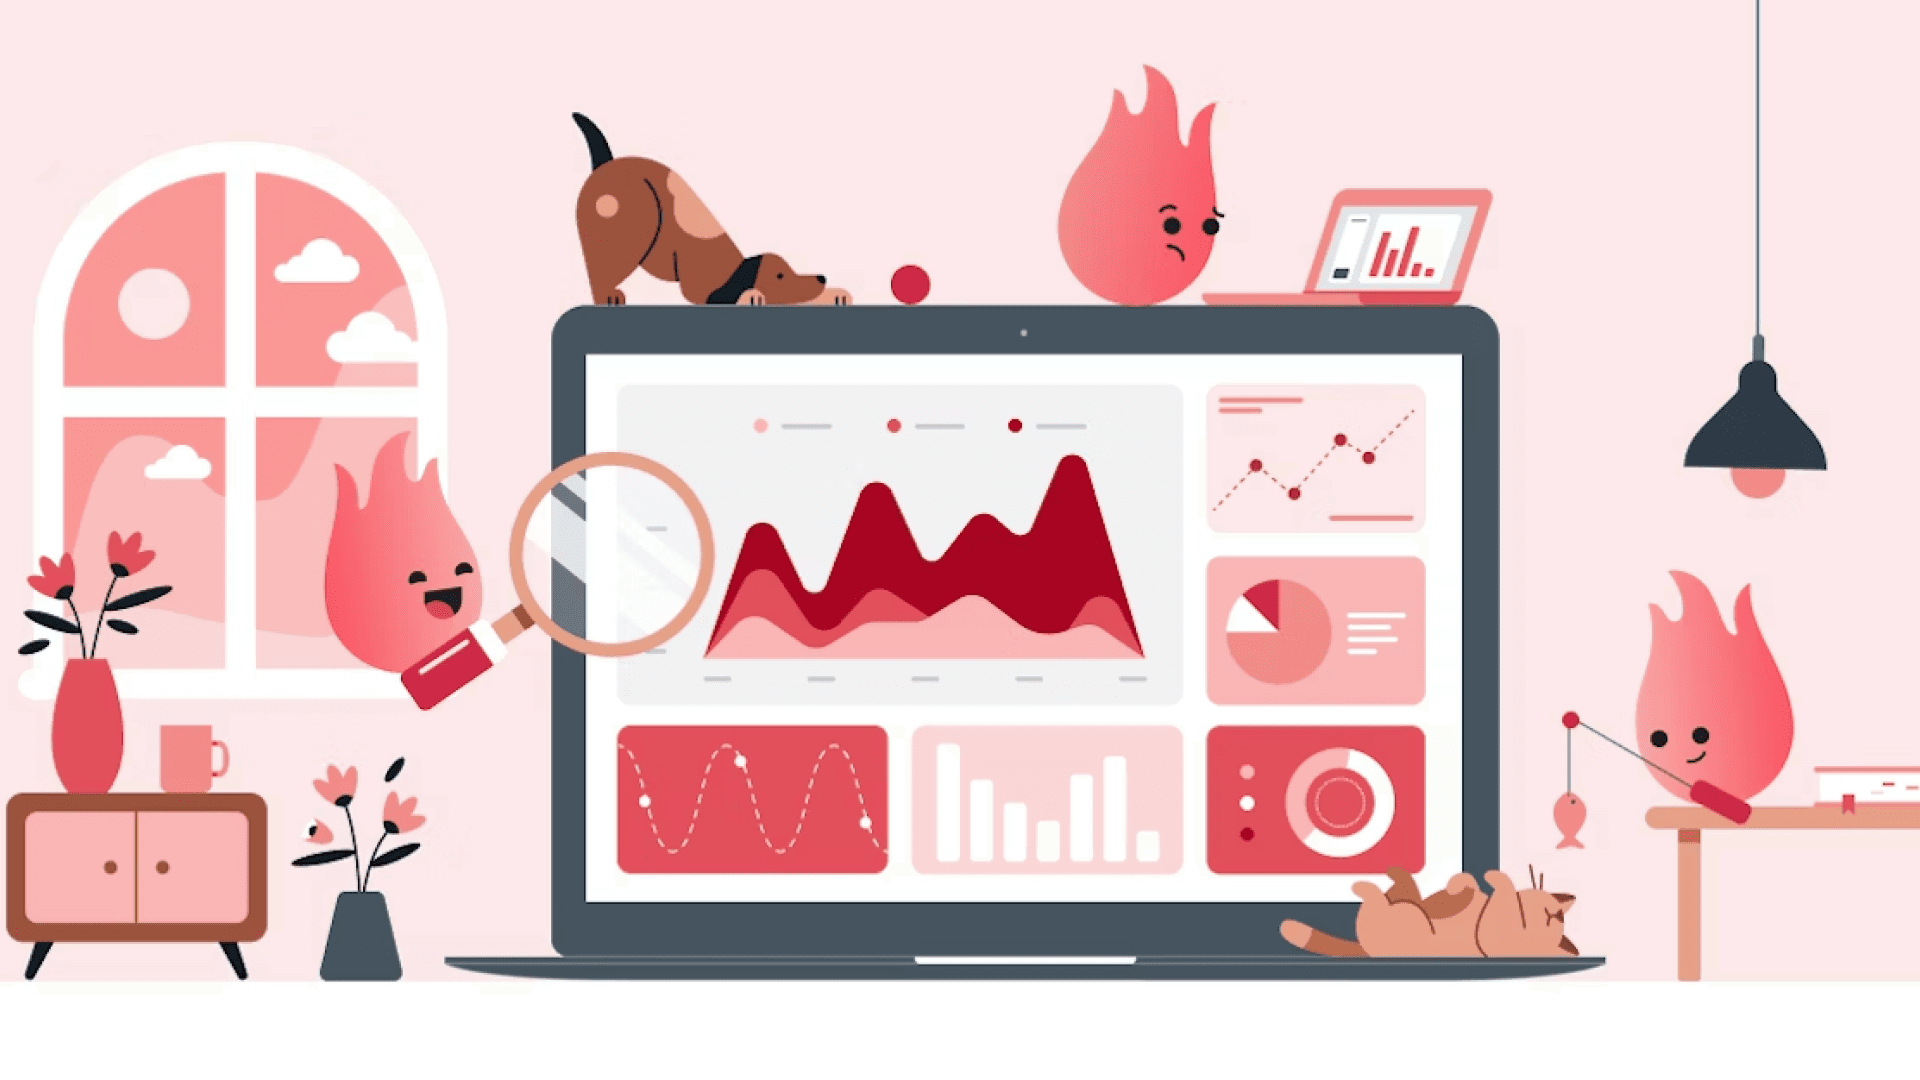
To be effective, a customer engagement strategy needs to be data-driven across the board. Outside of using relevant customer information to fuel power messaging, brands need to look at their own data to make key decisions about what campaigns to build, adjust, or even sunset. To make that process simpler, Braze offers our customers a wide array of metrics, reporting, and tracking capabilities to ensure your brand can get the engagement insights you need.
Looking to understand your customer engagement results in more detail? Let's check out some tips on in-product reporting from a recent session in the Braze Bonfire Masterclass series.
#1: Optimize your engagement strategy in Report Builder
The Braze Report Builder allows you to compare the results of multiple campaigns or customer journeys in a single view and then evaluate which engagement strategies have the biggest impact on your marketing goals. Use this tool to answer questions such as:
- Which campaign delivery methods had the highest impact on open rates?
- Which version of an email had a higher conversion rate?
- Which seasonal promotion had the highest purchase rate?
#2: Compare the long-term impact of different variants in Retention Reports
Braze Retention Reports allow you to analyze the performance of a variant across a specific day, week, or month. This is especially helpful if you are A/B testing different re-engagement messages to find the most impactful option. Use this tool to answer questions such as:
- How did the re-engagement campaign impact retention after 1 day? 30 days?
- Where does engagement start to fall off after receiving a campaign?
- Which message variant impacted retention the most?
#3: Understand weak spots in the path to conversion with Funnel Reports
A Braze Funnel Report can help you understand the actions that your customers take (or don’t) after they’re added to a user journey powered by Braze Canvas, and the impact each journey variant has on the conversion funnel associated with that Canvas. This is especially helpful if you use multiple steps or actions to determine whether a conversion has occurred. Use this tool to answer questions such as:
- Where are customers dropping off on the path to purchase?
- How many users completed each step in the onboarding process?
- How many users received, opened, clicked, and started a session after receiving a given email?
#4: Compare the success of your message beyond the initial conversion event
You can also use a Funnel Report to assess the success of your messages beyond the conversion event that you initially set up for that customer journey. For instance, you can see how the messages you sent impacted your conversion funnel. You can also add conversion events after your campaign has gone live if you accidentally forget to set them up at the start of your program.
#5: Tag reports to simplify and organize your data
One great way to organize your reports and make it easier for you to filter for future use is by being consistent about tagging your campaigns and Canvases. You may find that you want to tag them by “onboarding,” “new features,” or even by channel mix like “push only” to store and organize your data; that said, every brand will likely have its own tagging approach, based on its specific needs and the way its campaigns are organized.
#6: Use similar conversion events to simplify comparisons
While this approach won’t work in every use case, one trick that can help brands more easily get a picture of how your campaigns are performing is to use the same conversion events across multiple Canvases. That way, you can more easily line up your conversion events in Report Builder and enable simpler conversion comparisons. These kinds of approaches can help you keep your data more organized, which is key to increasing data quality and output, as well as your overall productivity.
#7: Add “Average” or “Total” to easily find the mean or sum of your metrics
While the Report Builder is often used to compare the results from the different campaigns and Canvases you may be sending, sometimes you need to get an overall picture of the impact of these activities in the aggregate. To do that, all you need to do is toggle calculations to determine the “average of any rate-based or numerical metric, or the “total” for any numerical metric, depending on what you’re looking to examine.
#8: Get a full picture of the impact of your customer engagement program with Global Control Reporting
Looking to prove the value of your customer engagement efforts as a whole? With Braze Global Control Reporting, you can define and exclude a subset of users from receiving messages. That allows you to easily compare the results from users within and outside of your control group, providing a better understanding of how your customer engagement programs are impacting user behavior and contributing to your business goals. Plus, this feature let you:
- Automatically randomize and exclude control group members from receiving messages
- See estimates on the number of excluded users
- Easily measure the overall success of campaigns and Canvases based on your chosen metrics
Final Thoughts
It’s important to be flexible when setting up your campaign reporting—so make sure you adjust accordingly as business needs change and the data you need changes over time. A campaign that performed well last season is not guaranteed to get the same results in the future. Keep coming back to your reporting tools to analyze, refine, and iterate to keep your campaigns fresh.
Every day, thousands of Braze users from all over the world visit the Braze Bonfire Slack community to ask questions, share ideas, and grow their network. Join the conversation and sign up today to become a member of our virtual community.
Related Tags
Be Absolutely Engaging.™
Sign up for regular updates from Braze.
Related Content
 Article7 min read
Email deliverability across APAC: Navigating a diverse digital landscape
July 31, 2026 Article4 min read
The new CNIL recommendations: Email tracking pixels in France
July 30, 2026 Article6 min read
Built to Scale: Announcing the 10 Startups Joining Cohort 6 of Braze Product Grant Program
July 30, 2026