Introducing Braze Benchmarks: How Do You Stack Up?
Published on June 04, 2019/Last edited on June 04, 2019/6 min read


Kelsey Cottingham
Editor, Content Marketing at BrazeIn today’s mobile landscape, communicating with your customers across channels, in a way that feels personal and relevant is becoming less and less of a nice-to-have and more of a must-have—table stakes, even. Customers are expecting more out of brand experiences than ever before. The digital-first, real-time, on-demand brands of the world have raised the bar. It’s your brand against every brand for your customers’ time, dollars and attention, not just brands in your industry.
But there’s no need to go into this challenge blind. Marketers must understand the power and promise of each messaging channel individually to build a comprehensive strategy. That’s why we’re excited to announce our new Braze Benchmarks Report, a new, interactive tool built to give you a platform-by-platform, industry-by-industry window into how global consumers are interacting with different messaging channels.
What is the Braze Benchmarks Report?
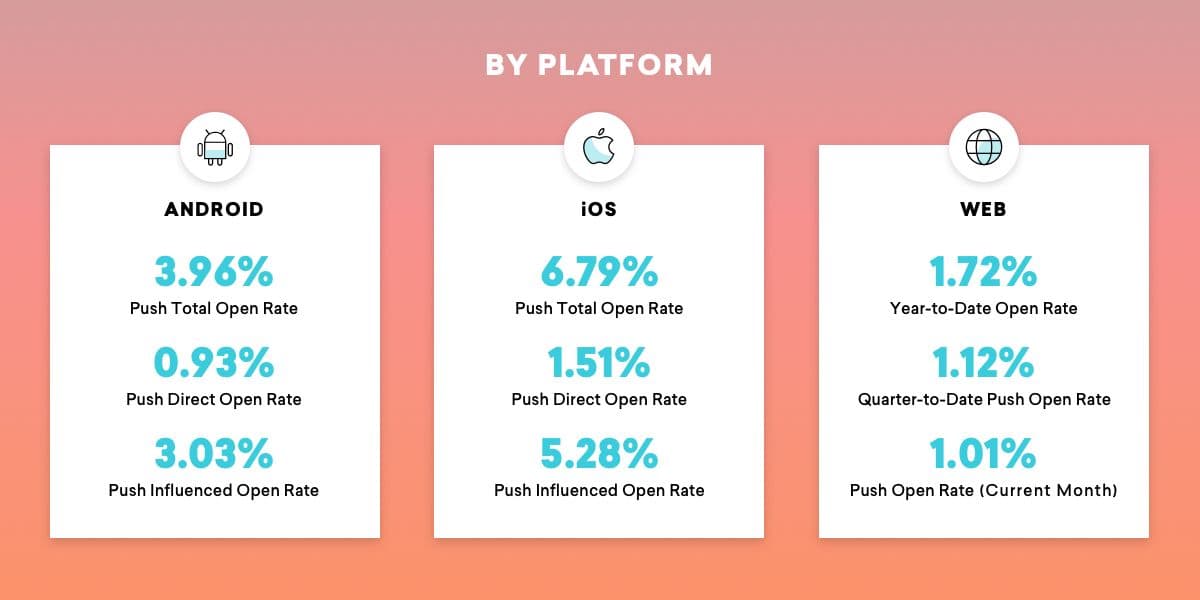
For any of you out there who have followed us since the Appboy days, our new Benchmarks tool is an updated version of our 2016 Digits Report, back—and better than ever!—by popular demand. This interactive report allows you to see metrics by channel (push, email), by operating system (iOS, Android, and web, where appropriate), and includes a breakdown of data by industry in the full experience.
Where is this data coming from?
Braze Benchmarks examines anonymous, aggregated mobile, web, and email engagement data from more than 600 brands across our EU and U.S. clusters to calculate monthly, quarterly, and yearly engagement rates by industry. These statistics span two years from the current date and include data from over 1,380,000 marketing campaigns. The report covers total open rates, direct open rates, and influenced open rates for push, as well as open rates, click rates, and click-to-open rates for email.
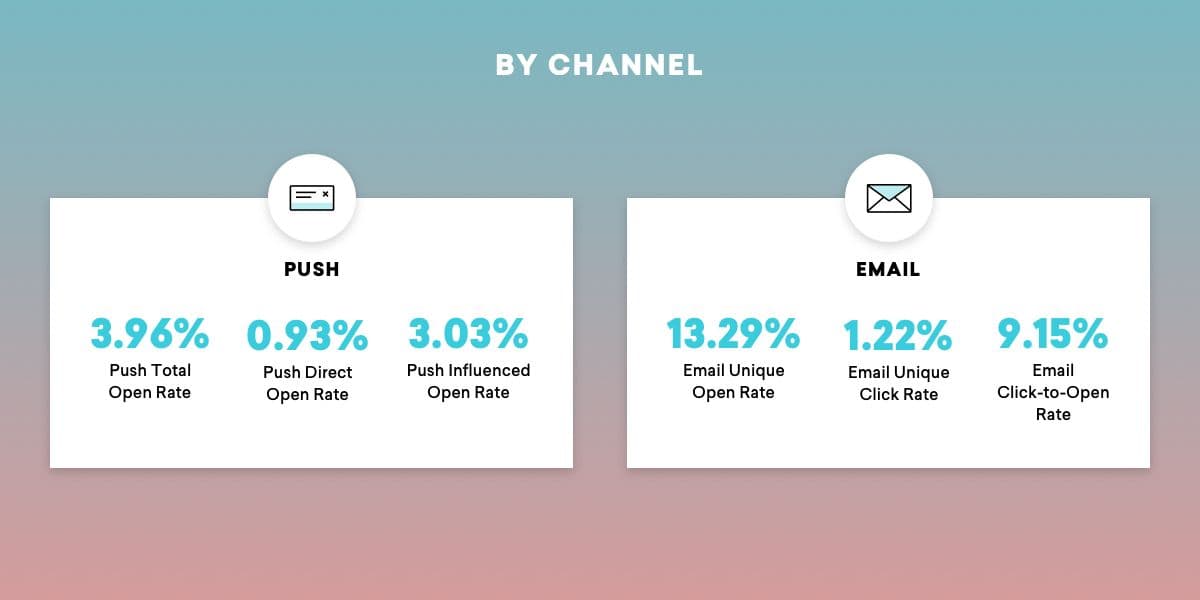
Engagement rates are calculated as total opens or clicks divided by total deliveries. Email click-to-open rate is calculated as total clicks divided by total opens. Unless we’ve otherwise specified, the single-value metrics represented in the Benchmarks website are year-to-date numbers. For your convenience, this data will be updated on a weekly basis, allowing your team continual access to fresh industry data over time.
This tool is a product of some incredible partnerships within our Braze Alloys framework. We collaborated with our partner Looker, which specializes in data democratization and visualization, to create embedded analytics that display the Benchmarks data on our backend and create a richer user experience. Additionally, through our recent partnership with data platform Snowflake, we are utilizing Snowflake’s Data Sharing feature, which will allow Snowflake customers and mutual Braze and Snowflake customers alike to gain instantaneous access to our Benchmarks data through a secure Data Exchange, enabling more customized benchmarks in their own reporting and analytics environment. We’ll also use Data Sharing to allow mutual Braze and Snowflake customers quick and easy access to the data they need from the Braze platform. This, in combination with our upcoming Benchmarks Looker Block that will mimic the functionality of our online Benchmarks tool, will allow teams to compare non-Braze or Braze engagement to Braze benchmarks, conduct what-if projection, set thresholds for alerting, and more.
How should I use this data?
We’re big fans of using data and technology to bolster your team’s creative and strategic thinking. Data like this is big for telling a full story and for understanding where your messaging is succeeding or falling flat. For example, we can look at push open rates all day—after all, they do tell us how many of your push notifications you sent were opened and can be a strong indicator of whether or not your messages resonated with people. You don’t really get the full story, though, unless you’re looking at direct and influenced push.
Let’s say your direct push rates on a campaign are a lot higher than your influenced push rates. That’s great! Your messages are encouraging people to engage in the moment. Take the momentum, and start optimizing to get your direct open rates even higher. Maybe your team decides to test the same copy, but to use some rich content like an image, GIF, or push action buttons to encourage people to continue interacting directly with the notification. On the other hand, let’s say you put out a push about a weekend sale and your influenced push rates are a lot higher than what the Benchmark data shows. First off, good on you for sending out a message that was engaging enough for users to think to go back to your app or site on their own. Use this success as data to back similar campaigns in the future, and maybe test sending some reminder pushes or cross-channel messages (like an email follow-up) to see if your rates improve even more when you give your users a little extra nudge. After all, Braze data tells us that engagement rates increase as much as 642% when you combine two or more channels.
Now, let’s talk about industry data. The value of this data is two-fold. The first is intuitive: Every industry has different customer journeys, different circumstances for communicating with customers, different products, different legalities to consider. A food-delivery service and an insurance company, for example, are going to have vastly different ways of communicating with customers from channel to frequency to tone of voice. That’s why it’s important to be able to parse out your industry’s data from others so that you can see the trends and the ways in which customers are and are not likely to interact with your brand.
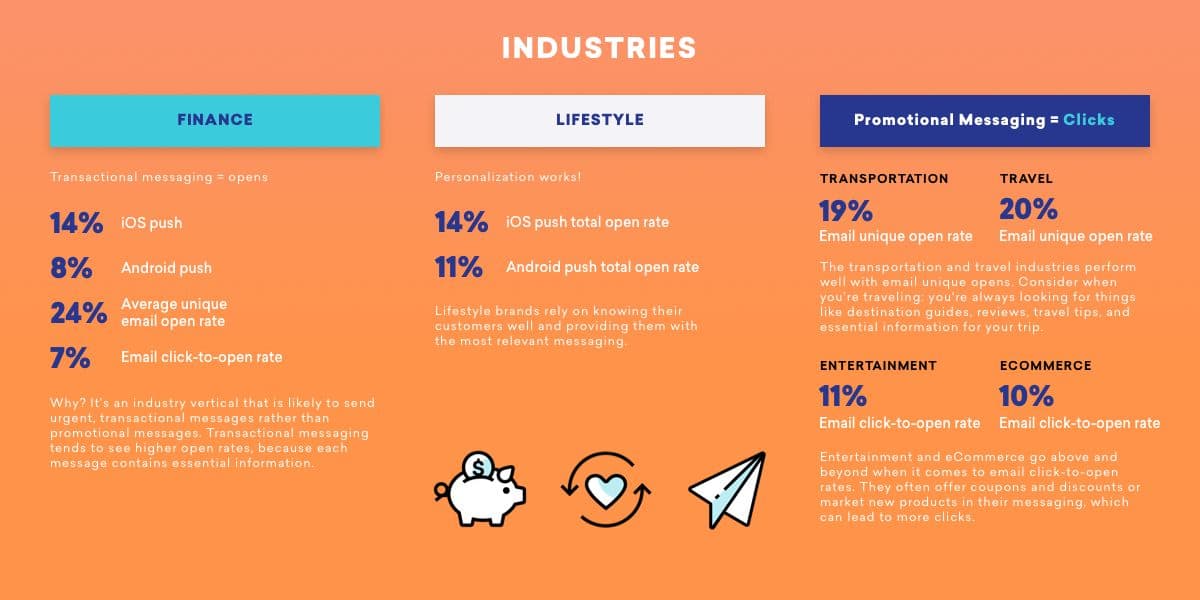
The second benefit of industry-specific data has to do with the way consumer expectations are changing. Modern digital-first brands like Lyft and Postmates have given customers a taste of what personal, real-time, responsive messaging feels like—and according to research conducted by Forrester Consulting on behalf of Braze, they’re 2.1X more likely to “love” brands who act this way, regardless of industry. So, here’s our challenge to you: Take a look at some brands whose customer experience really resonates with you, and do a little research through our Benchmarks tool to see how their industry’s engagement rates differ from yours. Then, get creative and do some testing to see if you can bring inspiration from other industries to stand out in yours.
Anything else?
This is just the beginning. The 2019 Braze Benchmarks Report is a visual, easy-to-use tool packed with the type of data that is foundational for creating brilliant customer experiences. Looking ahead, we’re excited to continue iterating on this tool and this data set, updating the data on a weekly basis, adding new metrics, and building out new interactive features.
Check out the 2019 Braze Benchmarks Report here.
Related Tags
Be Absolutely Engaging.™
Sign up for regular updates from Braze.
Related Content
View the Blog
The future of payments: Enhancing innovation and trust in a changing landscape

Erin Bankaitis

Multichannel optimization: Unlocking a more cohesive strategy for engaging customers

Team Braze

Customer engagement must-haves for peak shopping season