Trust, But Verify: How to Make Sure Benchmarks Are Really Saying What You Think They’re Saying
Published on June 28, 2019/Last edited on June 28, 2019/8 min read


Anna Mongillo
Business Intelligence Analyst at BrazeFor some creatives, “data” is a four-letter word. But the shortest path to failure for digital marketers is making decisions without the right data to guide your strategy.
Here at Braze, we know that some of the most essential information when it comes to customer engagement is benchmarking data—that is, industry-wide metrics that can help you set goals, better understand your vertical, and strategize across industries to make an impact on your bottom line. That’s a big reason we released our new Benchmarks tool, which uses aggregated, anonymized engagement data to highlight a variety of key indicators and performance drivers for messaging.
This type of data can provide immediate value for a brand, allowing marketers to make comparisons, determine criteria for improvement, scope out the industry landscape, make smart what-if projects, set thresholds for alerting, and more. Industry benchmarks are like a North Star for marketing, growth, and engagement teams. Or...they should be, if they’re used right.
To get the full benefit of benchmarking data, it’s important to take a critical look at what feeds into the data you’re using, the way that information is being represented, and how you should be using it based on your understanding of the data. That means skirting dodgy data interpretations that emphasize ease over accuracy. We know how tempting it can be to blindly trust these kinds of numbers, ask no questions, and move on. But it’s a lot smarter to dig into the data and make sure you know it well. Not to worry: we’ve compiled a list of key things you should think about when combing through benchmark numbers in an industry report.

Rates: Why They’re Like Comparing Apples and Oranges
Let’s talk about rates. Aggregate rates can be very misleading, especially if you don’t know exactly what you’re working with. So before you do anything: take a good, hard look at the methodology. It dictates how industry reports calculate their metrics, and, accordingly, how you should interpret the data.
There are a few ways you can report an industry-level rate. For Braze Benchmarks, we took a simple approach by calculating the aggregate rate, which is total opens or clicks divided by total message deliveries. This reports the rate for a given industry as though all messages were sent by one big sender.
It’s also possible to take the average of rates by determining the per-campaign rate and averaging it across campaigns for an industry. Alternatively, you could calculate the median rate by recording the rate reported by the 50th percentile (median sender) within an industry. None of these methods are right or wrong—they’re simply different. And each approach comes with its own unique set of implications.
Let’s look at a hypothetical example. Take the following sample numbers for “Industry X”:
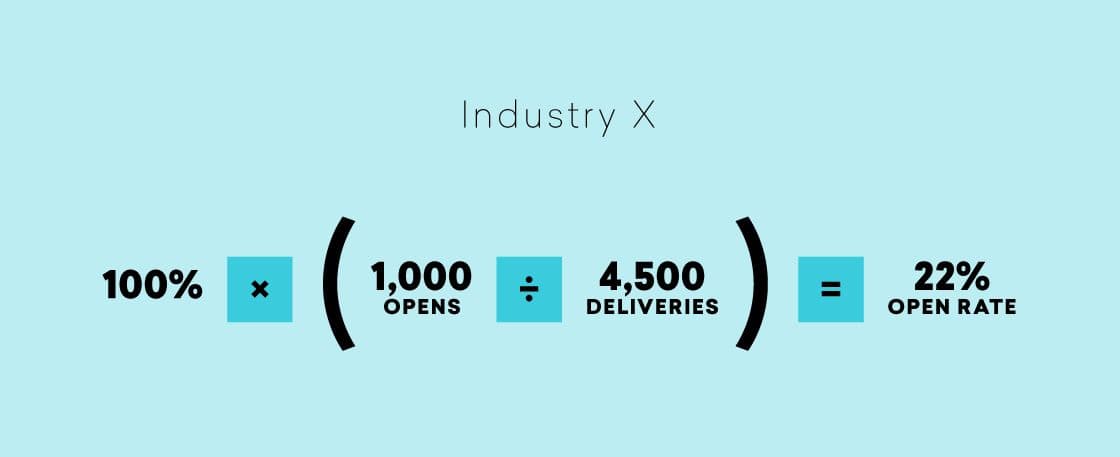
To get the aggregate open rate for this industry, all we need to do is divide the total number of opens by the total number of deliveries: 1000 ÷ 4500 ≈ 0.22, or 22%. But what if we decided to calculate this industry’s campaign-weighted rate instead?
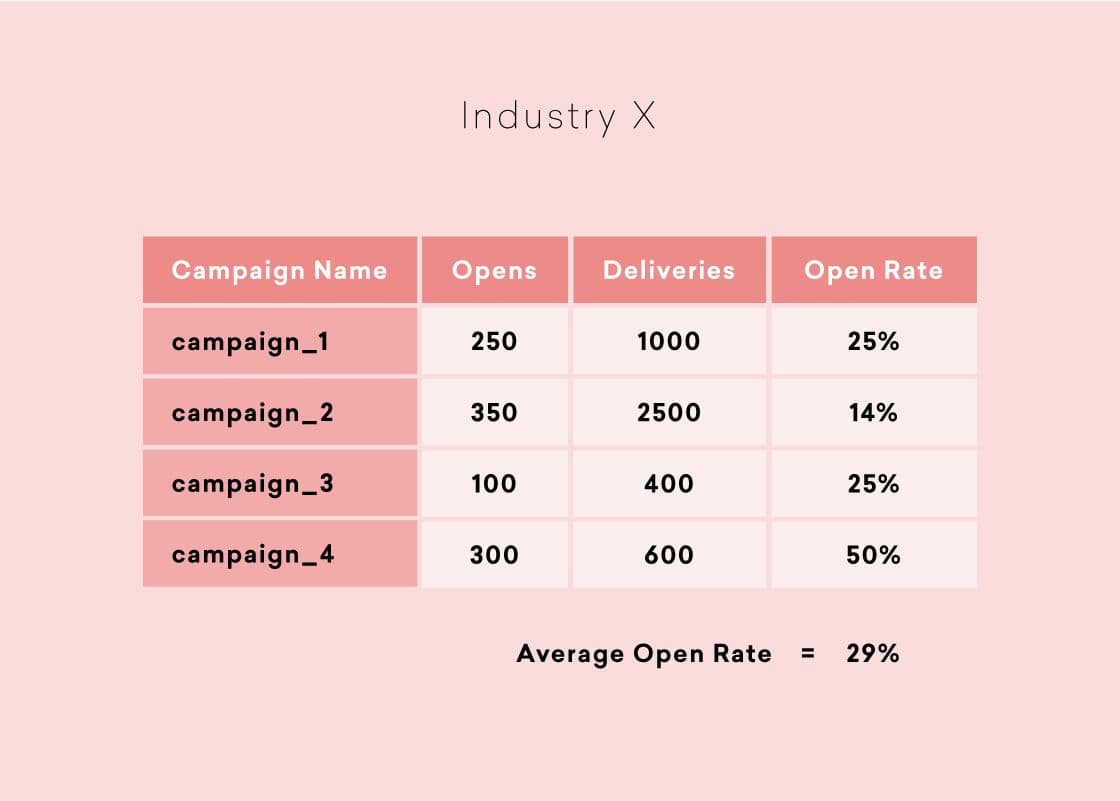
If we take the average of each of the above campaign engagement metrics across the industry—rather than just taking the aggregate rate from the sum of our opens and sends—we’ll see a pretty different result: (0.25 + 0.14 + 0.25 + 0.50) ÷ 4 ≈ 0.29, or 29%. That’s 7 percentage points higher than the simple aggregate rate. Why the discrepancy? It happens because this is a campaign-weighted rate; it’s affected by individual campaign performance, rather than by overall industry volumes.
There’s a similar dynamic at play when calculating the median rate. For this example, let’s imagine that there are three companies in this particular vertical:
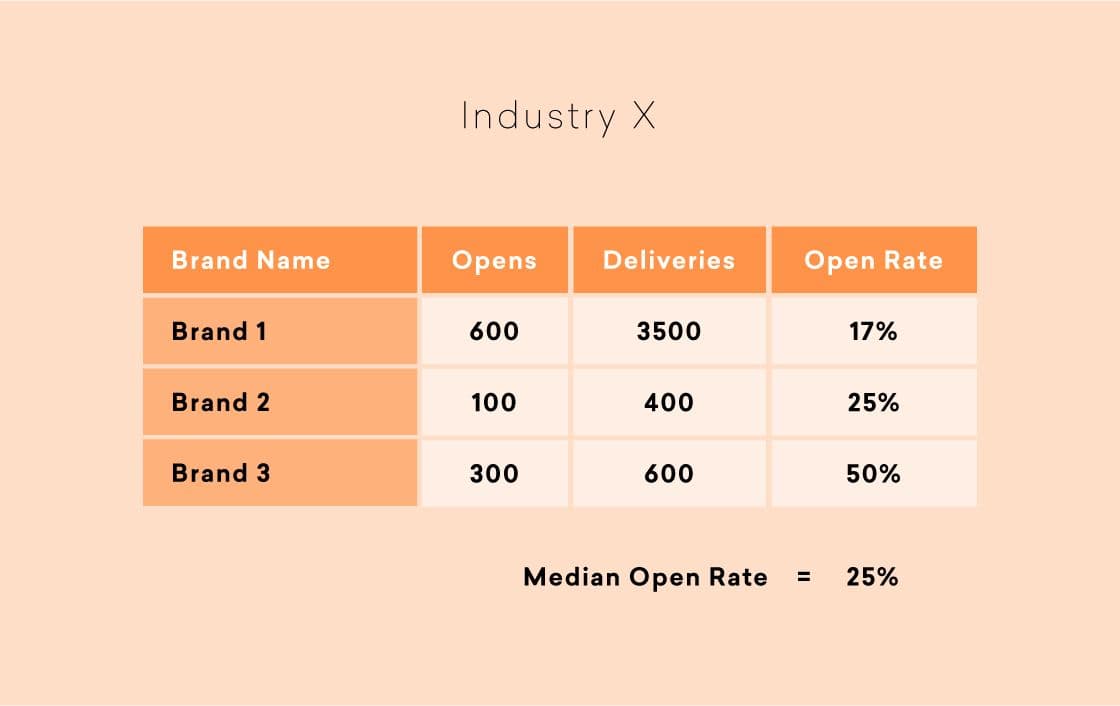
The median rate we’d calculate for this industry from the data above would land in the middle of the three company-level open rates: about 25%. That means that we can plausibly generate three potential benchmarks numbers with the same underlying data set: the aggregate open rate (22%), the campaign-weighted open rate (29%), and the median open rate (25%).
While none of these metrics are technically more accurate than the other, each number represents information about different things. The aggregate engagement rate might offer insights on how an industry is moving, trending, and changing as a whole. The campaign-weighted engagement rate could tell you how an average campaign performs within an industry. The median engagement rate may give you an idea of the average brand’s performance within an industry, for use in competitive analysis. The important thing is to understand what metric you’re looking at, and what it actually means.
Beware of Summary Numbers
The potential for error doesn’t end here. While reviewing the methodology and understanding what sort of rate you’re looking at is essential, there are some other intrinsic dangers to these sorts of summary metrics that are just as important to keep an eye on.
With industry engagement data like benchmarks, there’s a tendency to assume that when you aggregate data, you’ll end up with an average engagement rate—but that’s often not true. Combining the data does create an average rate, but it’s a weighted average, not a simple average. In situations where the groups that make up the data are unequal or uneven, trends that appear within different groups might change, disappear, or even reverse when data for those groups is aggregated to give an overall number.
Need an example? Let’s say a music streaming company—Brand X—is trying to reach customers with a promotional campaign and its marketing team found the following numbers:
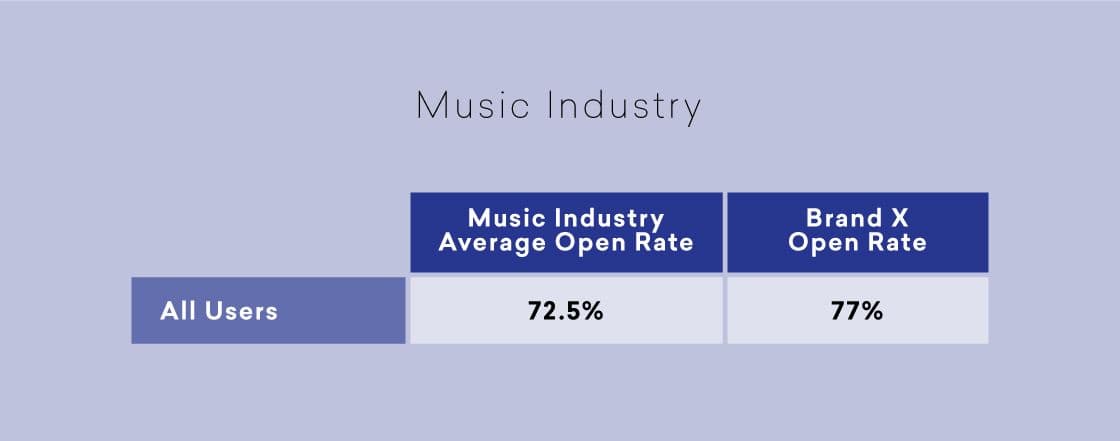
On a surface level, it looks like Brand X is outperforming the industry average when it comes to engagement on their messages. But what if we were able to dig into these numbers—say, by separating the data out by audience type?
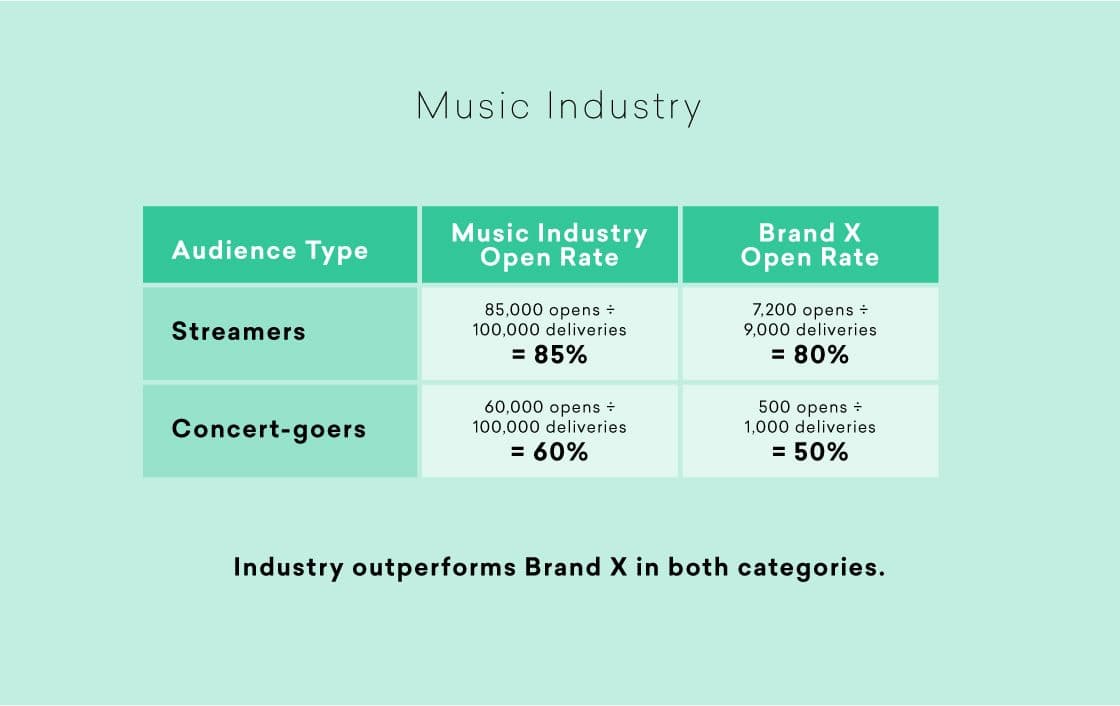
With this additional context, it’s clear that Brand X is actually underperforming on open rates relative to the industry as a whole! What’s causing this disparity? The uneven nature of the audience segments. Brand X has a much larger percentage of message recipients who fall into the “streamer” category than the industry as a whole—90% compared to 50%.
As you can see, it’s possible for these sorts of industry-wide metrics to be quite misleading. In this example, we can blame underlying factors—like audience composition—that are hidden by the aggregate open rate. But other things can also have an impact. Take the previously discussed campaign-weighted rate, for example. While this rate makes use of every element in the data set, it’s very sensitive to outliers, or extreme values. If one campaign performs very well or very poorly, the industry rate will be skewed, unless there are enough other campaigns to balance out the effects of that outlier.
So when you’re working with benchmarks, make sure you dig into how each methodology could be affecting the numbers you’re using, and be sure to optimize for a range of engagement metrics based on that knowledge.
How To Use Benchmark Data
Now that you have a better idea what the data you’re looking at might be telling you, how should you put this new knowledge to work?
1. Ensure you’re utilizing the data correctly for the particularly summary metric you’re using
Know whether you’re dealing with an aggregate rate, a campaign-weighted rate, a median rate, or some other calculation, and use them while keeping in mind your brand’s particular needs. For example, if you’re looking at a campaign-weighted engagement rate, compare it to your own campaign-weighted metric, not a simple aggregate rate.
2. Be wary of optimizing for an industry-level performance number
Working off aggregate user data can lead to poor marketing decisions, since your engagement metrics will vary according to customer segment. So segment your audience, test, and optimize accordingly. By segmenting your tests, you can identify the engagement rate of your target population, and understand what proportion of your visitors are in your target group. This will help you avoid aiming at non-target users and better engage your target audience.
3. Don’t limit your benchmarking activity to one industry
While it’s essential to understand how your industry performs, make sure you also reach beyond your own vertical and get creative with how you look at aggregated data. Maybe you can adapt a process or approach from another industry that’s performing better than your own—for instance, a travel brand might see success taking a page from a gaming brand’s playbook.
What Next?
Eager to put these suggestions into practice? Check out our new-and-improved Benchmarks tool, where you’ll find aggregated and anonymized industry-level metrics that update on a weekly basis. Use it in tandem with Snowflake Data Sharing, join it to your own internal data, and you’ll be well on your way to testing and iterating on your campaigns using trustworthy industry benchmarks.
Related Tags
Be Absolutely Engaging.™
Sign up for regular updates from Braze.
Related Content
 Article8 min read
Closing deals, driving growth for customers, and the team behind it: Life as an Account Executive at Braze
July 17, 2026 Article12 min read
BrazeAI™ marketing tools: The complete guide to AI-powered customer engagement
July 17, 2026 Article12 min read
AI email marketing: How to use AI to run smarter email programs
July 16, 2026