How the Super Bowl Changes Mobile App Use: Prep Now for February 5
Published on January 11, 2017/Last edited on January 11, 2017/4 min read

Team Braze
Every year, over a hundred million people tune in to the Super Bowl. And many of them have their smartphones in hand, actively using their apps during the game.
How can mobile marketers best prepare for this activity?
Appboy data shows that certain types of apps, such as food + beverage, gaming, travel + transportation, and social + messaging apps, see significant differences in use on Super Bowl Sunday than on other Sundays. Second-screen activity, such as ordering food during the game, hailing a ride home, and discussing the outcome with friends, are all markedly affected by this event.
Here’s what brands need to know to prepare for the increases (and decreases) in hour-by-hour app use on the big night.
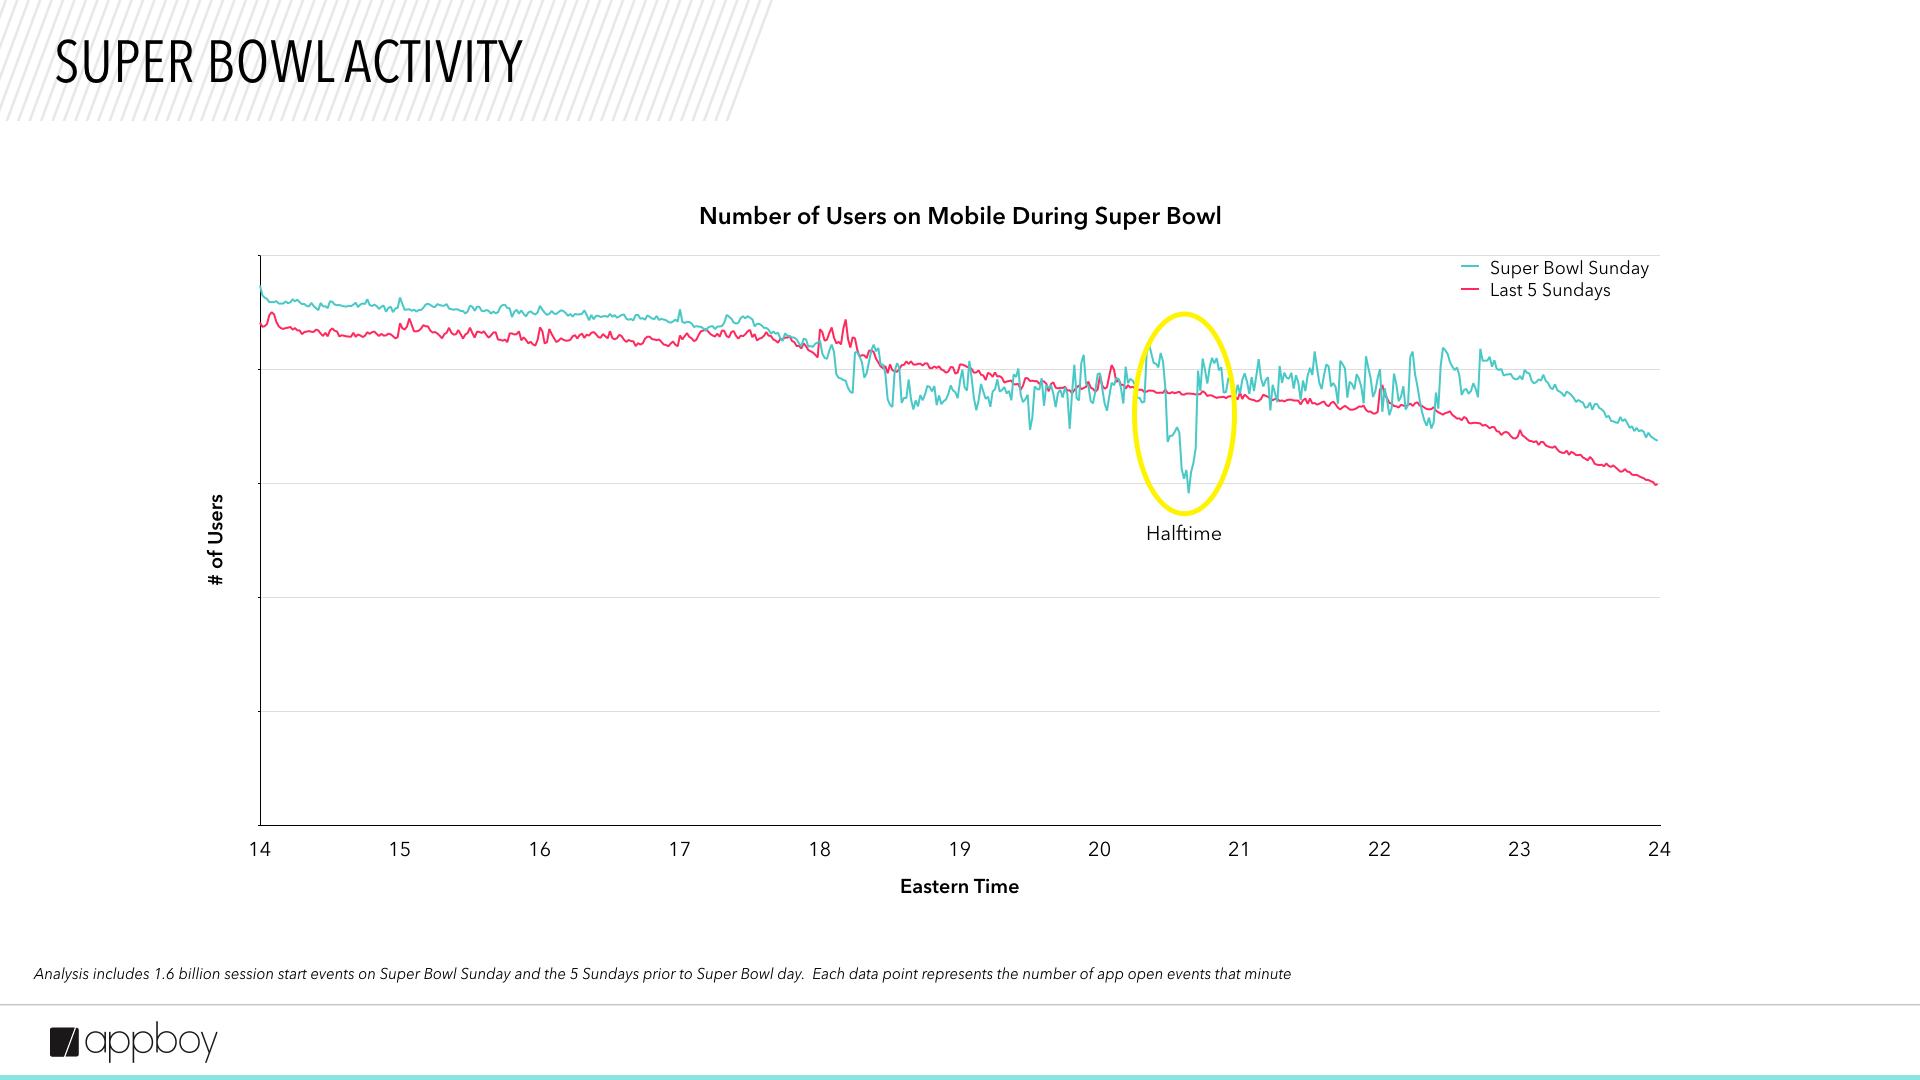
U.S. app use plummets during the halftime show
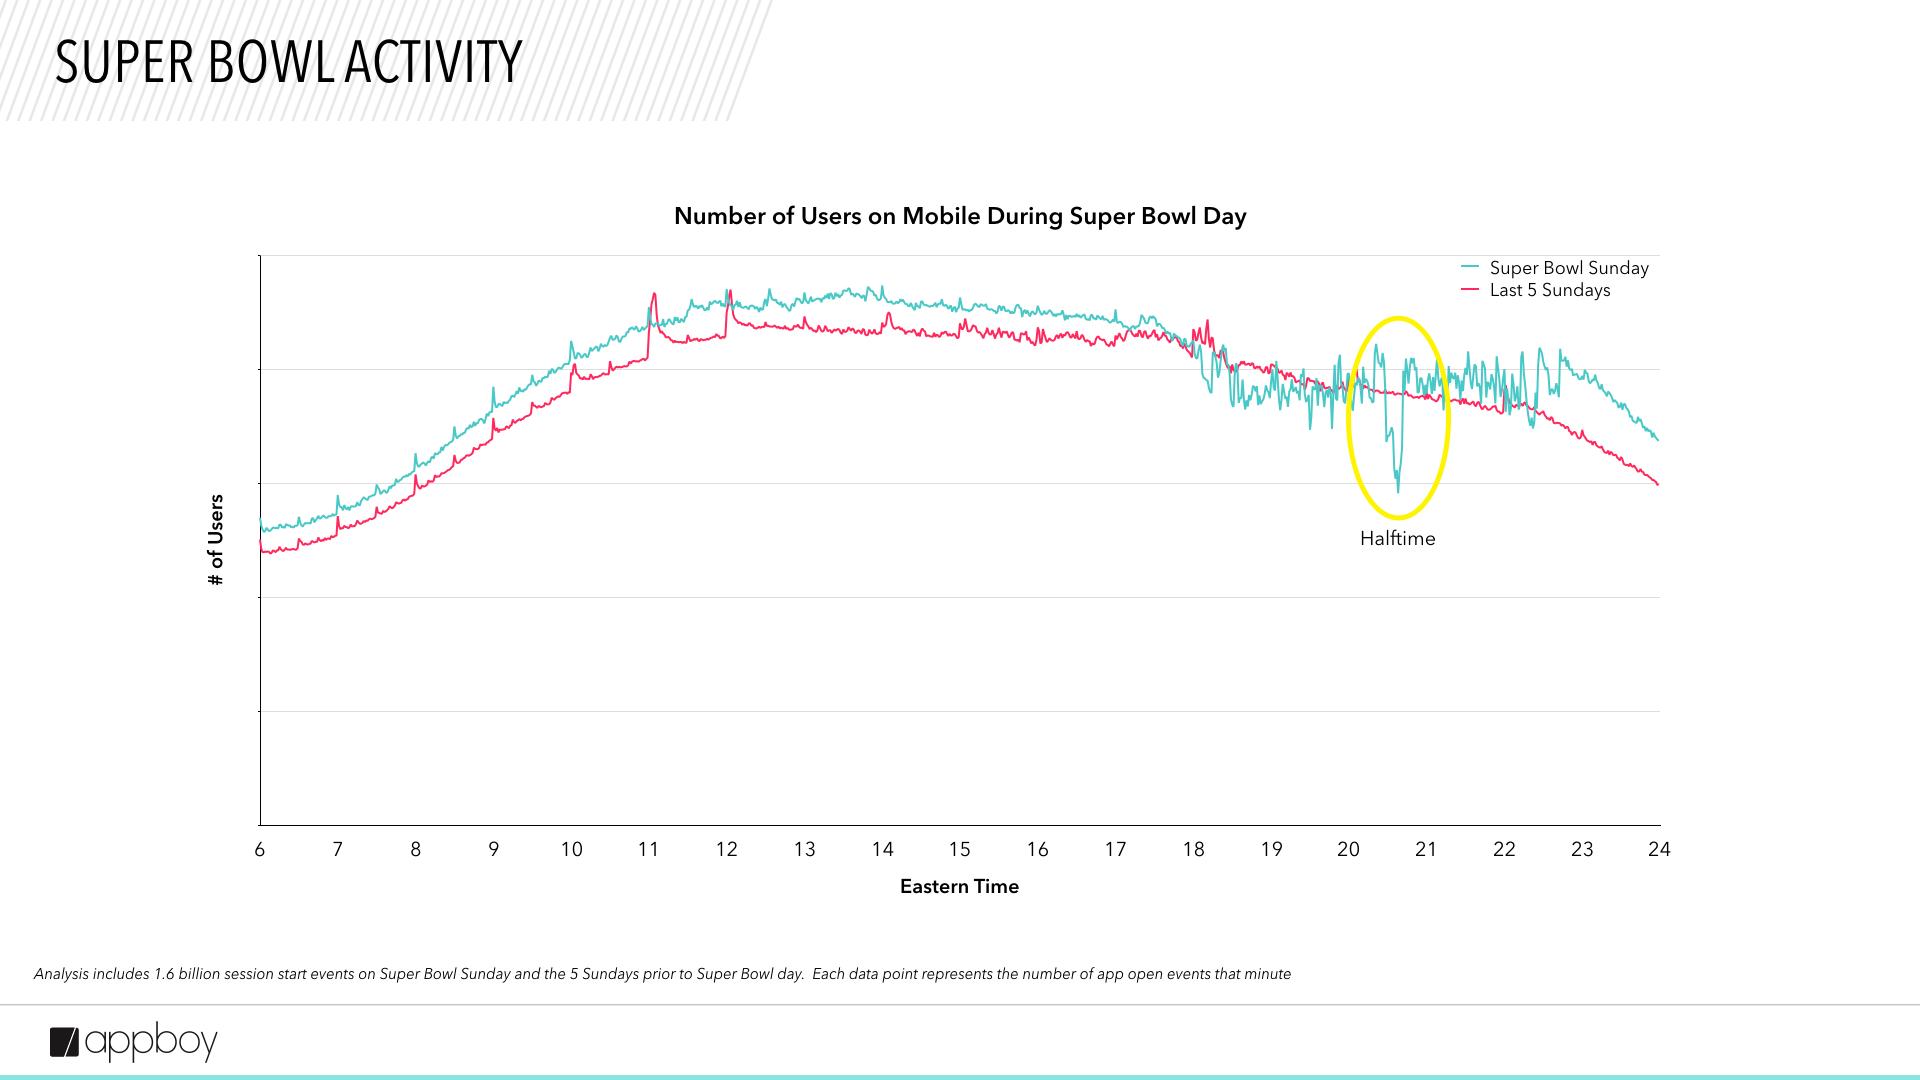
The most notable trend is the decrease in app use during the halftime show.
But to start at the beginning, when the game kicks off, the data shows that eyes are on the TV. Across all types of apps, Super Bowl Sunday sees a lower than average number of people on their mobile apps at 6 p.m. ET, compared to other Sundays. Apps can expect increasing activity throughout the game with an obvious huge shift of attention to the halftime show—as many as 23% fewer users during that time.
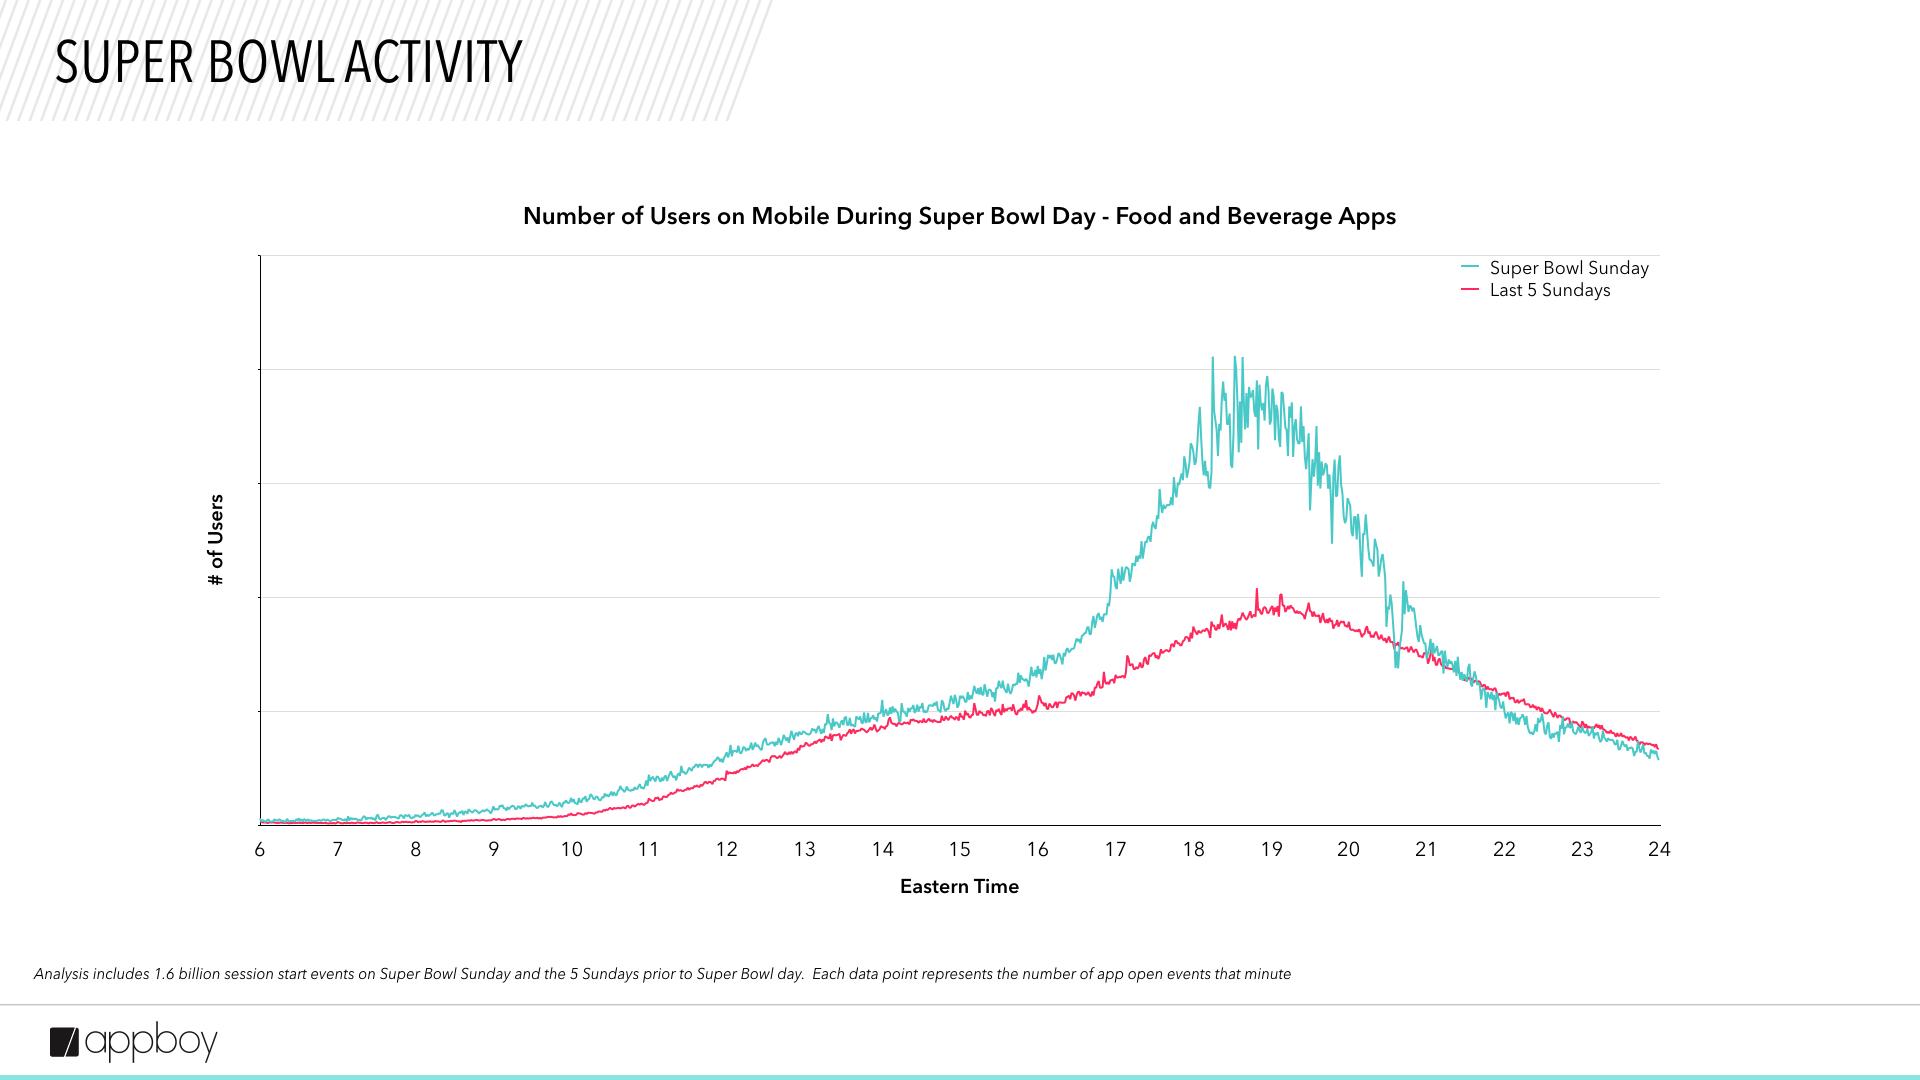
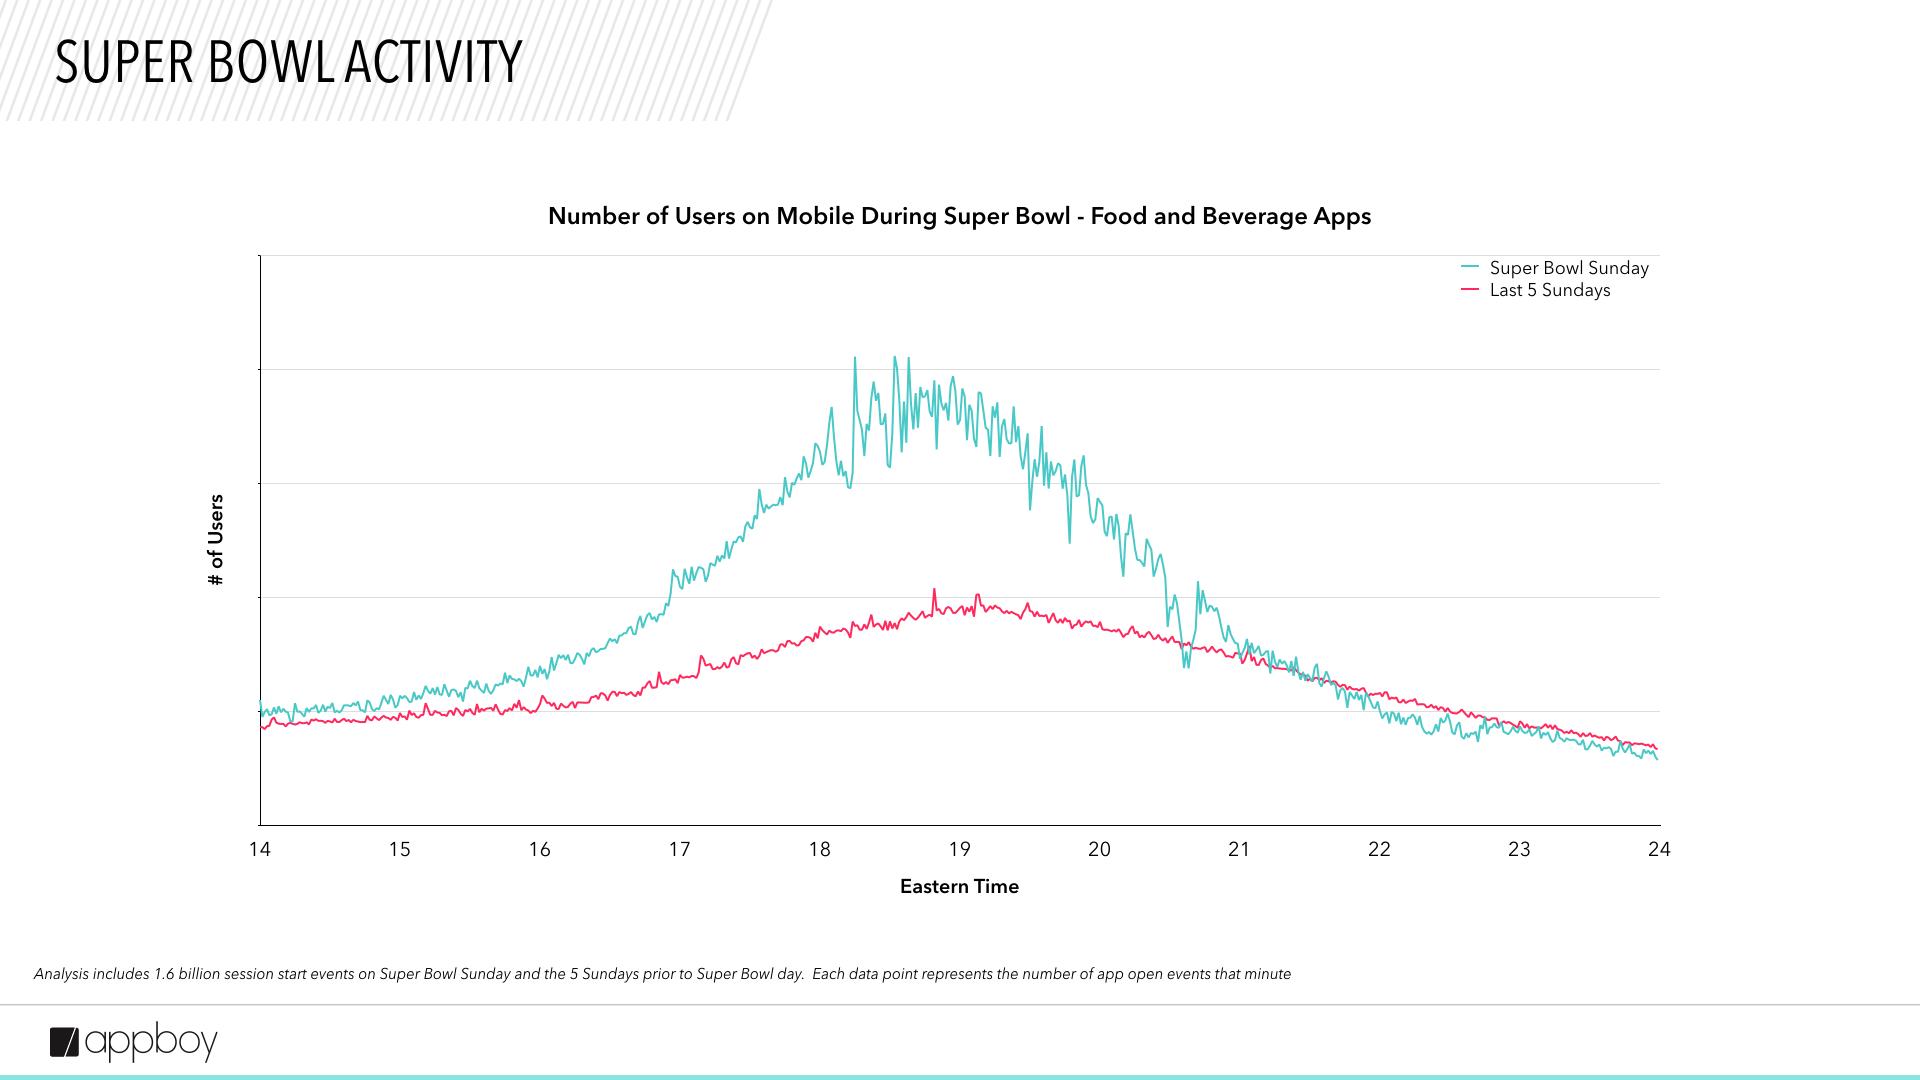
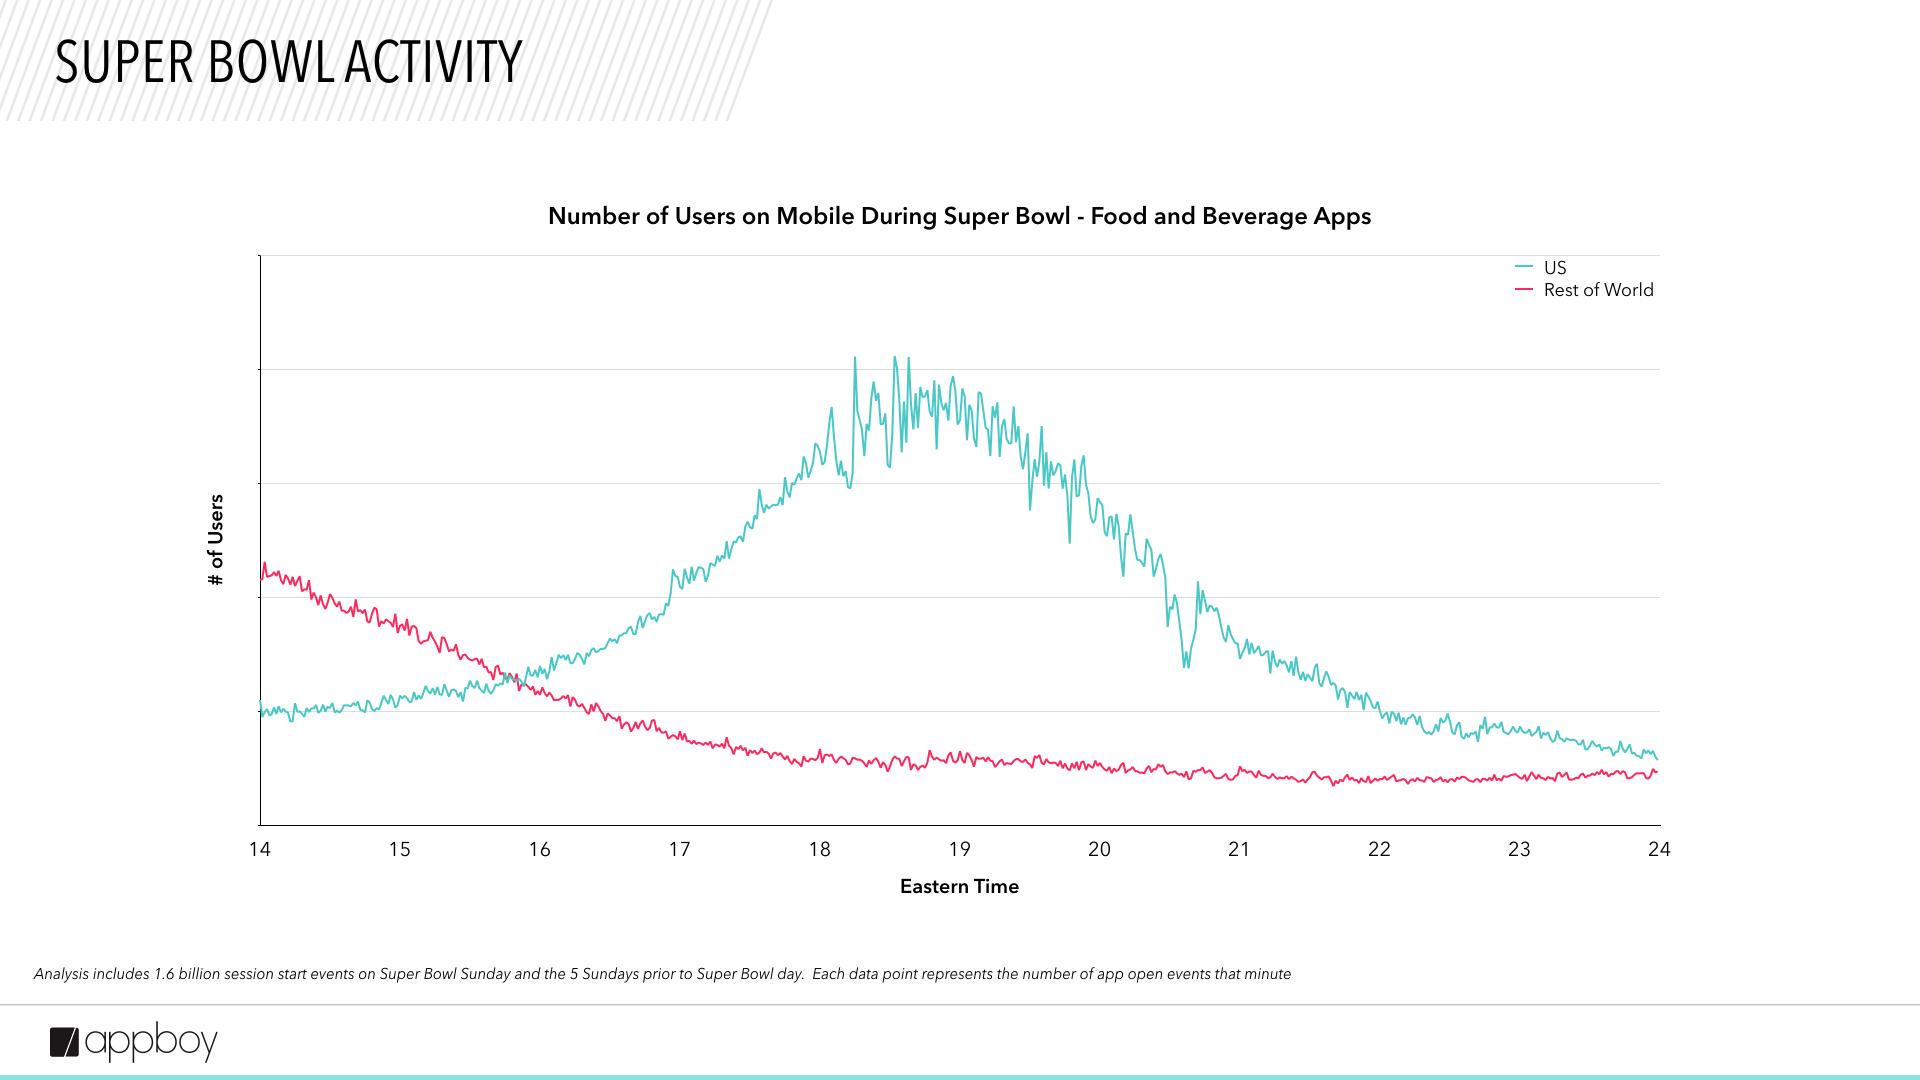
Food + beverage apps see huge increase in use before and during the game
The data for food + beverage apps shows a very obvious change in behavior from a regular old Sunday. Huge activity increases leading up to game time suggest that game watchers are ordering food for delivery before and during the game, at a rate that’s up to 135% higher during the 6–7 p.m. ET time block than other Sundays.
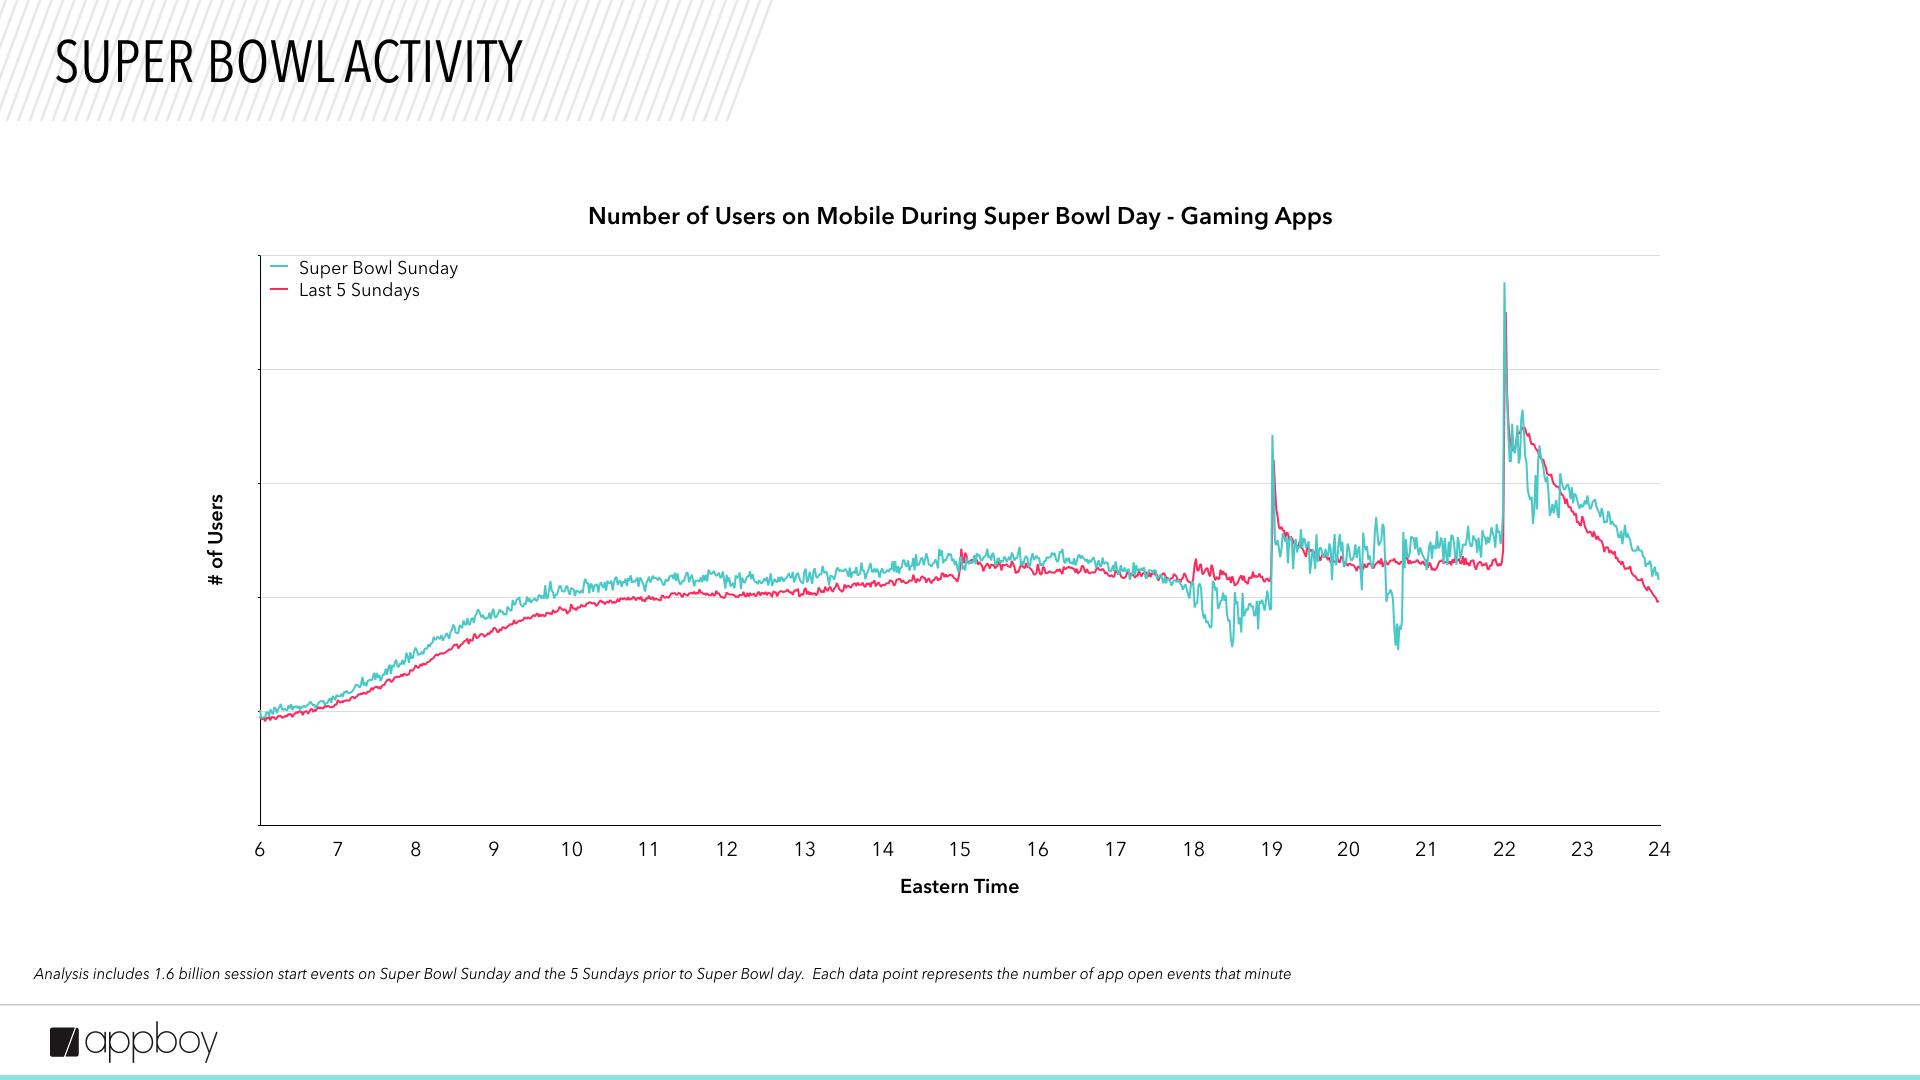
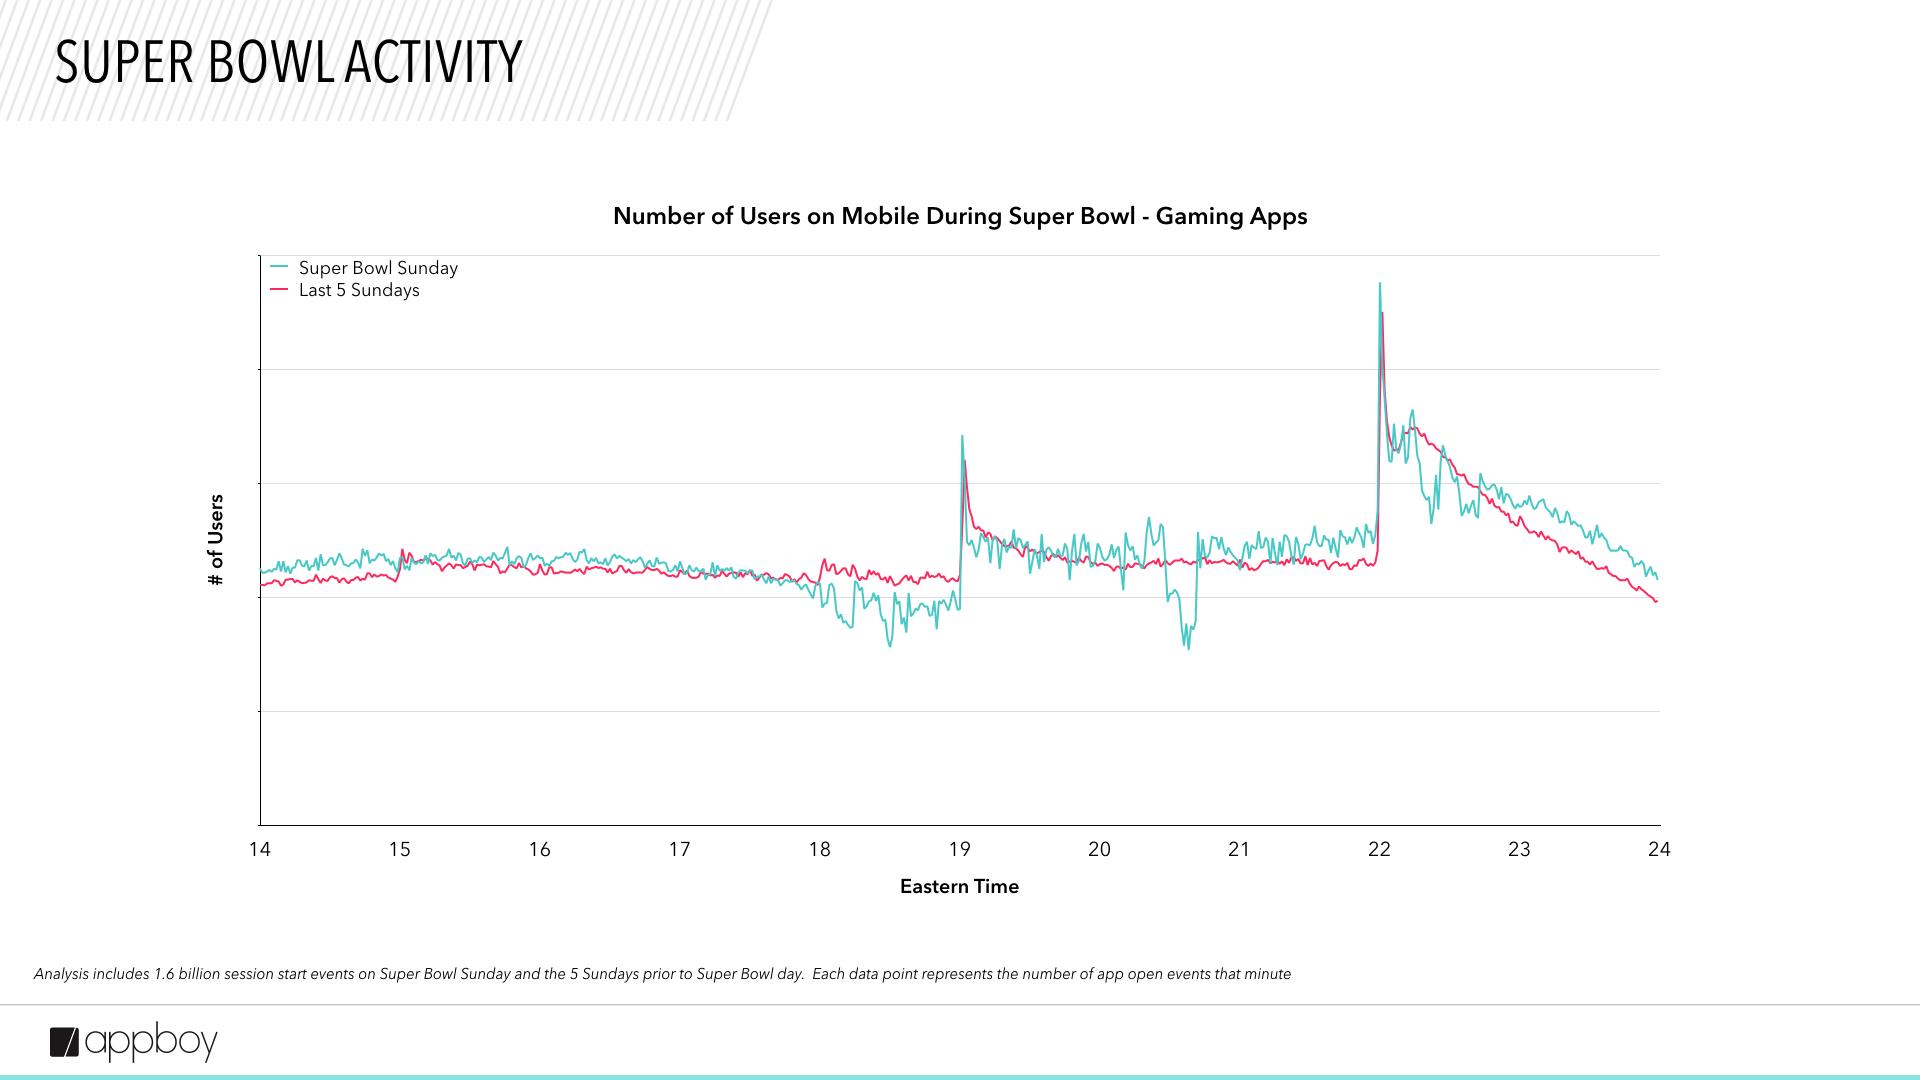
Gaming apps see less use at the beginning of the match and during halftime
When the big game starts, the handheld games see less action. Mobile gaming use is less in the first hours of the Super Bowl than it is on other Sundays. As the show continues, mobile games ramp back up to normal use, which could indicate that viewers are multitasking, or that people less interested in the Super Bowl (but hanging out with friends at a viewing party anyway) put their phones away during the beginning of the game and then pull them back out later, potentially as they lose interest. Like all other app types, gaming apps are used less during halftime.
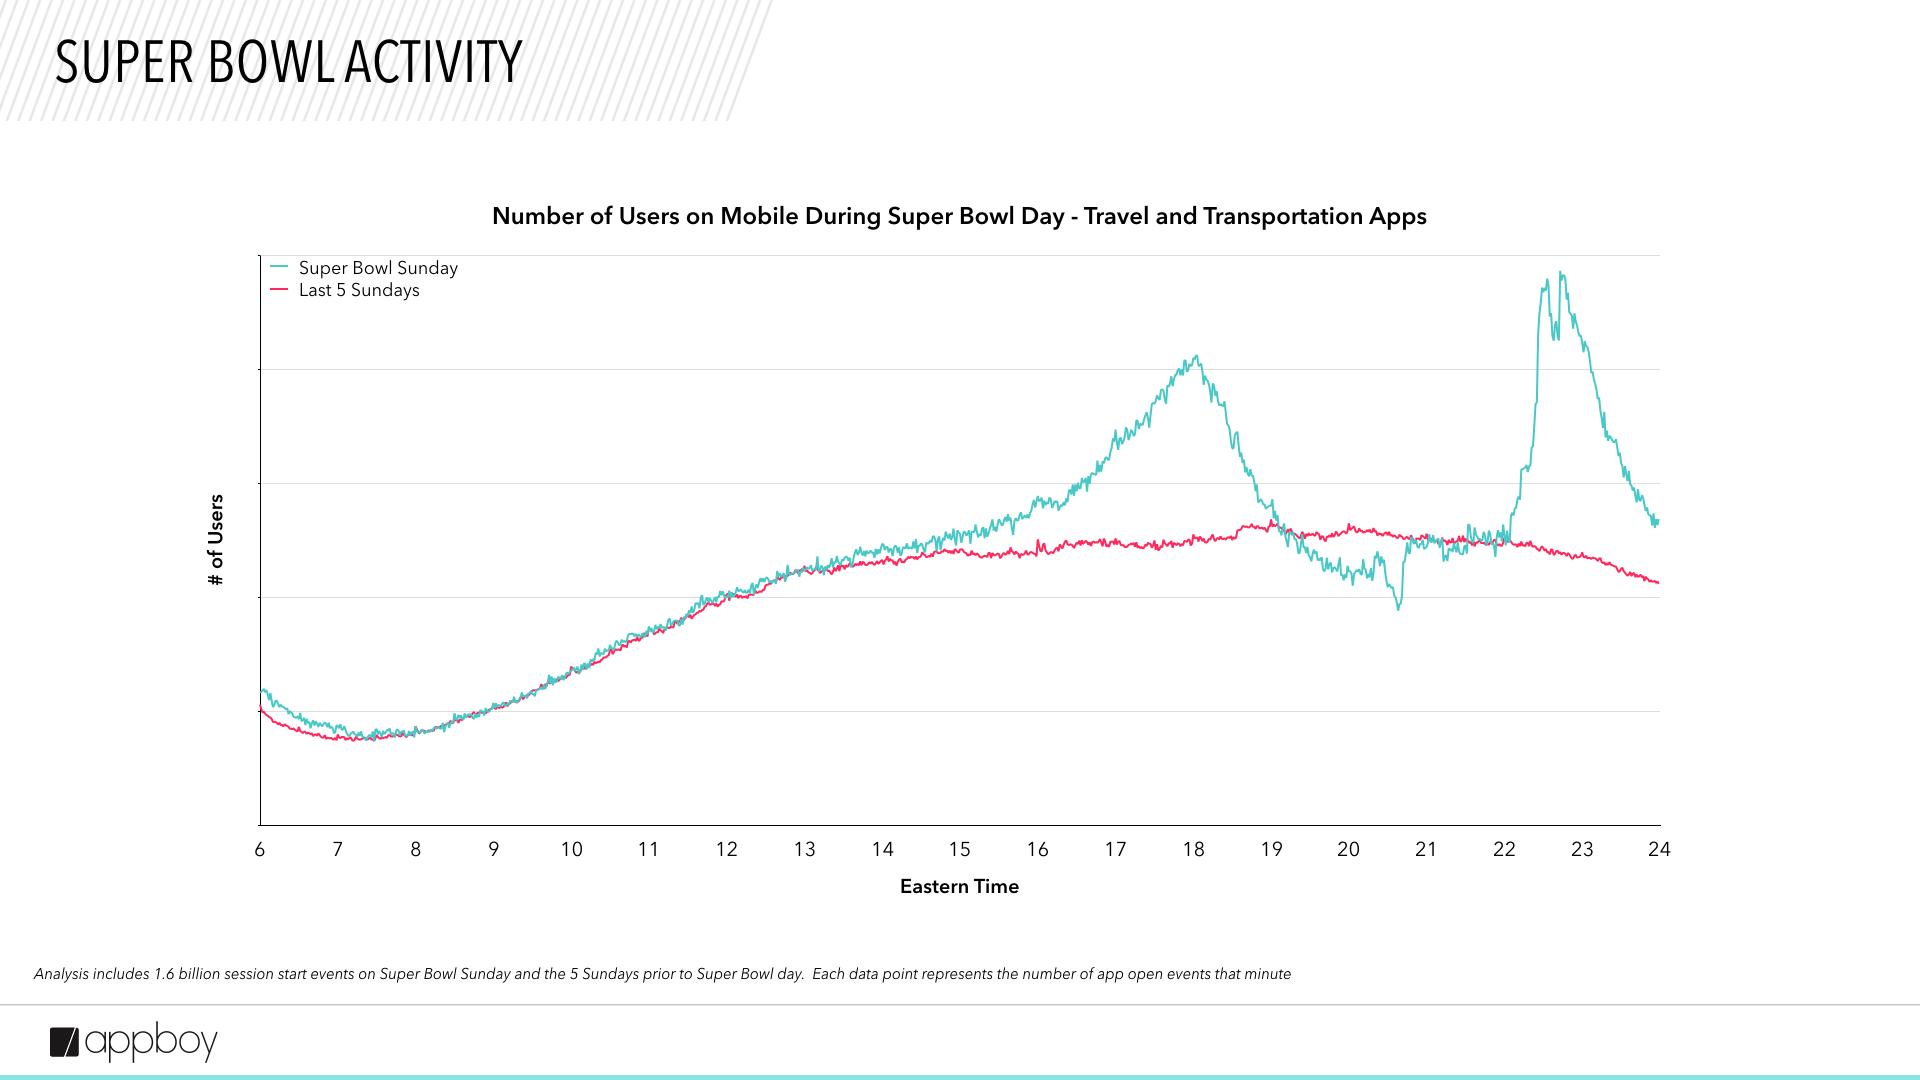
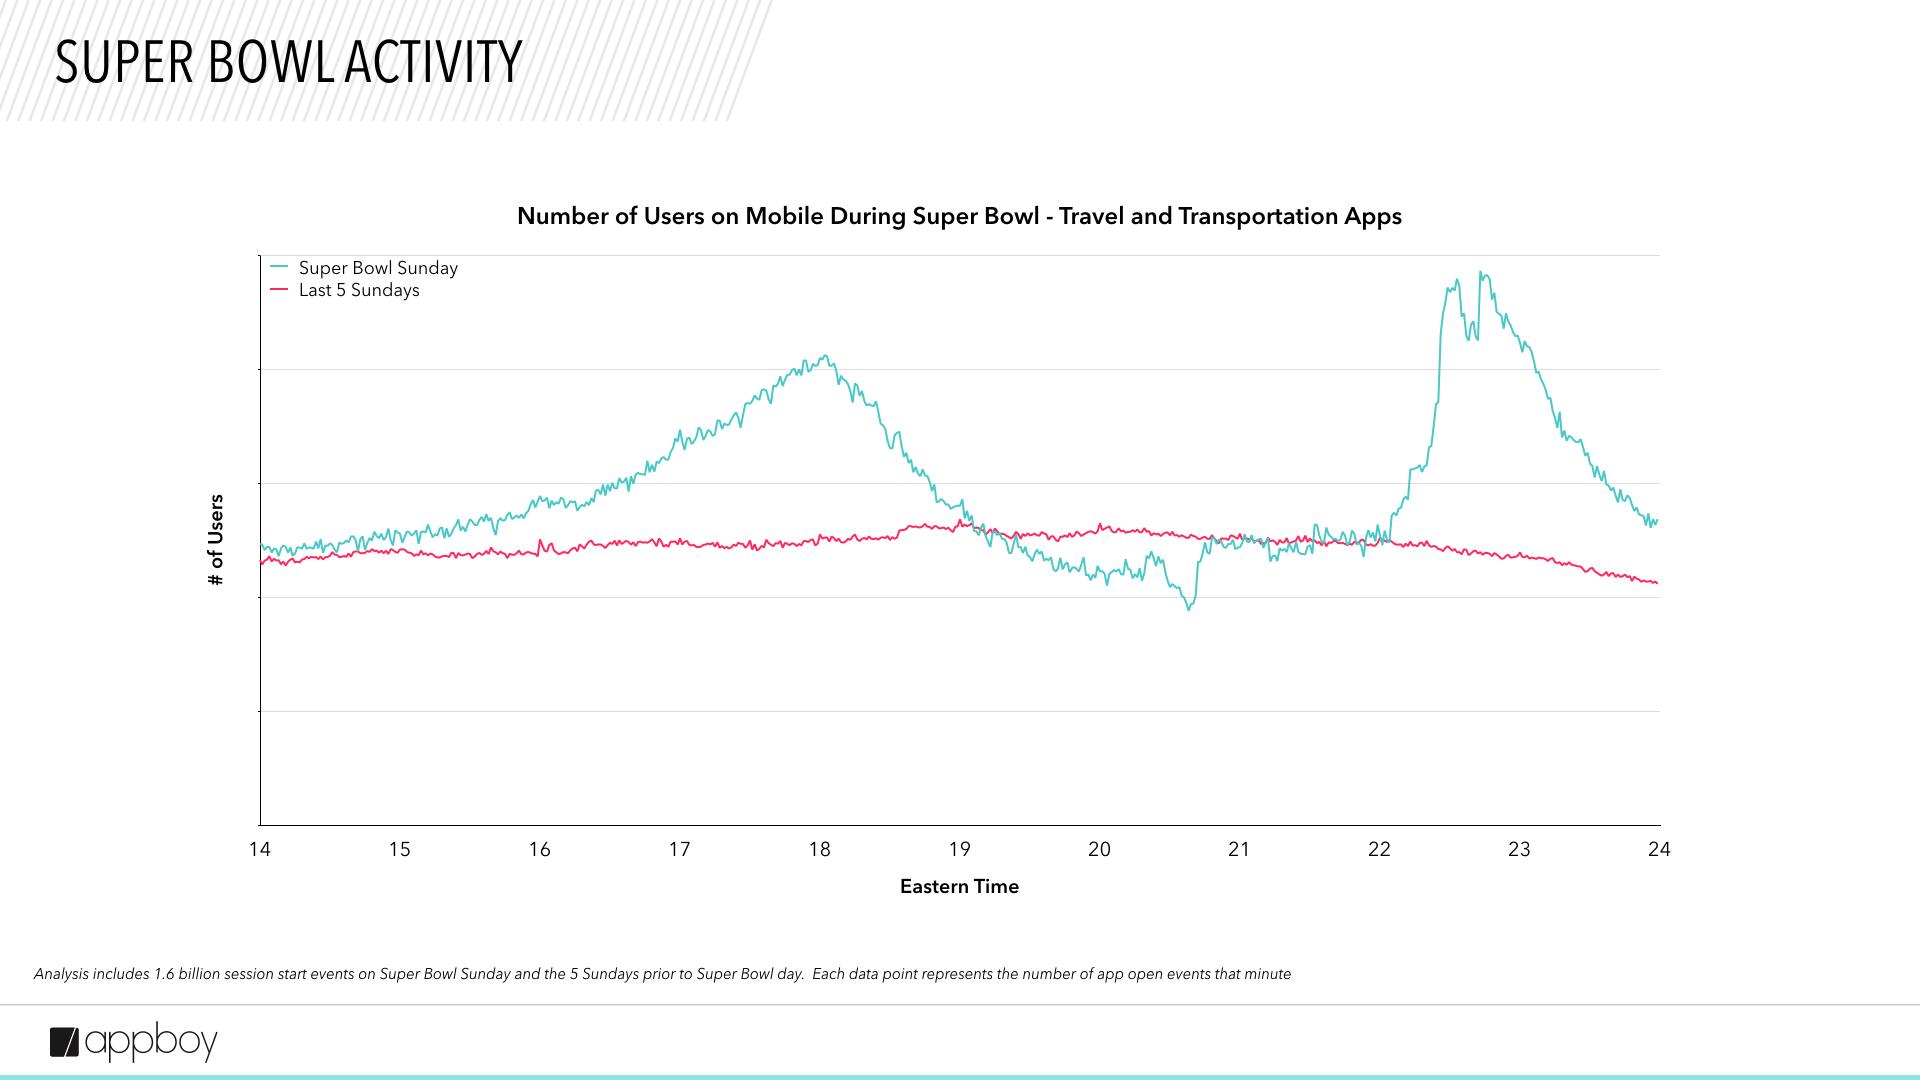
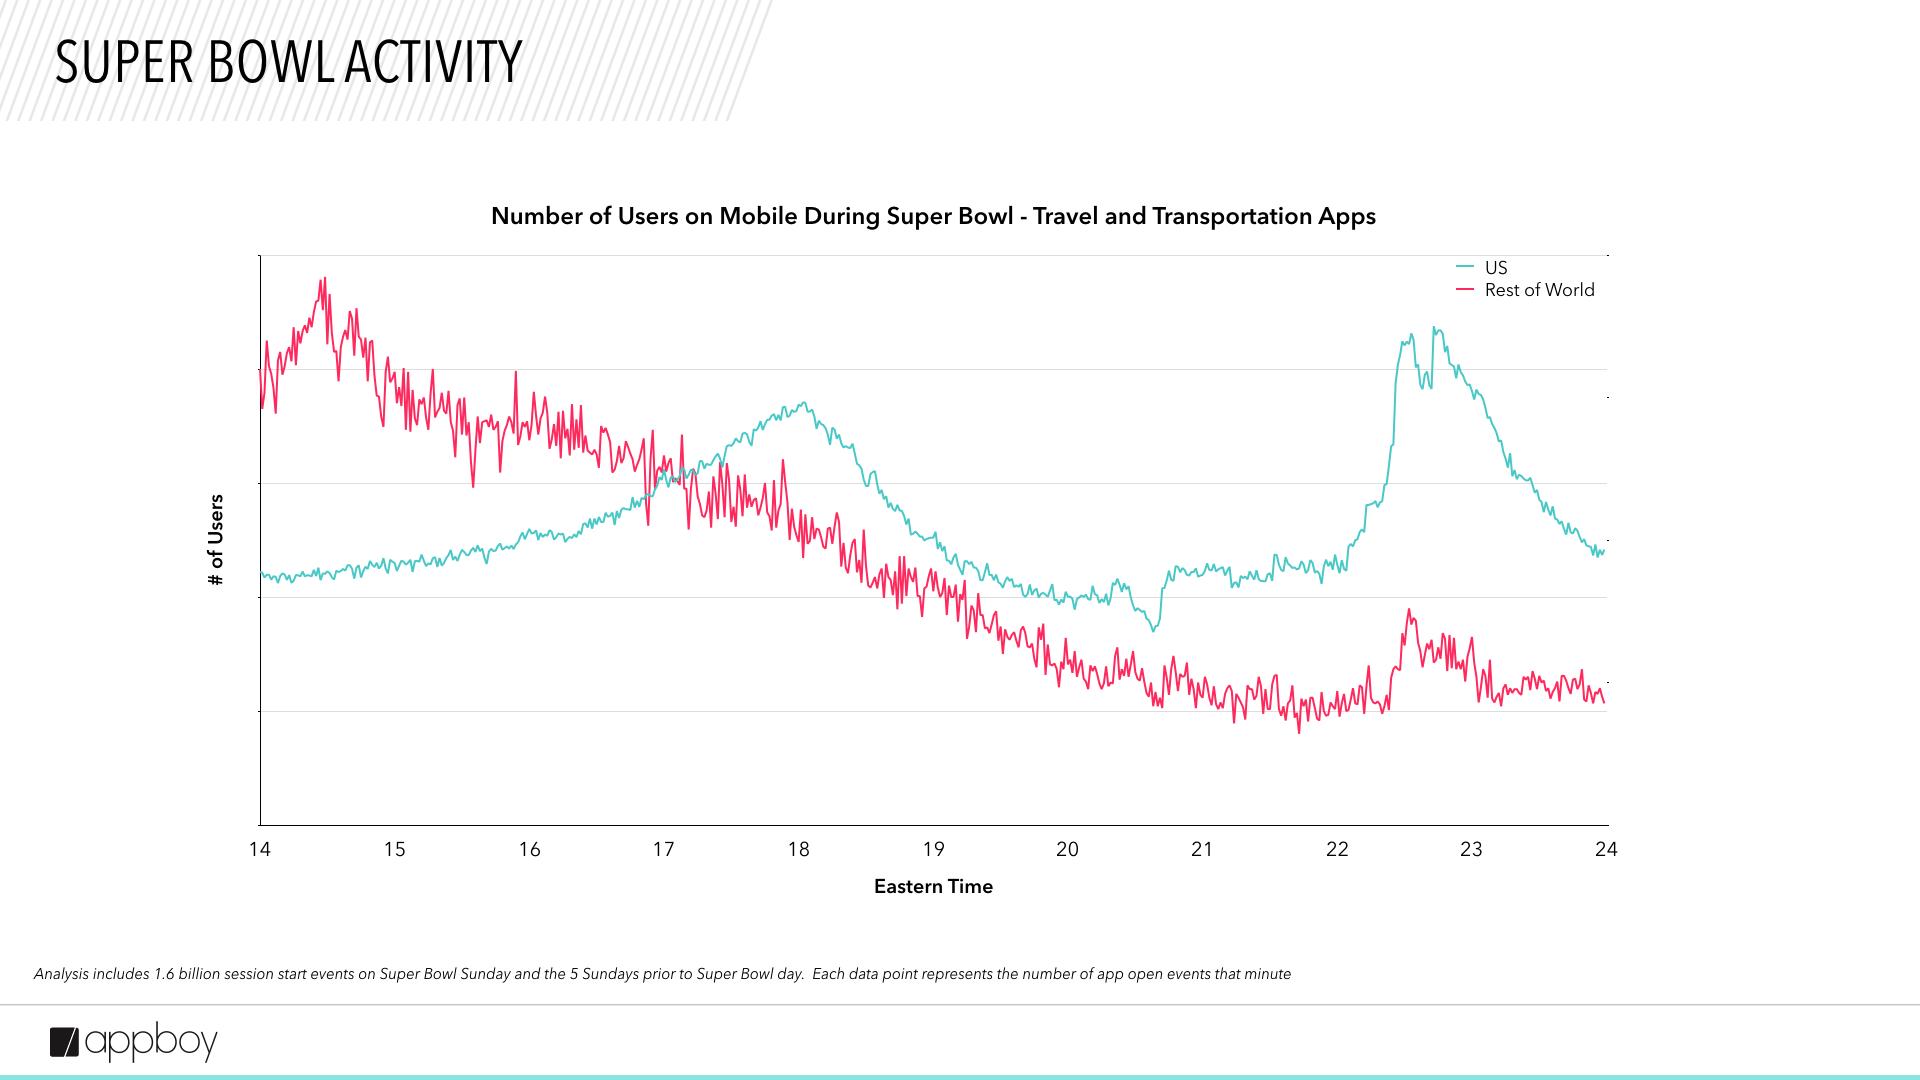
Travel + transportation apps are on deck for rides
The considerable increase in use of travel apps before and after the game suggests that viewers book rides to and from their Super Bowl-viewing destinations.
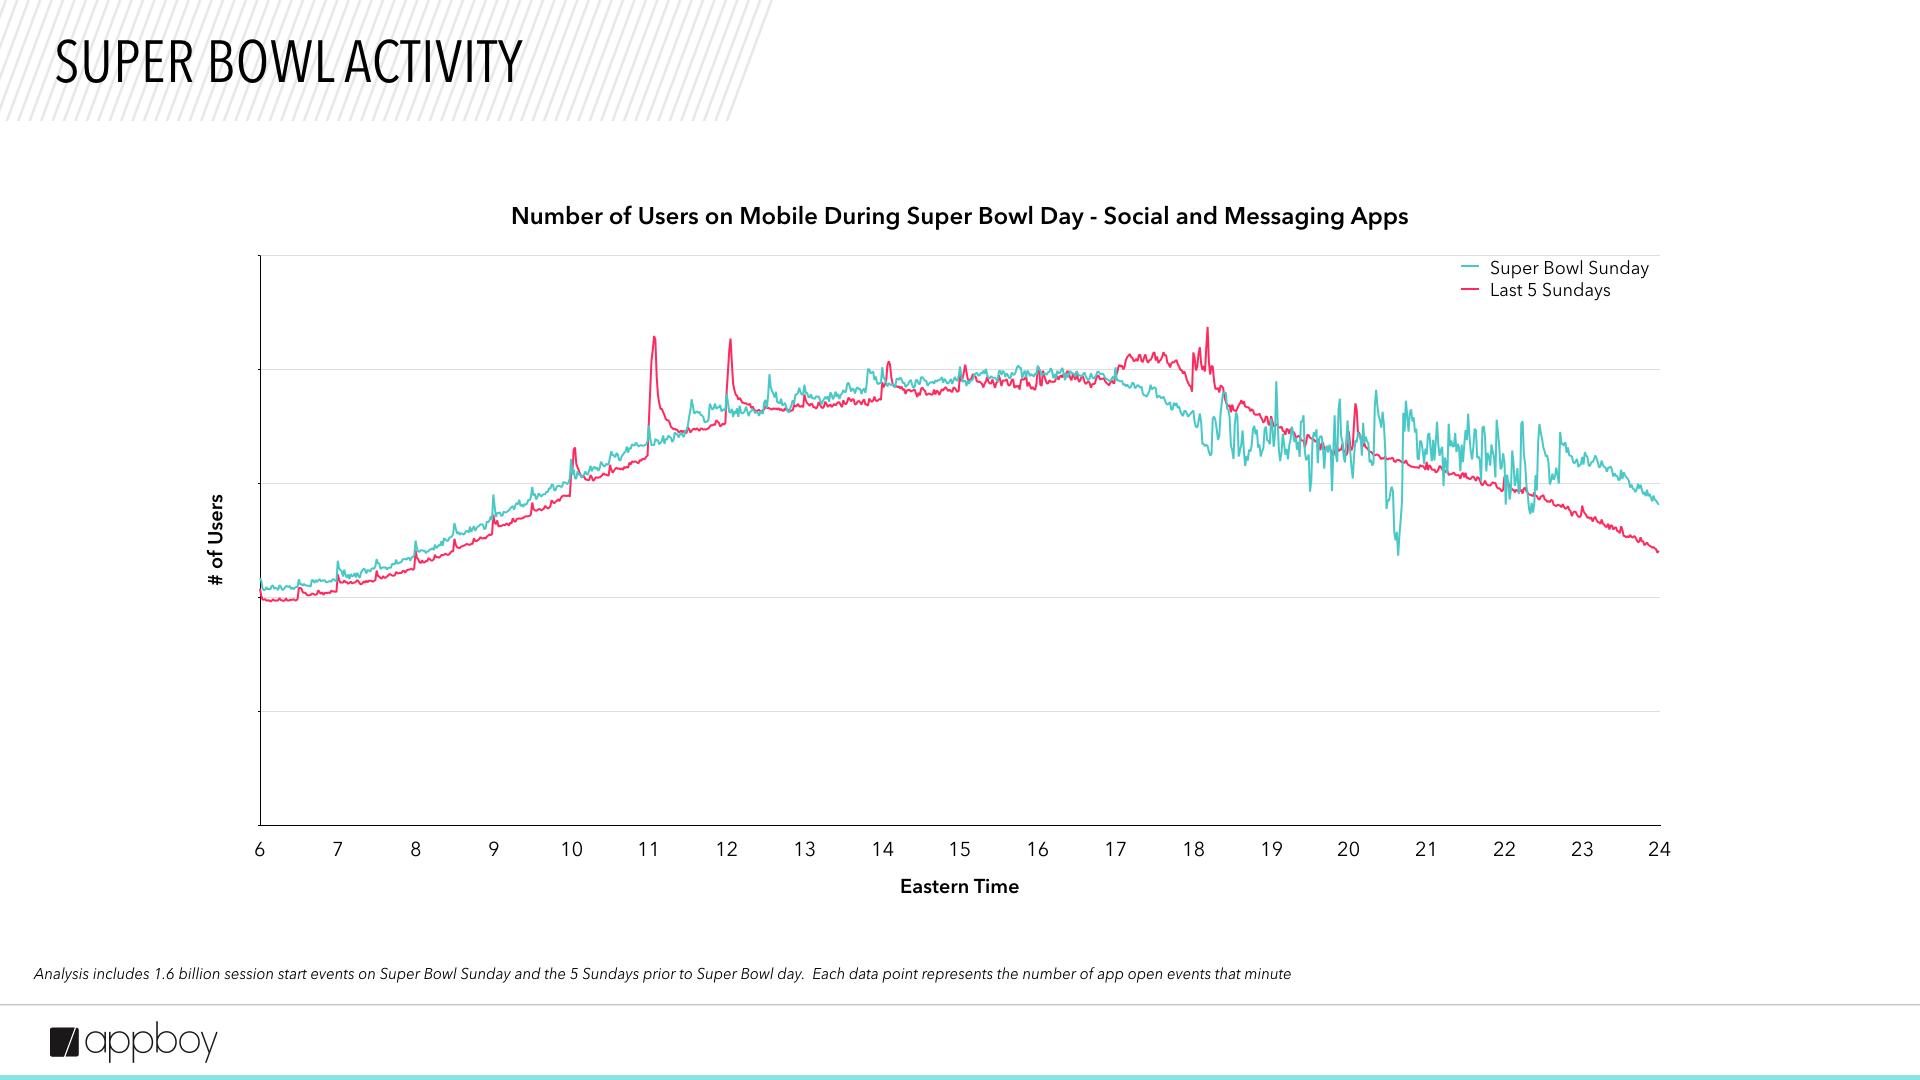
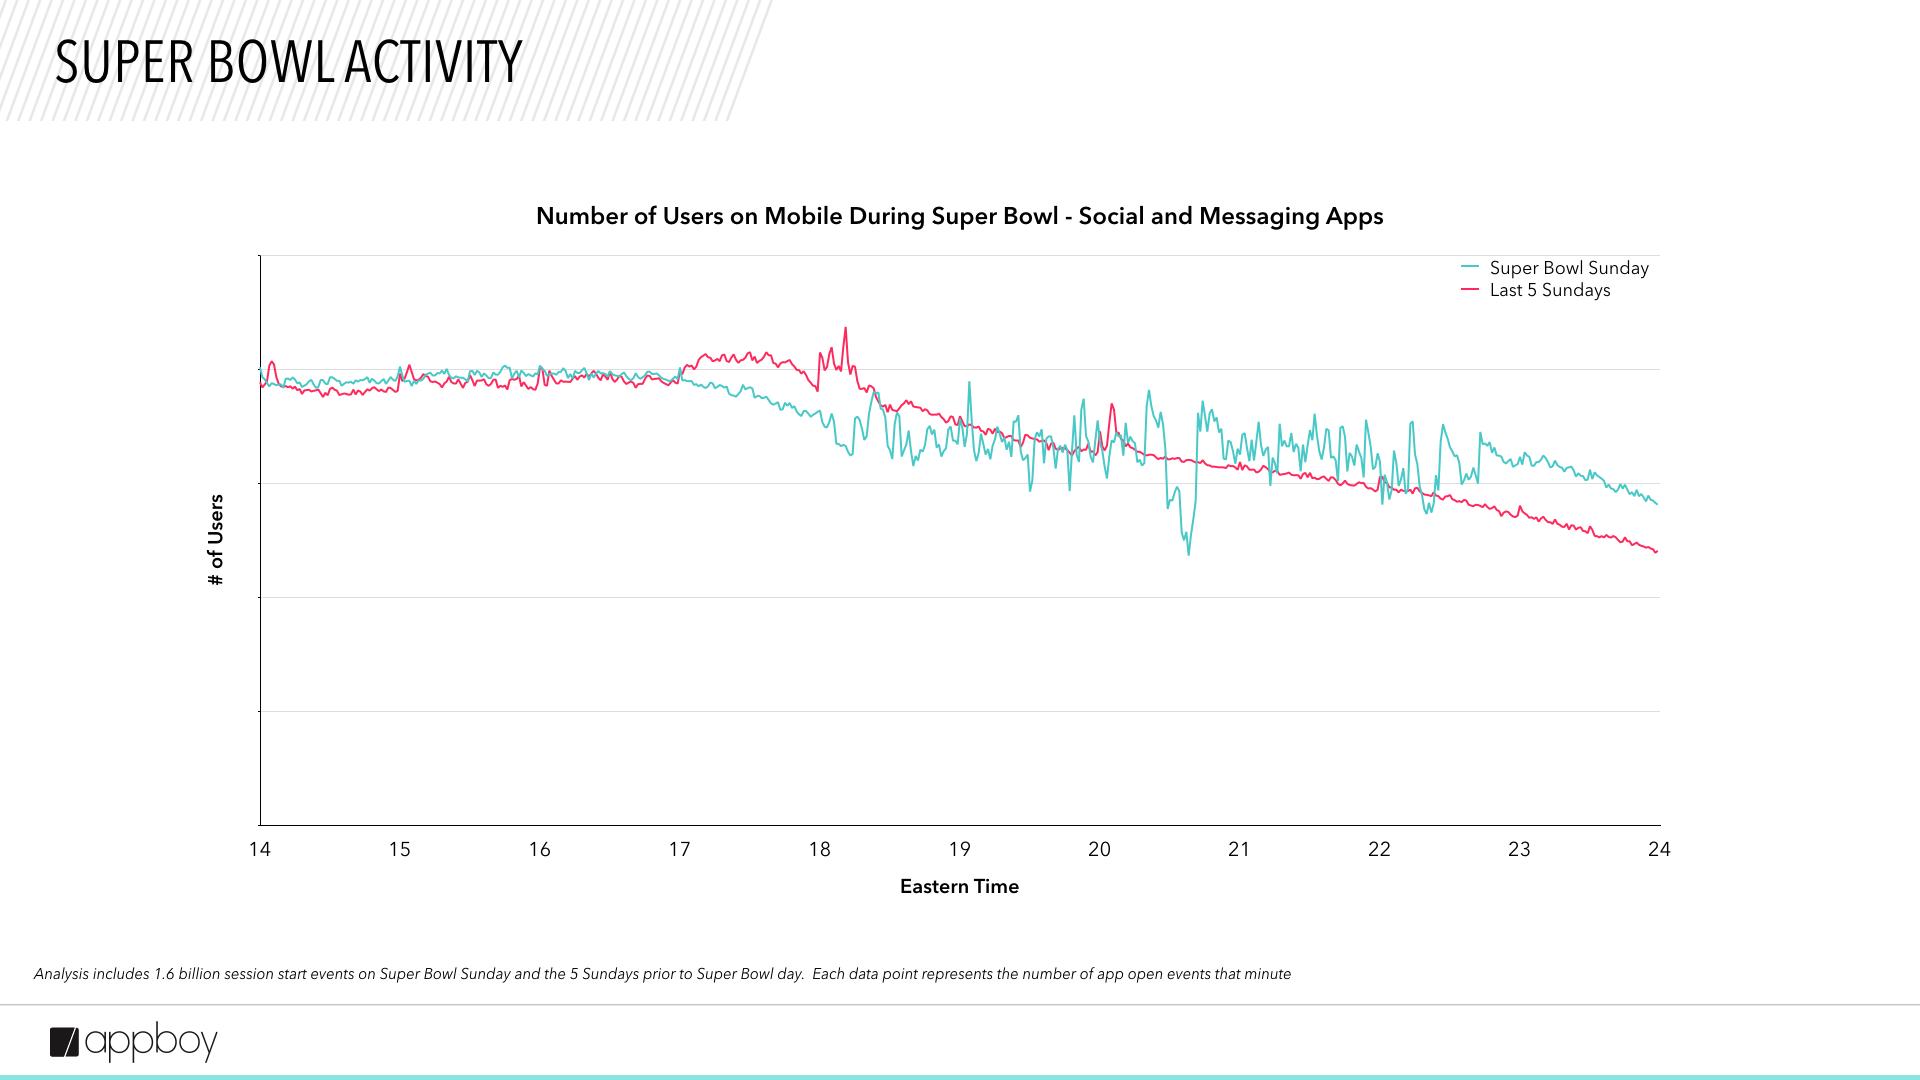
Social messaging continues further into the night than on other Sundays
The use of social media + messaging apps on Super Bowl Sunday begins similarly to a regular Sunday—until the overall slump during halftime, and then things get interesting. App users chat and message longer into the night than usual, indicating that Super Bowl viewers are discussing the game (and maybe that halftime show that caught everyone’s attention, too).
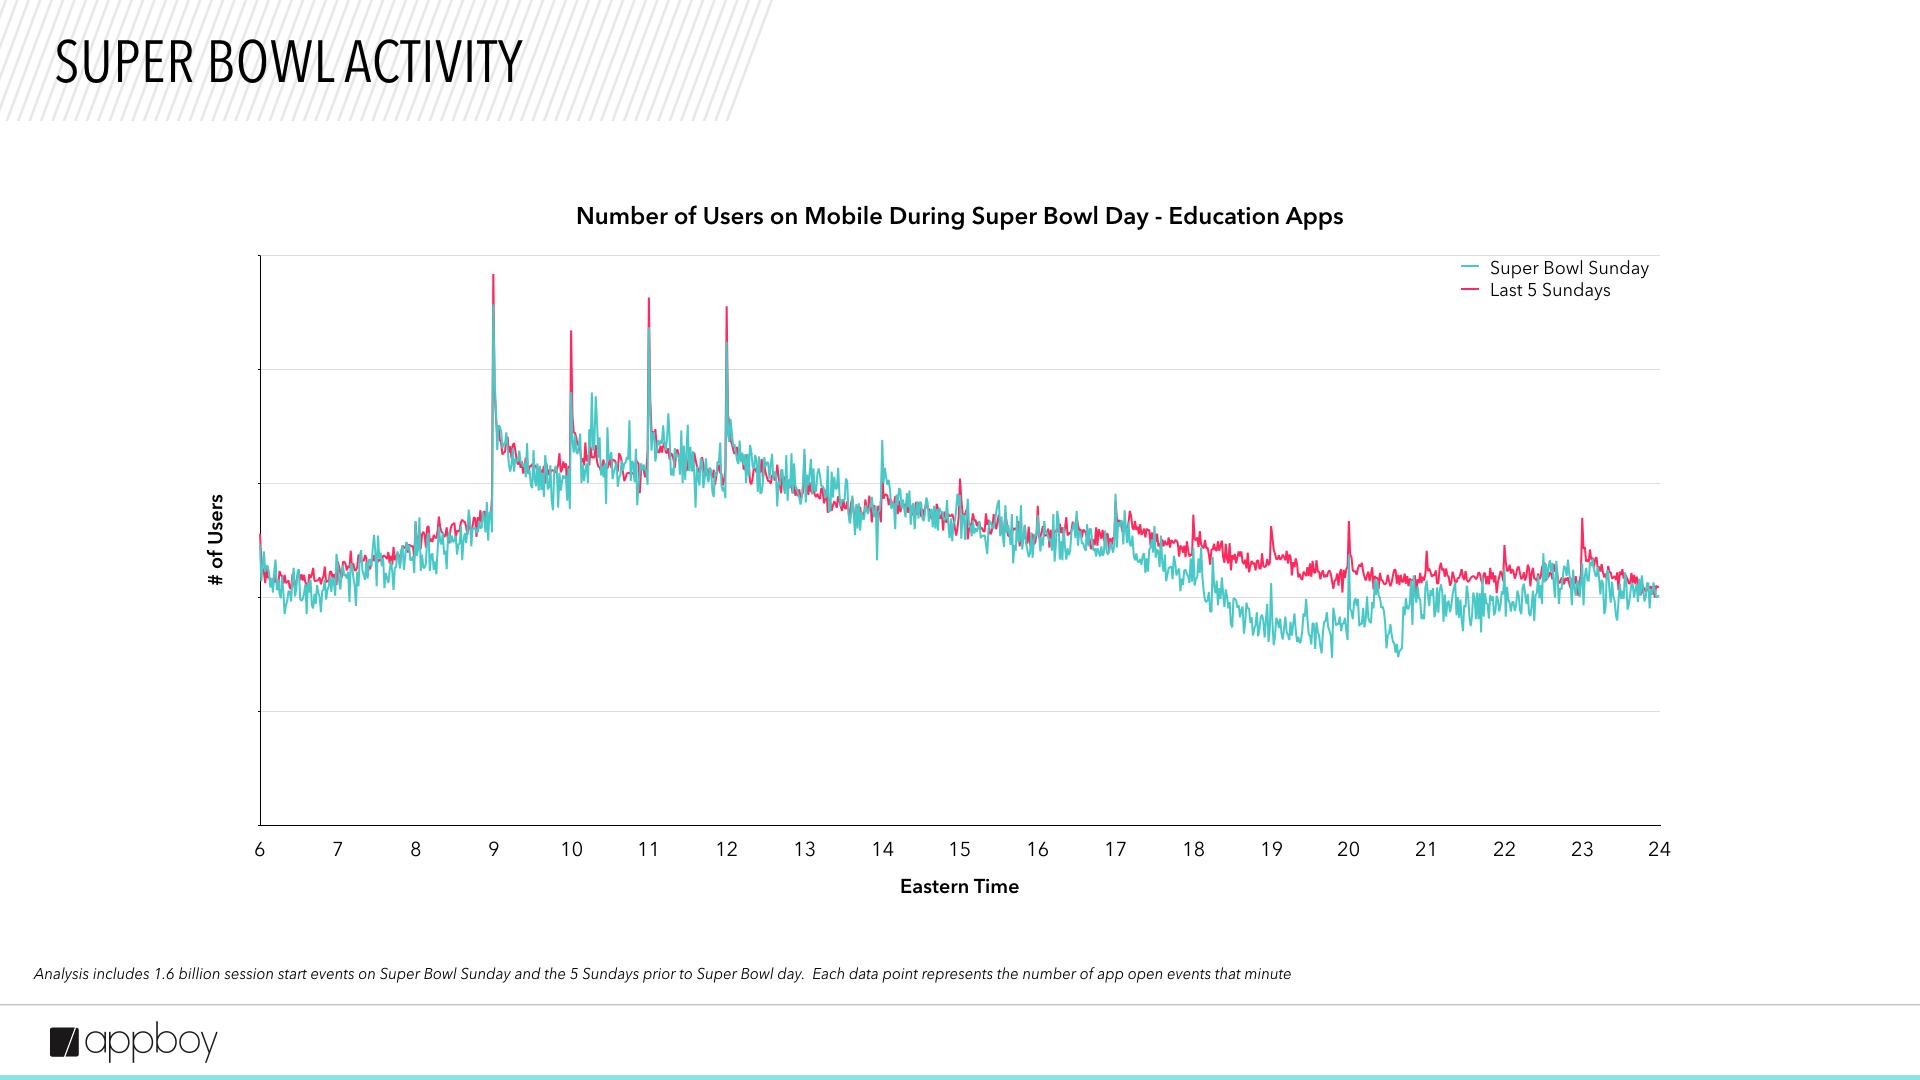
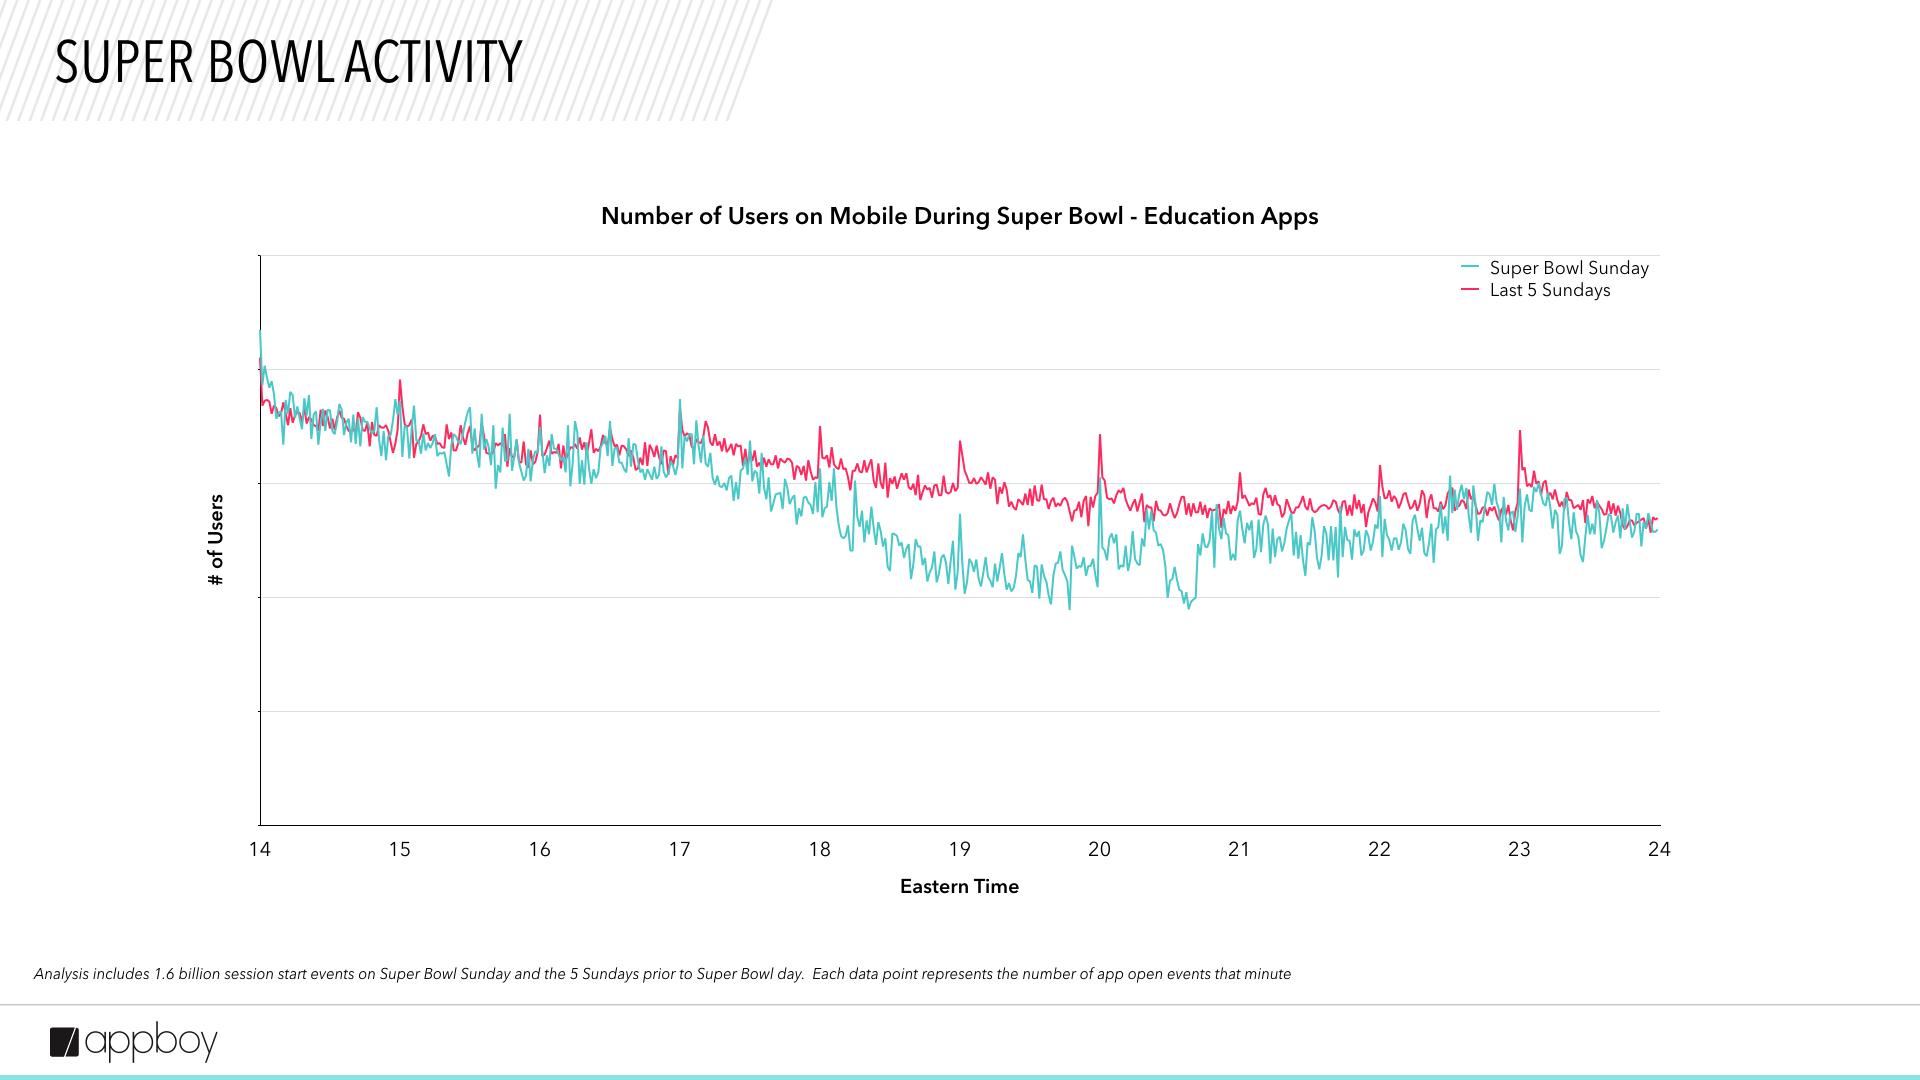
Education apps see a slow day overall
Learning languages and other educational activities take a back seat on game day. Overall app use for educational apps are lower on Super Bowl Sunday compared to other Sundays.
Worldwide data highlights U.S. trends
The Super Bowl is, unsurprisingly, a U.S.-centric affair. When U.S. app use data is compared to worldwide data for food + beverage and travel + transportation apps, for example, the activity difference in the U.S. is abundantly clear.
Methodology
Appboy analyzed the minute-by-minute activity from over 160 million users across more than 150 apps on Super Bowl Sunday 2016. To establish a baseline, activity on the same set of apps during the prior five Sundays was averaged. Data points represent the number of users who opened the app during that minute interval. The sample size is 1.6 billion events.
Be Absolutely Engaging.™
Sign up for regular updates from Braze.