99 Need-to-Know Stats on the Mobile Customer
Published on April 11, 2016/Last edited on April 11, 2016/10 min read


Team Braze
In our increasingly digital and mobile world, customer expectations are growing all the time. That means only marketers with a deep understanding of what their customers respond to and what they value will be able to build long-lasting relationships with those customers.
Keeping today’s mobile customers engaged is a difficult task—on average, app retention rates drop to 4% over three months. But there’s real value in fighting that churn rate and sustaining relationships with customers you’ve already acquired. It’s much easier—50% easier, in fact—to sell to existing customers than to sell to a new one.
The following are 99 eye-opening statistics about mobile user engagement engagement in this mobile age, collected from industry analyses, trend reports, and Appboy’s own data.
Web and mobile web
- 73% of Americans use the Internet daily.
- 21% of people in the US are online “almost constantly.”
- How long is an average pageview? 55% of people spend less than 15 seconds on a single web page.
- Nearly 66% of time spent on a web page is below the fold.
- 61% of smartphone owners use mobile web browsers at least once daily, spending more than a half hour per day total.
- People spend 17% more time on mobile than they do on desktop.
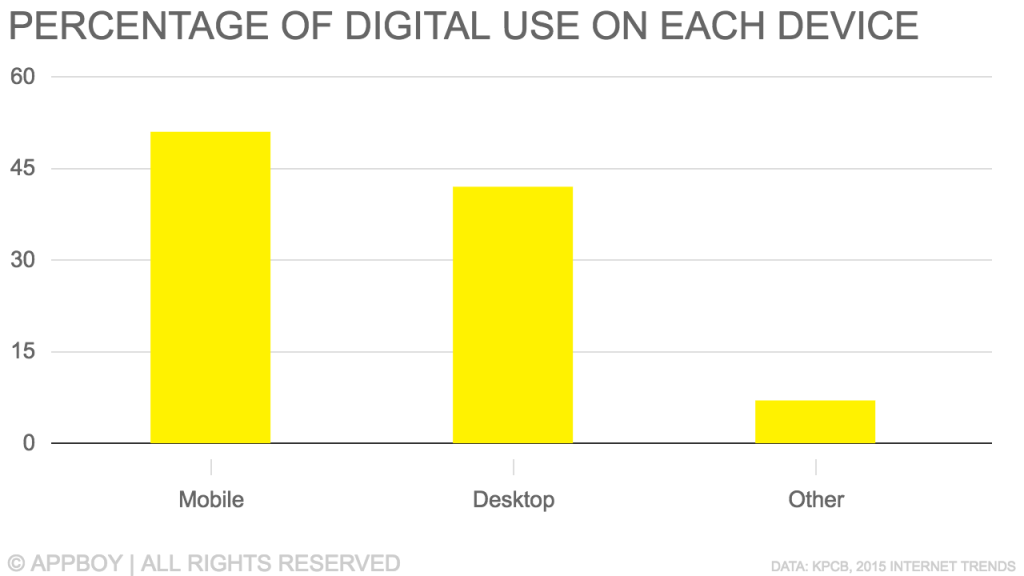
- The majority (51%) of mobile commerce shoppers prefer mobile apps to mobile web for making purchases.
Mobile app installs
- More than 50% of smartphone owners have 40-70 apps installed.
- The cost of acquiring users is rising. Mobile user acquisition costs jumped 84% in 2015 and as of September 2015 the cost was a steep $4.14 per user.
- iOS and Android make up 98% of the mobile operating system market.
- Globally, iOS downloaders are more likely to install apps on the weekends, whereas Android users are more likely to do so during the week.
- On iOS, health and fitness, business, productivity, and lifestyle apps have the highest click-to-install app conversion rates from ads (with health and fitness on the high end at just over 8% and lifestyle apps at 3.65%).
- On Android devices, transportation, news and magazines, lifestyle, and finance apps have the highest click-to-install app install conversion rates from ads (with transportation at 6.72% and finance at 4.78%).
- 13% of app users who have paid within a game will pay within a second game, which is 4 times the conversion rate for those who have not paid within a game.
- 34% of people choose apps based on peer reviews.
- More than half (59%) of app users say they typically check an app’s rating before downloading it.
- Nearly all (96%) app users will download a 4-star app, compared with only 50% who will download 3-star apps, and 15% who dare download 2-star apps.
- In 2014, the average US app user downloaded nearly 9 apps per month, almost no increase over the monthly volume downloaded in 2011.
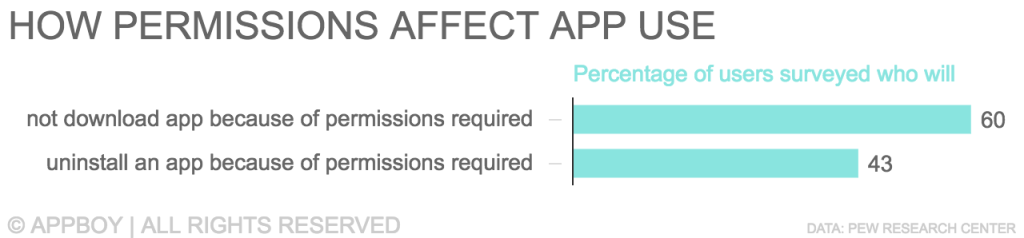
- Are app permissions preventing downloads? 60% of app users decide against downloading apps after realizing the amount of personal information they would have to share.
- App permissions contribute to uninstalls, too. 43% of smartphone owners uninstall apps because of permissions requiring them to share personal details.
Mobile app engagement
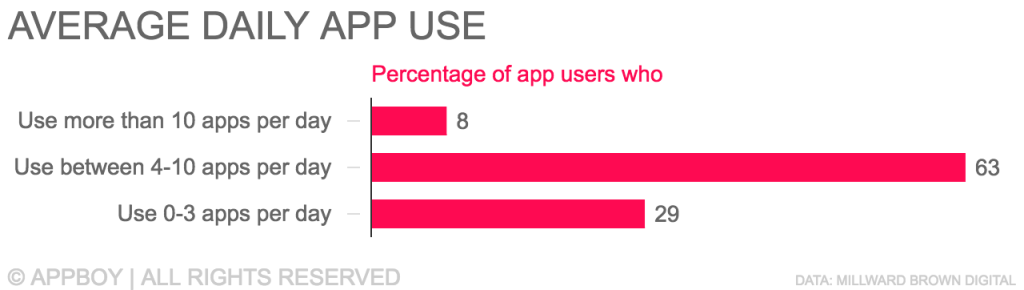
- Only 8% of smartphone users engage with more than 10 apps per day, 63% use between 4-10 on daily basis, and 29% use 0-3 apps per day.
- Throughout the world, iOS device owners are more likely to use installed apps on the weekends while Android owners are more likely to use apps on weekdays.
- The daily usage rate of messaging apps like Facebook Messenger and Snapchat is 4.7 times higher than any other type of app.
- For gaming apps, the daily active user (DAU) rates increase by 30-50% on weekends.
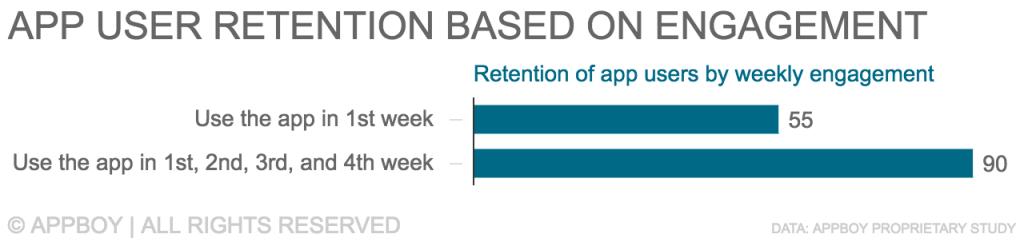
- Nearly all people (90%) who engage with an app on a weekly basis for the first month after installing it, stick with it.
- 55% of individuals who engage with an app in the first week after download will be retained.
- 80% of app users engage with their apps 15 times a day.
- Nearly all (96%) mobile users say app performance, such as speed and responsiveness, matters.
- After opening an app, almost half (49%) of users expect it to load with in 2 seconds while 51% expect apps to take 3 or more seconds to fire up.
- The average user spends 70% of their app-using time in just three apps.
Mobile app messaging
- 30% of people surveyed by Marketo disabled all mobile push notifications.
- 50% of people only opted into receiving push notifications from their favorite apps, according to the same Marketo survey.
- Sending just one onboarding-related push notification to newly acquired users during the first week after they’ve installed your app can increase retention by 71% over two months.
- Onboarding campaigns that include a push notification and a message via a different channel (email, in-app messaging, or News Feed Cards) during that same first week within installing the app can increase customer retention by 130% over two months.
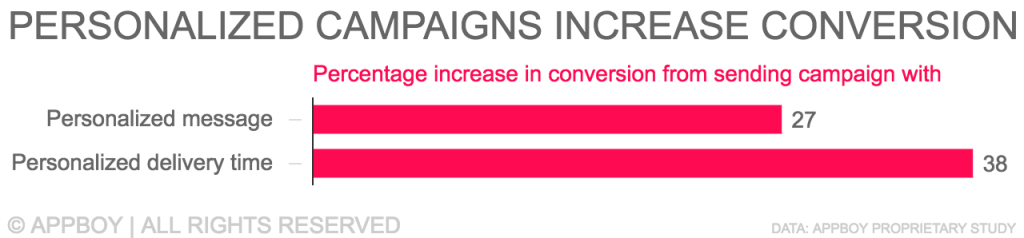
- Personalized messages sent to app users increase conversions by 27% compared to generic messaging.
- Personalized message delivery times (using the customer’s personal engagement data) ups conversions by 38%, compared with scheduled campaigns that do not leverage information about individual preferences.
- Push notifications that are 24 characters or fewer produce the highest conversion rates.
- An image included in your campaign message can increase the likelihood that a user will respond to your call-to-action by 57%.
- Sending campaigns to smaller, thoughtfully constructed segments (as opposed to larger batch-and-blast campaigns) can increase conversion by 200%.
Mobile app retention and churn
- On average—across app verticals and iOS and Android devices—apps have a 5% retention rate within 30 days of being downloaded, or in other words, within a month of being first downloaded, 95% of apps are uninstalled.
- Over a 30-day period, on Android devices, music and transportation apps have the highest retention rates (just over over 12% and about 8.6%, respectively) and, over the same amount of time, on iOS, social media and game apps have the most staying power.
- Messaging apps may have the strongest retention of all. According to Flurry Insights, the 12-month retention rate of messaging apps is 5.6 times better than all other kinds of apps.
- What’s the number one explanation people give when asked why they’ve deleted apps? “I rarely used the app” is a top reason among 72% of smartphone owners.
- If an app runs slowly, it can have a real impact–nearly half (48%) will uninstall it.
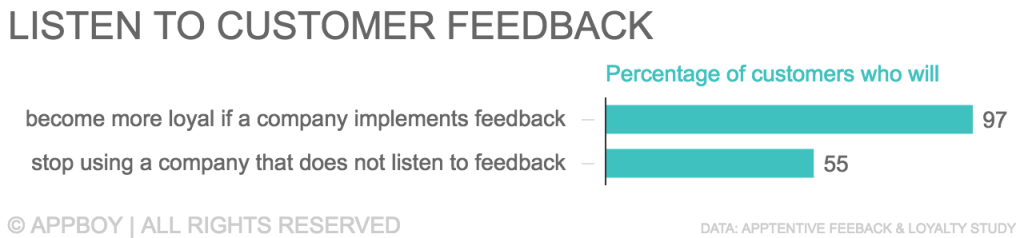
- The majority (55%) of customers report they’re not likely to continue patronizing companies that do not listen to feedback about their apps.
- Nearly all customers (97%) report they’re more likely to be more loyal to mobile companies that implement their feedback.
- A 5% increase in customer retention can lead to increasing profits by 25% to 125%.
Email opens, click throughs, and conversions
- In the US, the average email open rate is 20.7%.
- Transactional emails have twice the open rate (44.9%) of non-transactional emails (20.8%).
- Most emails are opened between 1 and 2 times per person.
- The average click-through rate on emails is 3% in the US.
- The average click-to-open rate in the US is nearly 12%.
- Since 2012, more than half of email opens have happened on mobile devices; 2015 data from Yesmail puts the mobile open rate at just over 57%.
- Companies that implement email marketing templates with responsive design across the board have a 55% higher mobile click-to-open (CTO) rate than companies who do not adopt responsive design.
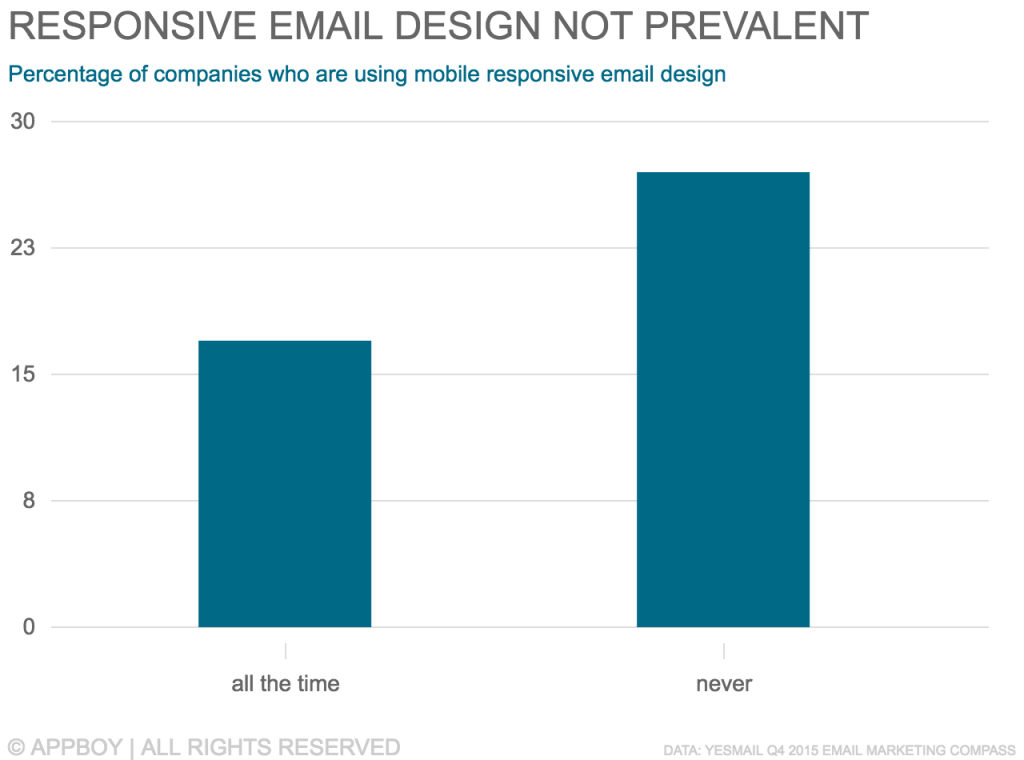
- Only 17% of companies are using responsive design for all of their email sends.
- Nearly 27% of companies aren’t using responsive design at all.
- Transactional emails still perform better on desktop, which has the highest conversion rate (51%), followed by 16% on iPhone, 14.8% on iPad, and 12.5% on Android.
- 80% of companies with marketing automation saw an increase in customer lead generations.
- A VentureBeat analyst conducted a study of 43 vendors in the marketing automation space in 2015, and found that 77% of businesses with marketing automation in place saw an increase in conversions.
- Welcome emails, sent to newly acquired customers, have the highest open rates (nearly 60%).
- Welcome emails produce 9 times the transactions that traditional bulk sends generate.
- Revenue resulting from welcome emails is 8 times higher than that of bulk sends.
- The most effective welcome emails–with the highest open, click, and transaction rates–are sent within real time of signing up for the email newsletter rather than emails sent with lag time (say, the next day).
- Real-time welcome emails with a special offer yield twice the transaction rates of real-time sends without any offer.
- Real-time welcome emails with free shippingproduce the highest transaction rates (over 5%).
- Is your email unsubscribe rate higher than average? In the US the benchmark is 0.13%.
Social media
- Social networking is the #1 internet activity, ahead of email.
- 74% of online adults use social media platforms.
- 72% of US adult internet users are on Facebook, according to Pew Research.
- Facebook (70% of users use it daily) and Instagram (59% use it daily) have the highest engagement.
- Most (60%) of social media engagement occurs on mobile.
- 41% of people in the US are active social media users on mobile.
- 88% of US mobile app users have logged into an app via a social network-based account, like Facebook or Twitter.
- 15% of businesses report that 25% or more of customer service happens on social channels.
- Not responding to customer complaints on social media could lead to a 15% increase in churn rate.
- Social traffic is the second biggest driver of traffic to websites, behind direct traffic, according to Chartbeat.
- Social web visitors are more likely than visitors from other referral sources to spend time and read the page’s content.
- On the other hand, social web visitors are the least likely of any referral type to return to the site.
- What’s the best time of day to post on social media in order to drive traffic referrals? In the early afternoon and into the evening, according to Chartbeat.
Ecommerce
- It’s 50% easier to sell to an existing customer than a new one.
- The likelihood of converting existing customers to make repeat purchases is 60% to 70%.
- Your odds of converting new prospects to make a purchase range from 5% to 20%.
- More than half of ecommerce traffic comes from mobile and tablet devices.
- Gaming app shoppers spend up to 83% more money in December on apps than the annual average.
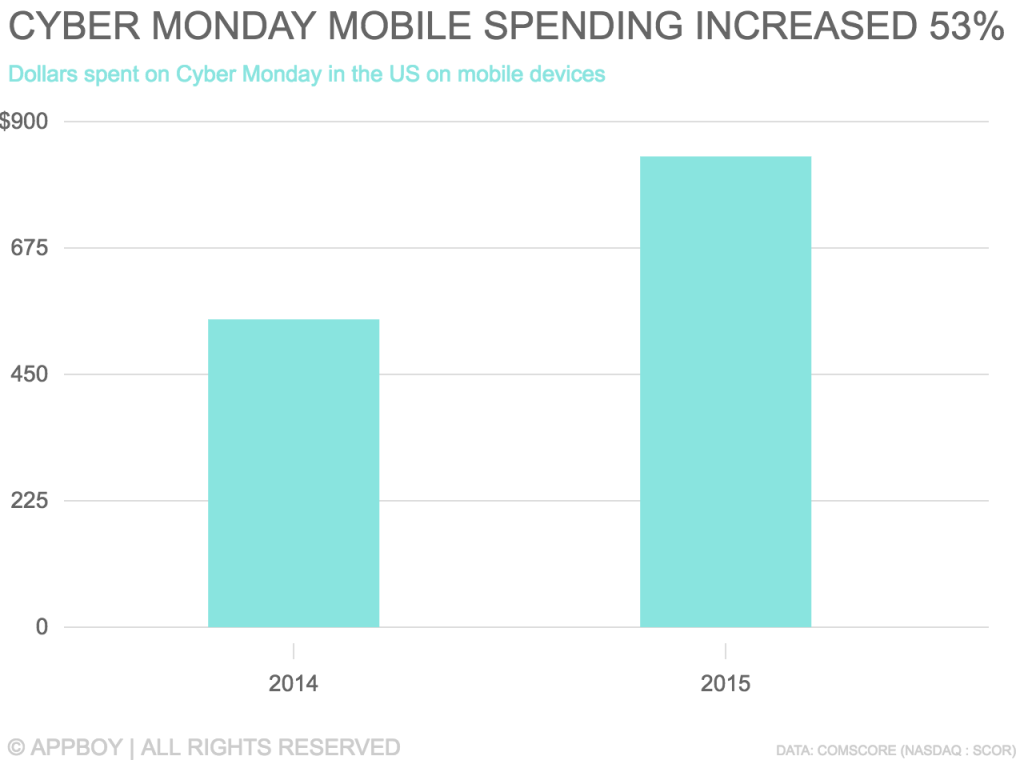
- Americans spent $838 million online using mobile devices on Cyber Monday 2015, up 53% year over year
- 49% of shoppers are okay with companies collecting personal details to be able to receive personalized service.
- 71% of shoppers expect to be able to view brick-and-mortar inventory online.
- 50% of shoppers expect to be able to make purchases online and pick up in-store.
- However, only one-third of companies offer in-store pickup options for online purchases.
- 59% of customers say shipping costs are the #1 consideration when shopping online.
- 75% of online buyers say free, expedited shipping influences purchase decision.
Wearables and the Internet of Things
- In 2015, wearable use increased by 57% year over year from 25.1 million to nearly 40 million.
- Apple Watch owners look at their wearable devices 60 to 80 times per day.
- Unsurprisingly, checking the time is the most common engagement of Apple Watch owners.
- And the second most common engagement of Apple Watch owners is reading notifications.
- In 2015, there were 15 billion “smart” devices.
- 62% of consumers believe Internet of Things (IoT) devices are too expensive.
- 64% of purchasers had a problem when trying out a new connected device, such as finding it too difficult to use.
- Only 13% of consumers intend to purchase a smartwatch in 2016.

Be Absolutely Engaging.™
Sign up for regular updates from Braze.

