Americans More “Connected” on Election Day: Mobile Activity Up to 34% Higher
Published on November 14, 2016/Last edited on November 14, 2016/1 min read

Team Braze
Last week wasn’t a typical week.
At Appboy, we took a look at how election day changed our mobile habits—how much, and when, we used our phones.
We analyzed 3.5 billion sessions from users in the U.S. on November 8, comparing the day to the four previous weekdays for a look at mobile app activity by state, and time of day.
Here’s what we found.
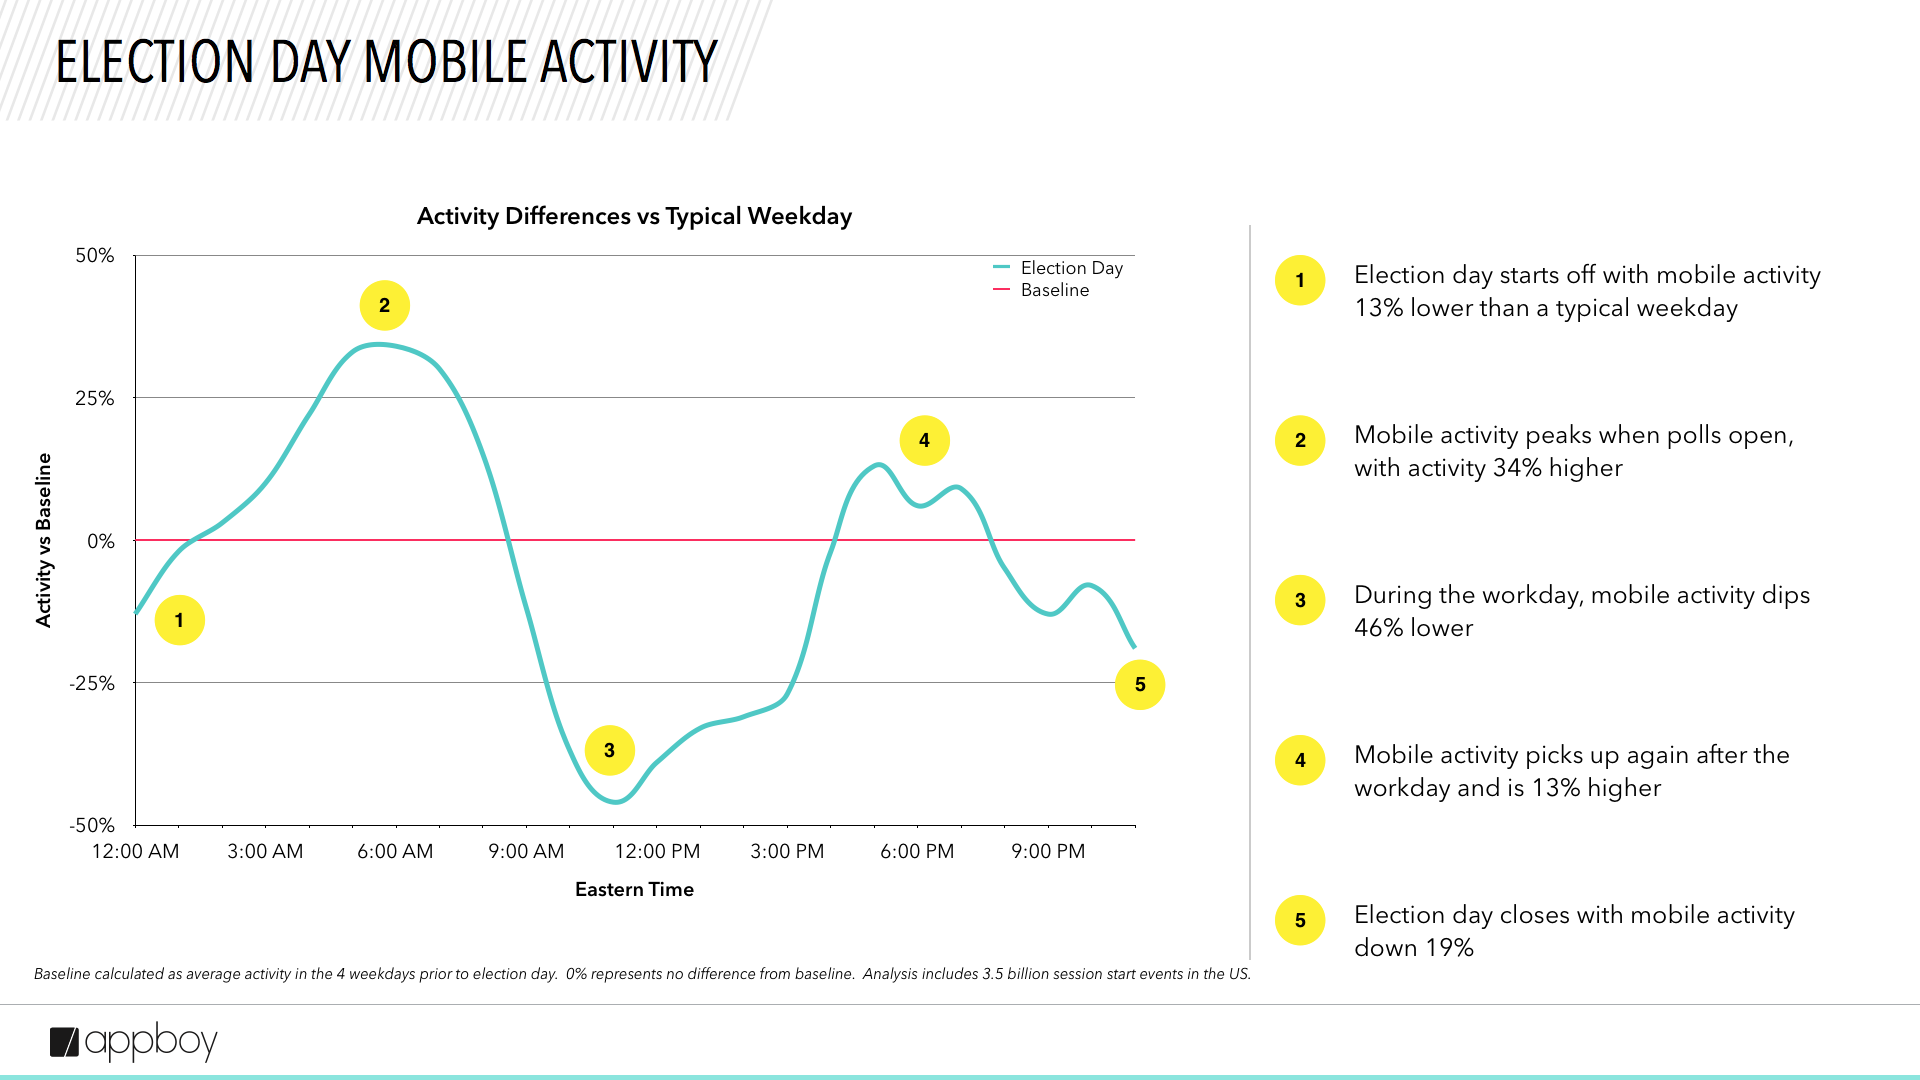
Mobile activity shot up as polls opened, then was depressed. This could be because voters were using their devices while waiting in line for the polls, and then once they got to work, were more focused on getting work done because of the time off they’d taken.
Right after work hours ended, there was another uptick in activity, potentially due to later-in-the-day voters waiting in line. The day ended with below-average mobile activity within apps, likely as users were watching election coverage on TV.
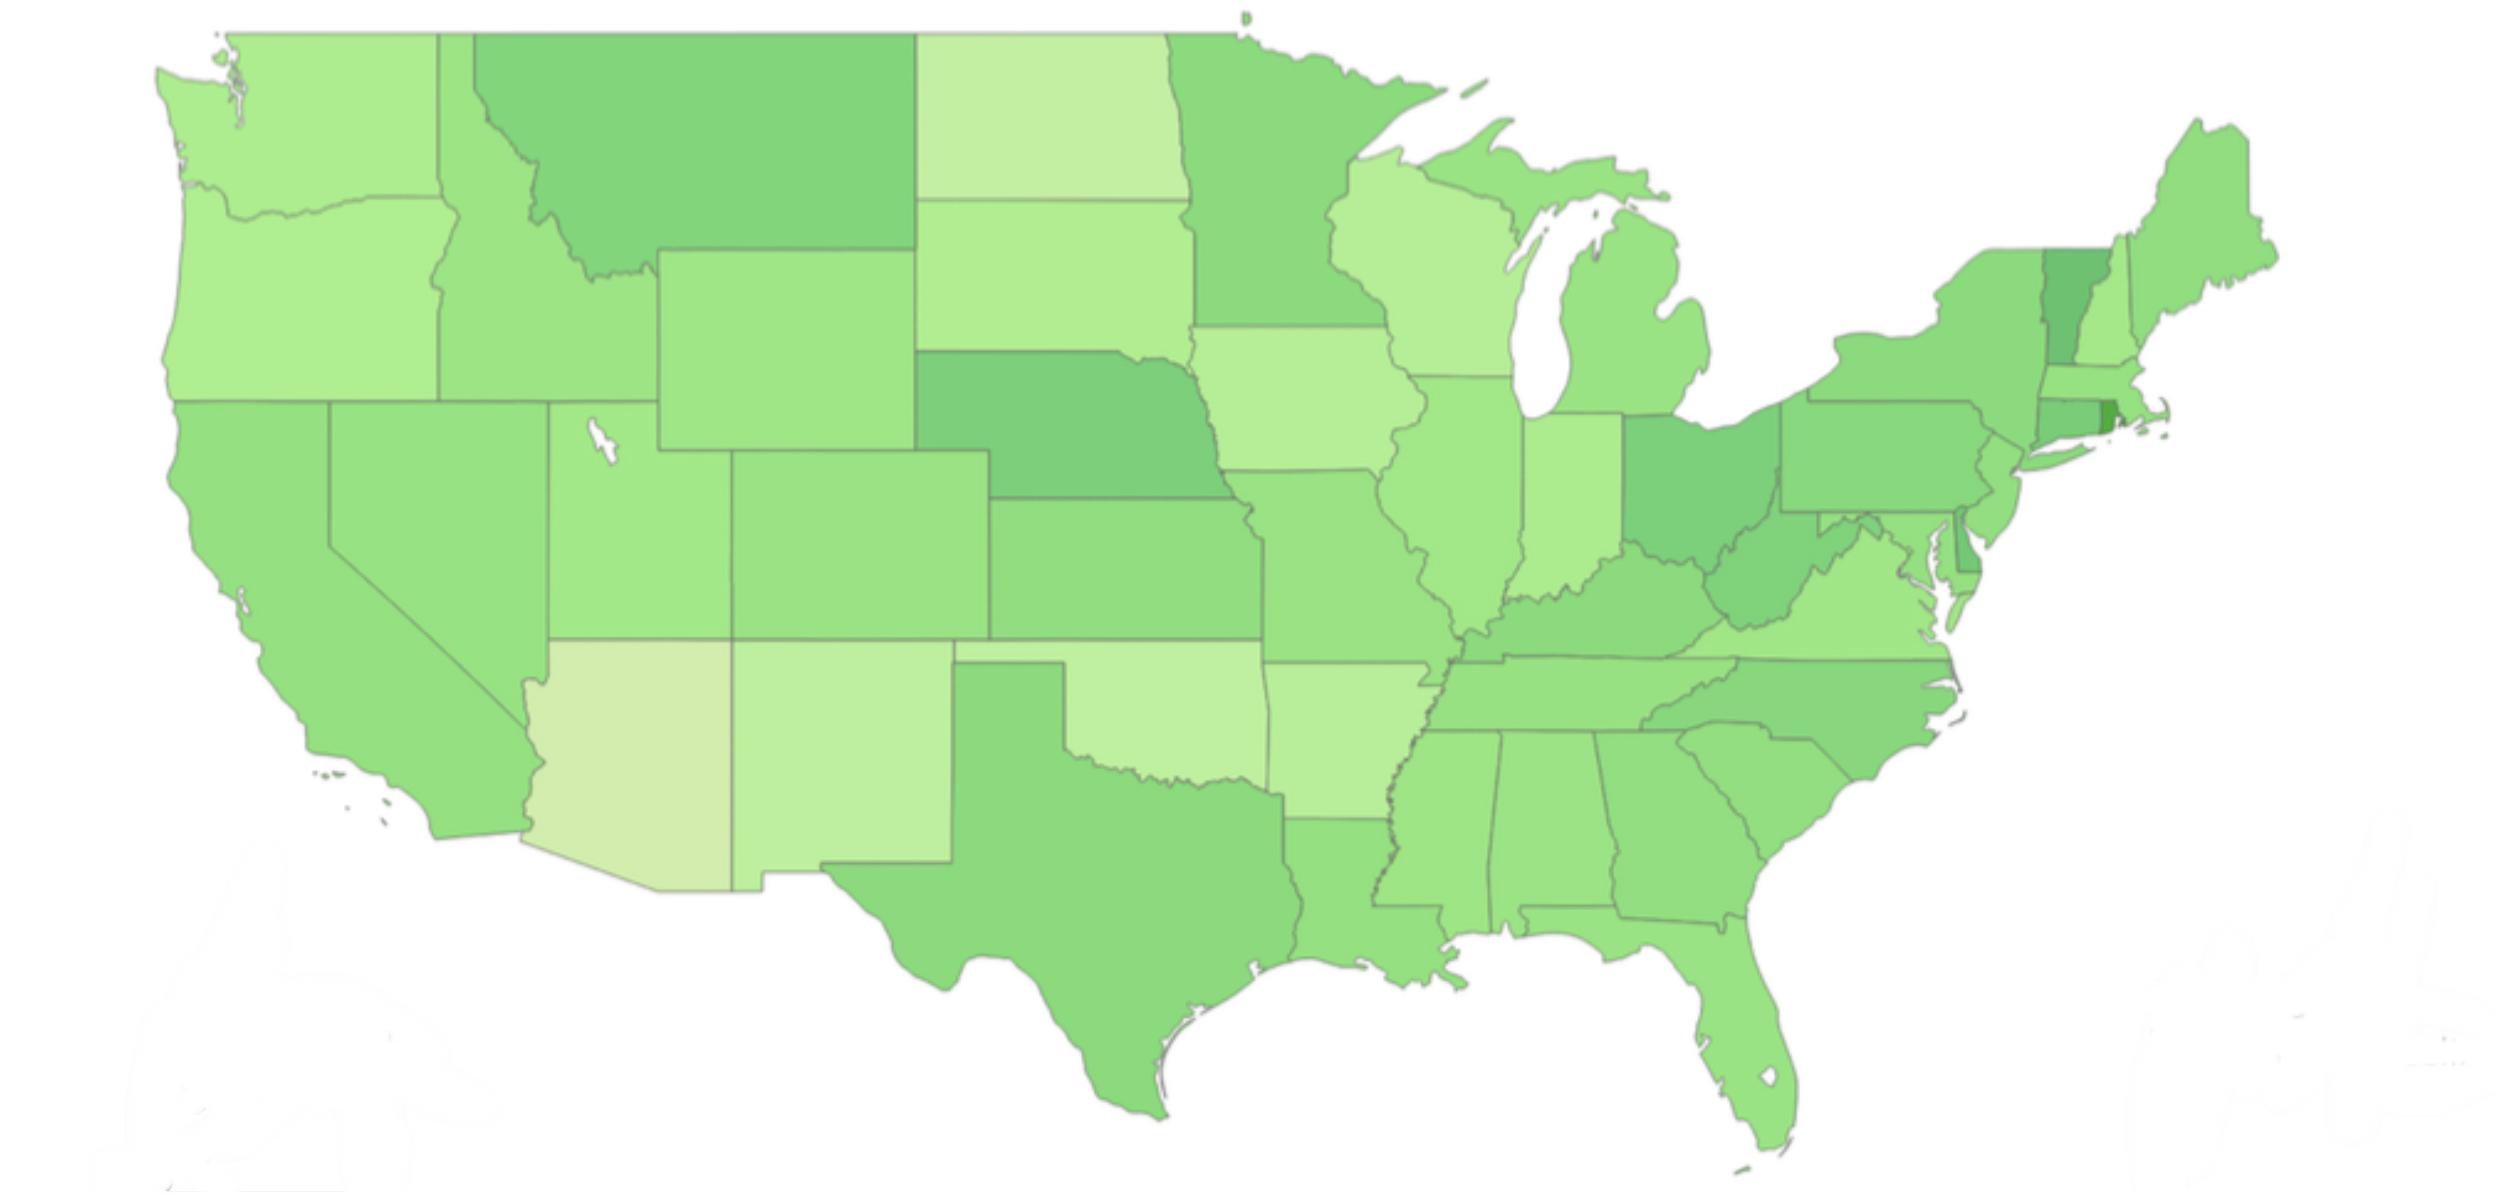
Here’s what it looked like state by state.
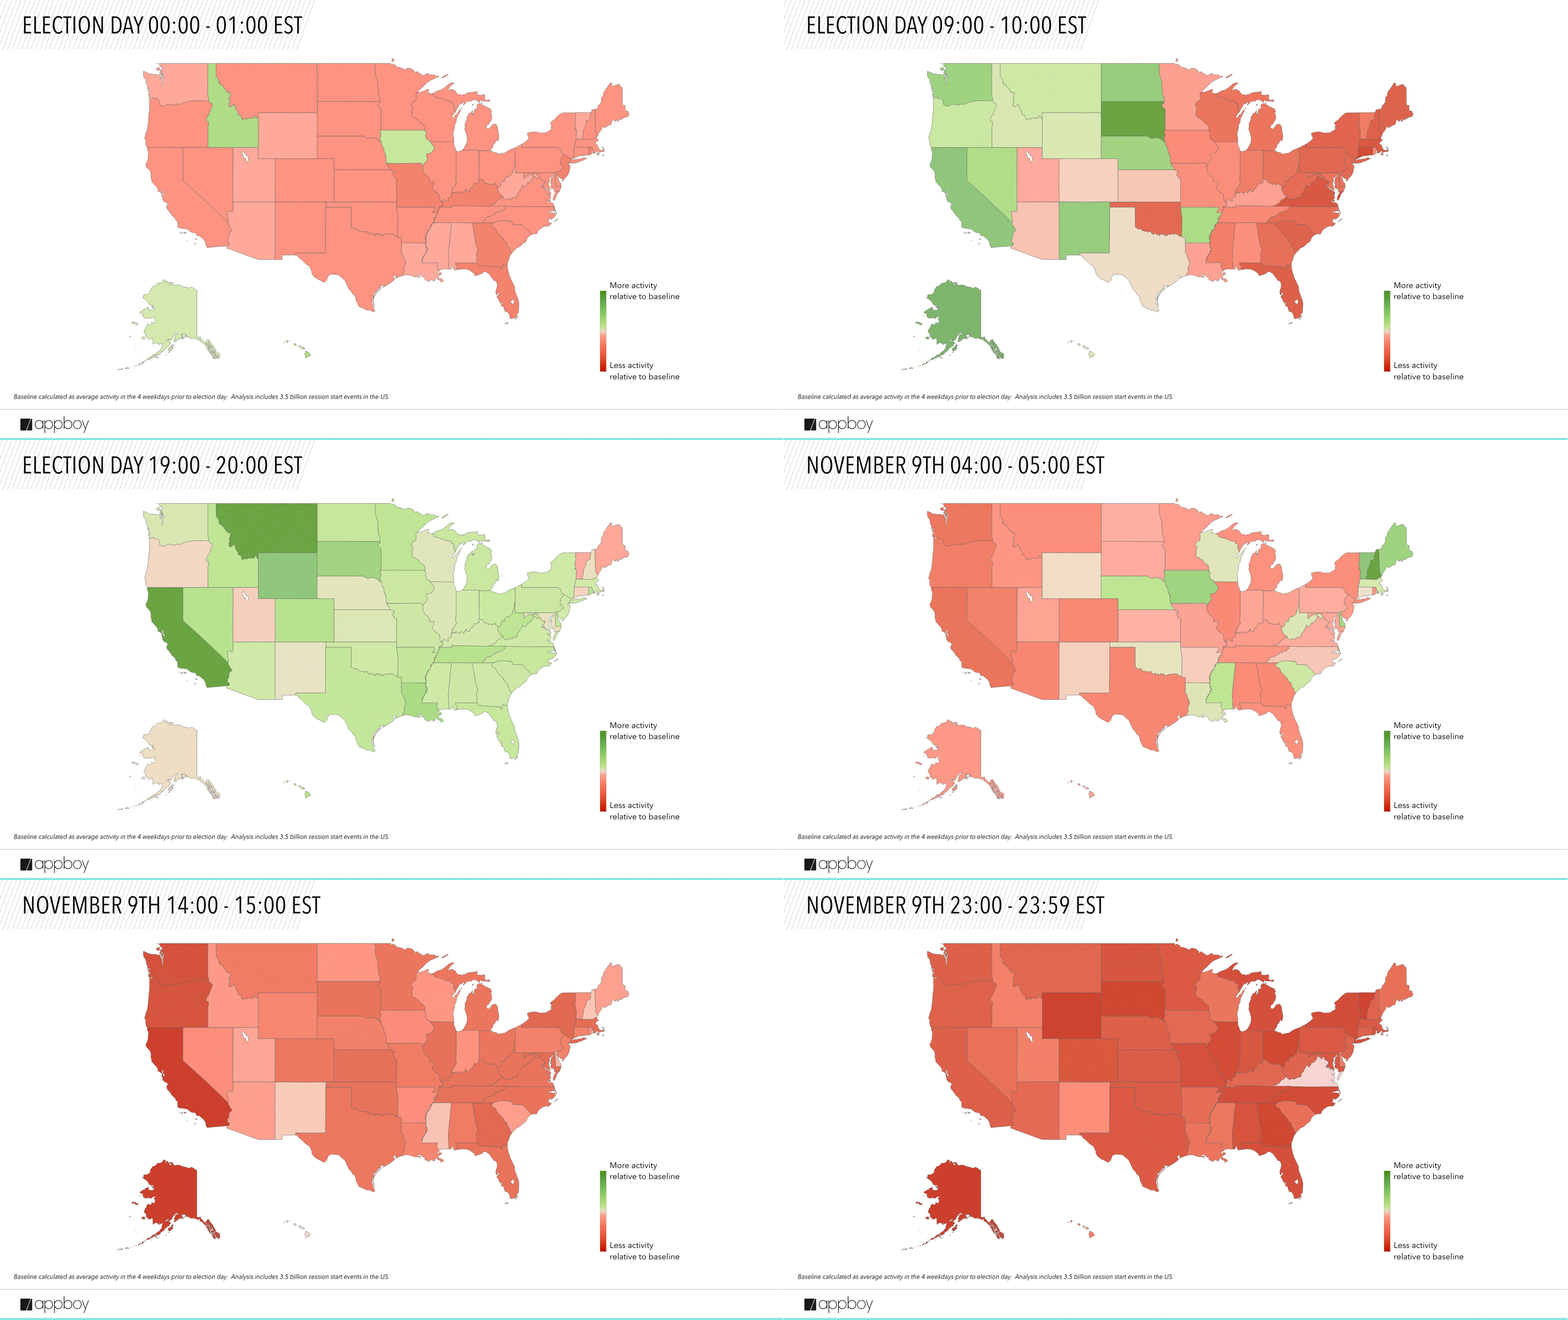
[slideshare id=68836834&doc=appboyelectiondatauselection-161114004402]
Be Absolutely Engaging.™
Sign up for regular updates from Braze.