Why Your Data Disagrees: Getting to the Bottom of Discrepancies
Published on November 23, 2016/Last edited on November 23, 2016/8 min read


Team Braze
Your marketing world might require you to use several systems at once to track your various metrics. And, from time to time, the data might differ between systems. This can be cause for consternation. Which system is “right”? Which system can you rely on? You may, at times, be drawn to stats that tell the better story…but this could backfire later, if those other, less flattering numbers turn out to be more viable.
Most typically, differences in data between systems are due not to incorrect or “false” numbers, but to deviations in the ways different programs define what they’re tracking in the first place. For example, Google Analytics calculates sessions (which they formerly called visits) based on certain time frame rules: a session ends at midnight (in the time zone you set for your Google Analytics account), after 30 minutes of inactivity, or if a user visits the site, leaves, and then returns. Appboy by comparison uses a default session timeout of 10 minutes, but this can be adjusted based on what you’d like to use. So the number of visits in a given time period, when compared between any two systems, might differ. But neither is “wrong.”
Variations in metrics can also differ based on time zones, or based on whether systems use a calendar month versus a 30-day measurement, and other time-related considerations.
Reconciling differences is usually just a matter of knowing how each system defines which metric, and using the version you prefer.
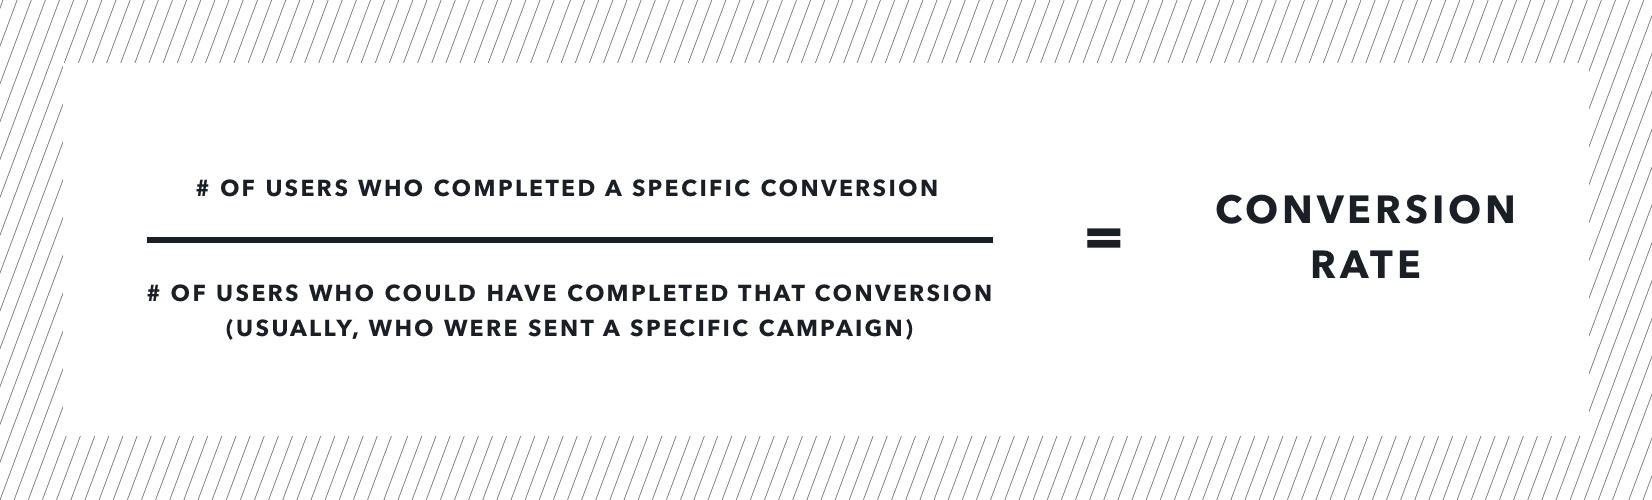
Conversion rate
Conversion rate as a term simply means taking the number of users who completed a specific conversion and dividing it by the number of users who could have completed that conversion. For example, if you’re tracking loyalty-program signups from an email campaign, your conversion rate is the number of people who sign up for the loyalty program after (and because of) receiving the campaign, divided by the number of people you sent the email to.
As you can tell, this is something of a variable term—you can redefine its meaning for each campaign. In the Appboy platform, for example, you define what conversion means for a specific campaign when you build it. Then, as you check your report, the percentage you’ll see is based on what you defined at the start of the campaign. You could set conversions as app sessions, landing page visits, clicks…any number of things important to your campaign goal. You’ll also want to define a conversion window: how long after the campaign is sent will you measure results? How you define conversions depends on the types of actions you’re after, and on when you need to make decisions about tests and new campaigns.
If you’re comparing conversion rates of a campaign between systems, be sure to check what the conversions being tracked actually are, what the conversions’ windows are, and bear in mind that different systems may be tracking data in different ways—your email platform might be tracking clicks within an email that go to a landing page, and your webmaster tools might be tracking all visits to that page.
Revenue
In the Appboy Dashboard, you’ll see revenue attached to each campaign. This revenue is calculated based on each specific campaign, and all of the revenue from conversions that come from it, within a specific timeframe (aka, the conversion window).
If the revenue amount you see in the Appboy dashboard disagrees with a figure you see in another system, it could be that your conversion window in Appboy is too long or too short. For example, if a buyer views your email two days after you send it, and buys something then, but your conversion window was only set to one day, you won’t capture this conversion or revenue amount. It could also be that other influences are contributing to revenue that aren’t being attributed to the campaign in Appboy. If your product team is telling you that you’re making much more money on a sale than your marketing dashboard is tracking, consider all the other ways customers might be getting to your sale—social media, word of mouth, regular browsers of your site, etc.
LTV
LTV, or lifetime revenue, can be calculated several different ways, depending on whether you’re looking at revenue achieved from past campaigns, life-to-date, or projections based on that past data.
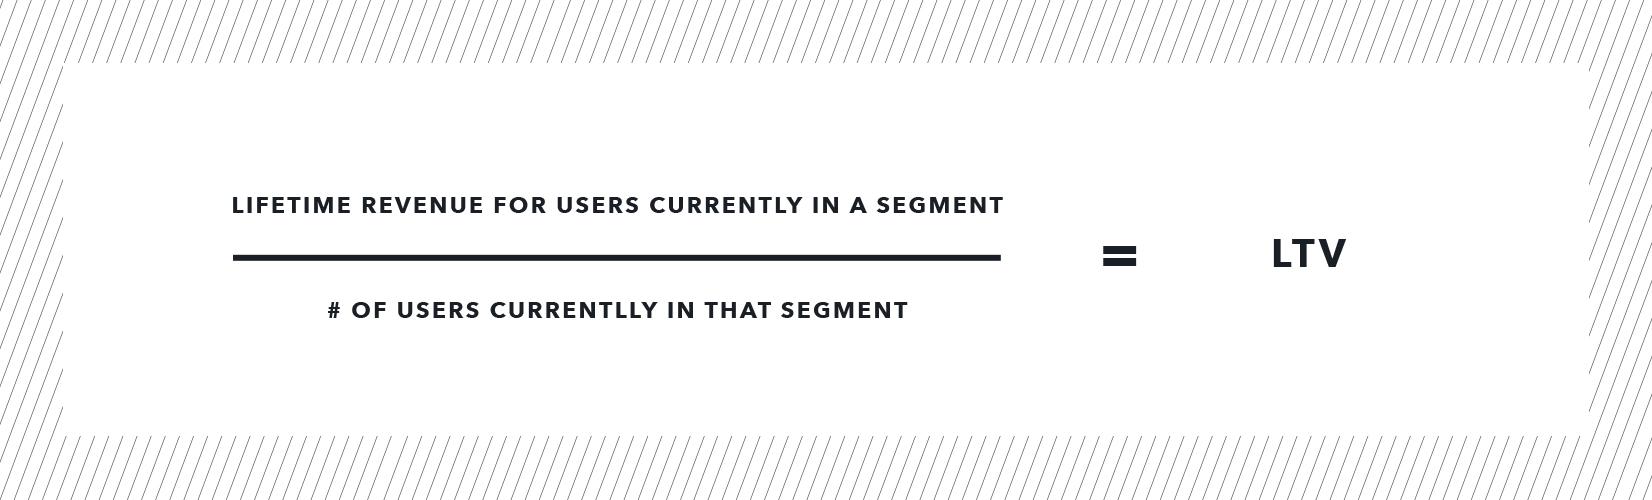
How Appboy defines and tracks LTV
Appboy clients will see LTV calculated when creating segments. You can also find LTV in the Segment Insights area of the Dashboard, which updates in real time. This metric represents average lifetime value per user and is calculated by dividing your lifetime revenue for users currently in the segment by the number of users currently in that segment.
Other common ways to calculate LTV
LTV can also, of course, refer to the projected revenue that a customer will generate during their lifetime, calculated by looking at average lifespan of a loyal user, and average revenue per user. You can then compare this number to the cost to acquire each user to determine the effectiveness of your business spend.
DAU
Apps have brought the term DAU—daily active users—into use. Web analytics haven’t typically referred to this figure as “DAU”; a website might refer to “daily active users” as either “visitors” or “users.”
How Appboy defines and tracks DAU
Daily active users in Appboy are the number of unique users, with at least one session in your app, on a given day.

How Google Analytics defines and tracks DAU
Google Analytics calls this figure for web pages active users. Within your account, you can navigate to the Active Users report, which shows results in 1-, 7-, 14-, and 30-day increments, where the day is the last day relative to the date range you set.
How Amplitude defines and tracks DAU
Amplitude tracks active users and new users as anyone who triggers an event marked as “active” within the Amplitude platform. It makes sense to browse through these events and ensure they line up with what you’d want to track to consider a user active on a given day. You can toggle between the active and new users’ views in the Amplitude dashboard. A note for those using Appboy, as well: if you’re toggled to new users only, the figures will look very different from Appboy DAU—they’re tracking different segments of users (all vs. new).
How time zones might impact DAU between systems
The time zones you’ve defined for your accounts could account for DAU differences between reports. If you have one platform set in Eastern Time and another in Pacific Time, you’ll see users accounted for on different days.
MAU
To determine your app’s or site’s “stickiness,” compare your DAU to your monthly active users (your MAU). Appboy MAUs are calculated nightly on a rolling monthly period.


How Appboy defines and tracks MAU
Monthly Active Users is the number of users who have executed a session in your app or site in the last 30 days. The percentage you’ll see next to your MAU count will give you a comparison of today’s MAU count to the MAU count recorded 31 days ago. MAU provides you with a look at the health of your app or site over a range of time, since it smooths out any inconsistencies that may occur on days with varying intensities.
How Google Analytics defines and tracks MAU
The Google Analytics Active Users report can be toggled to include 30-day active users, which, as mentioned previously, is relative to the last day in the date range you’re using. Where Appboy creates comparisons and percentage reports automatically, Google Analytics will provide relevant data, and you can run comparisons with the date range tool.
How time zones might impact MAU between systems
As with DAU, if you’re defining the start of your day in one time zone, but users are engaging in the same day in a different time zone, you could see discrepancies between systems.
Web sessions
How Appboy defines and tracks web sessions
Appboy tracks web sessions via our web SDK. By default, sessions are set to expire at 30 minutes of inactivity. If a user comes back within 30 minutes, that’s the same session. If they come back after the 30 minutes expires, they’ll start a new session.
Sessions in Appboy reporting are automatically combined to include web and app, so if you want to see web sessions only, you’ll want to create a segment of your web users.
How Google Analytics defines and tracks web sessions
What are now called “sessions” in Google Analytics used to be called “visits.” This changed last November to be more inclusive of mobile sites.
The Google Analytics sessions metric is defined as anything a user does on your site until 30 minutes of inactivity has lapsed. If they leave your site and come back within 30 minutes, however, or if their session spans one day into the next through midnight, it counts as two sessions.
Don’t panic, and choose wisely
Should numbers differ dramatically, remember that there’s probably an answer for why figures look one way in one system, and different in another. If you can get to the bottom of why, you’ll develop a deeper understanding of how your systems work, and can choose which metrics are most important to you going forward. All of this will give you deeper insights into what your users are actually doing out there.
Be Absolutely Engaging.™
Sign up for regular updates from Braze.