Get a Better Picture of Your Customer Engagement With Braze Data Visualization Features
Published on June 10, 2022/Last edited on June 10, 2022/6 min read
Team Braze
With an increasing number of customer interactions happening online, today’s marketers have more data about their customers’ preferences, behaviors, and reactions to their marketing campaigns than ever before. But simply having that information available isn’t the same as having an effective window into what that data actually means, or the ability to take effective action based on relevant insights.
Effective data visualization is critical in helping marketing, growth, and engagement teams understand how their marketing campaigns are performing. To help brands get a clearer picture of their customer engagement efforts and where they are—or aren’t—paying off, Braze offers a range of data visualization features designed to spotlight everything from user retention trends to email engagement. Let’s take a look at how these tools can bolster marketers’ understanding of their customer engagement efforts.
1. Braze Segment Insights
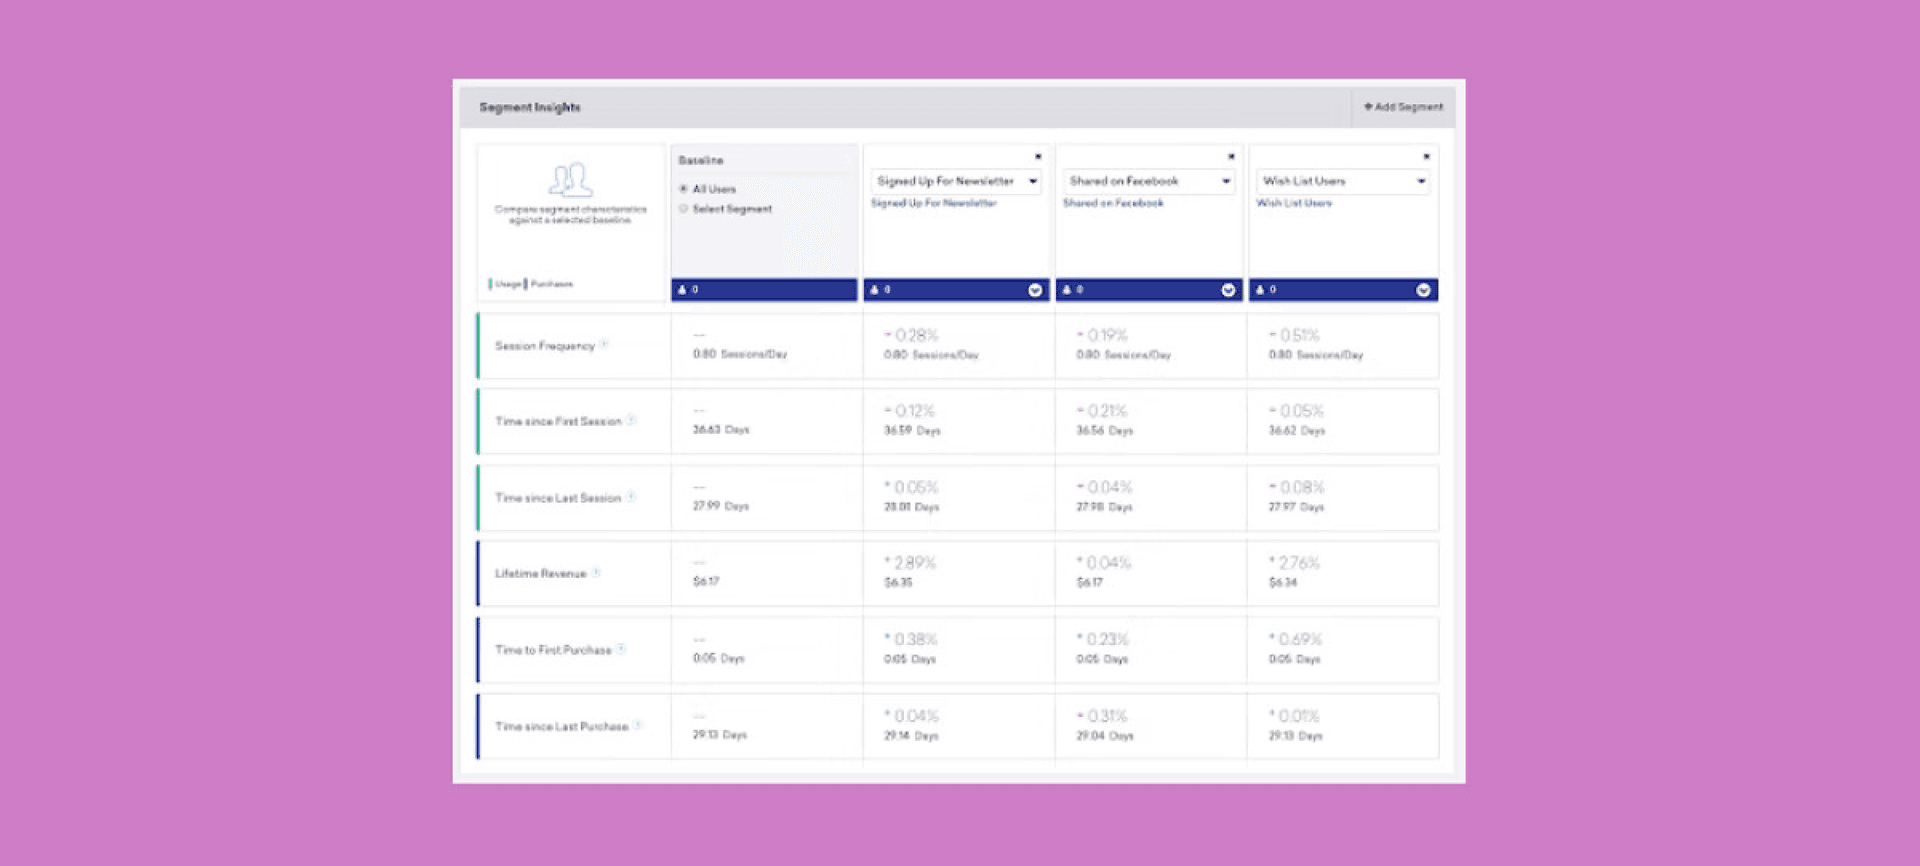
Understanding your customers and how they differ is a key element of providing the kinds of relevant experiences that today’s consumers crave. The Braze platform’s Segment Insights feature makes it easier to gain those key insights by providing a visual comparison of up to five different segments across key behaviors. With this tool, you can quickly assess how a given segment is performing compared to others across a set of pre-selected KPIs, making it easy to target specific audiences for relevant campaigns.
Segment Insights are a great way to compare app usage, purchasing patterns, and other high-level engagement data. Is a particular campaign overperforming within a specific demographic? Are particular segments seeing weaker engagement across KPIs? With Segment Insights you can answer those questions and then take effective action to capitalize on opportunities and shore up segments that aren’t where you want them to be.
2. Braze Email Engagement Dashboard
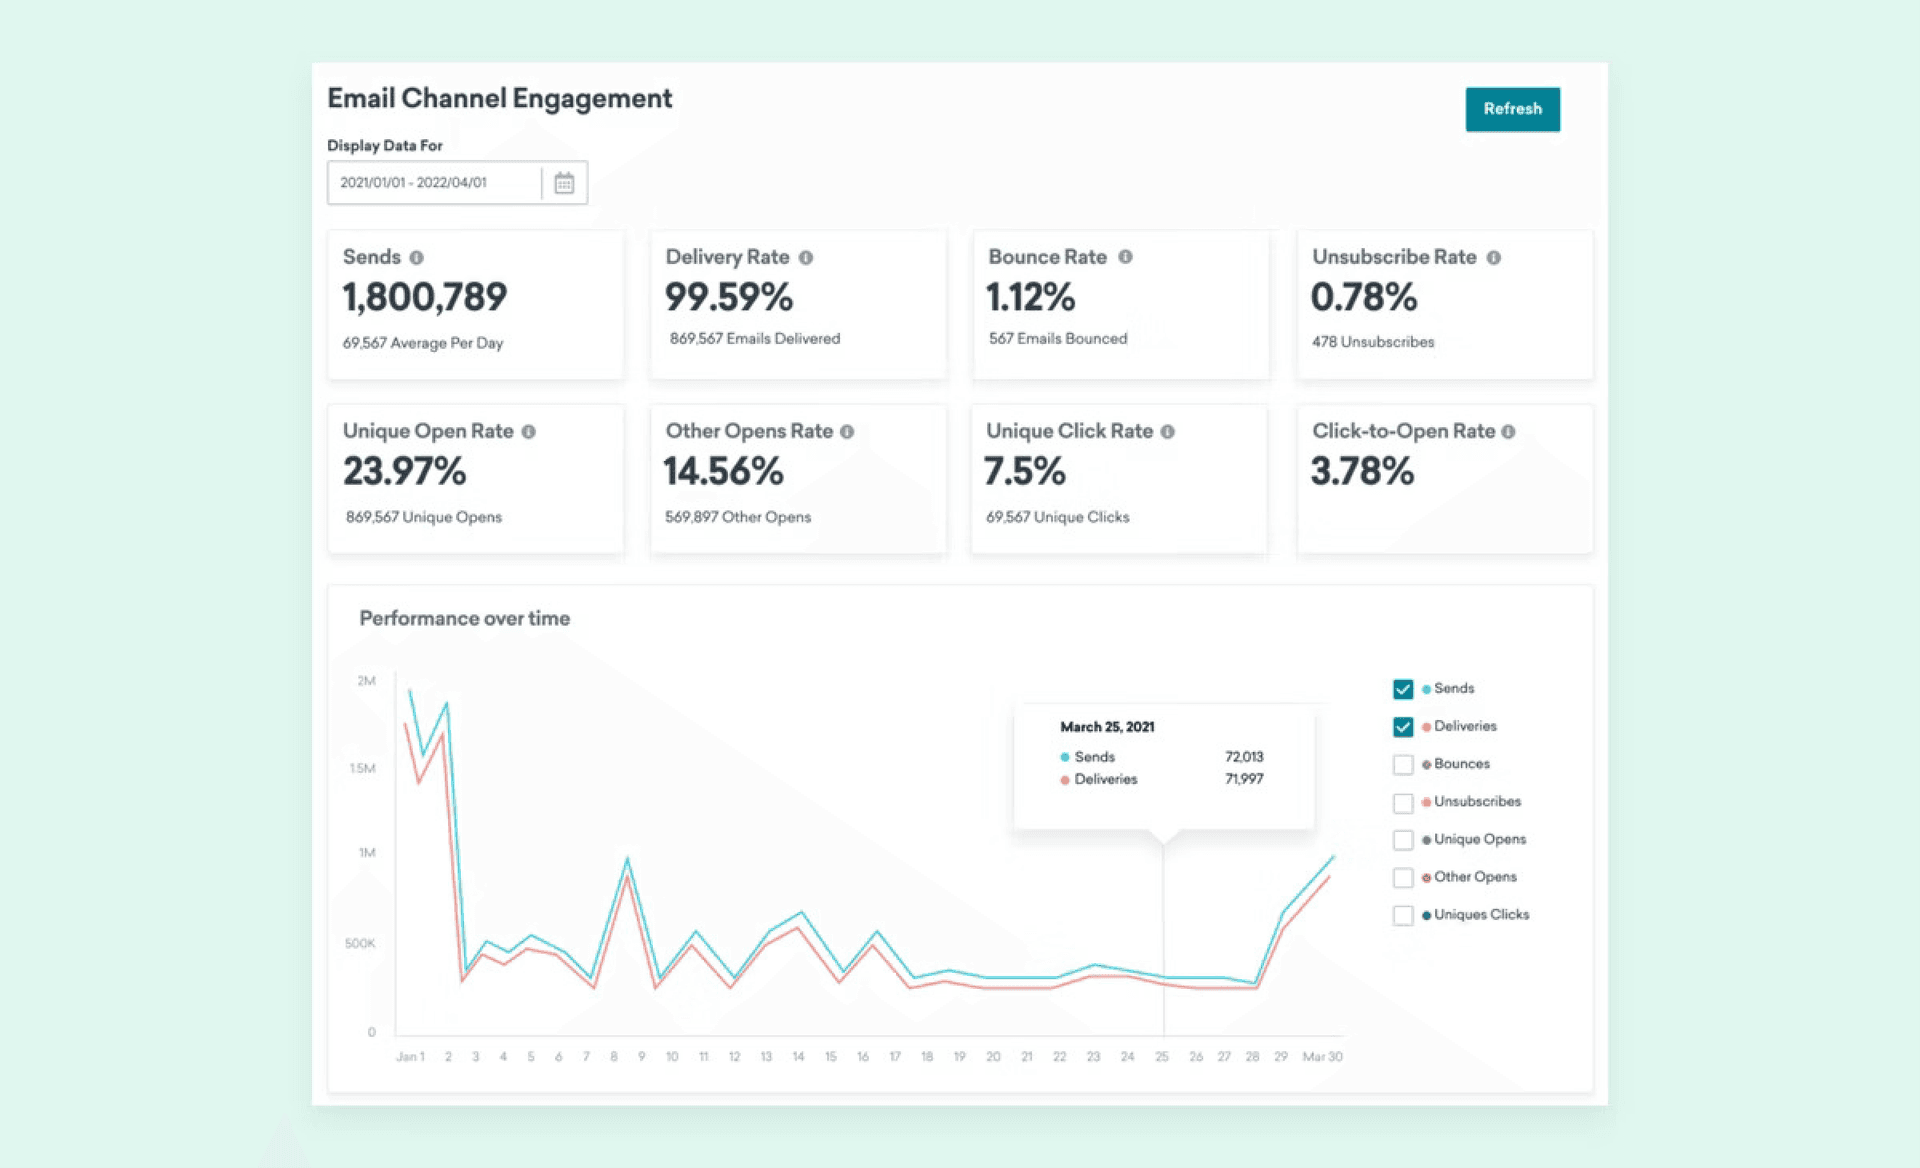
Today’s email is a dynamic, increasingly interactive channel that serves as the cornerstone of many brands’ customer engagement strategies. But to get the full benefit of this powerful, flexible channel, marketers need a clear-eyed understanding of how their email efforts are performing.
Thanks to the Braze Email Engagement Dashboard, it’s now possible to visualize and analyze key aggregated email performance metrics at a moment’s notice, all within the Braze platform. This feature allows marketers to stay abreast of their email engagement numbers across both email campaigns and Canvas journeys, allowing them to respond effectively to changes in recipient behavior as they happen.
3. Braze Canvas Visualizations
Every user has a journey with your brand and you need to understand what that journey looks like—both an individual level and in the aggregate—to ensure the best possible outcomes. To make this easier, Braze has built data visualization capabilities into our Canvas customer journey management tool, giving brands a better understanding of the impact of the user flows they’re creating.
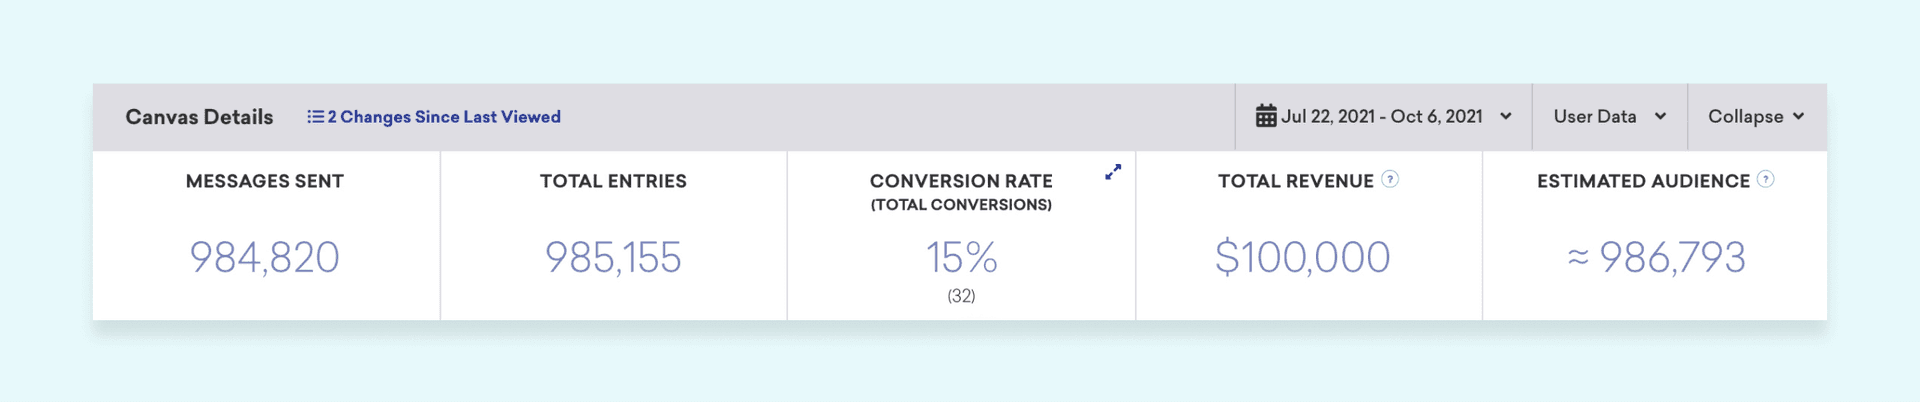
On the Canvas Details page within the Braze dashboard, you can track the number of messages sent, conversion rates, the estimated total audience, and more. These high-level metrics can be a simple, powerful way to ensure that you have the finger on the pulse of your customer journeys and how you’re tracking.
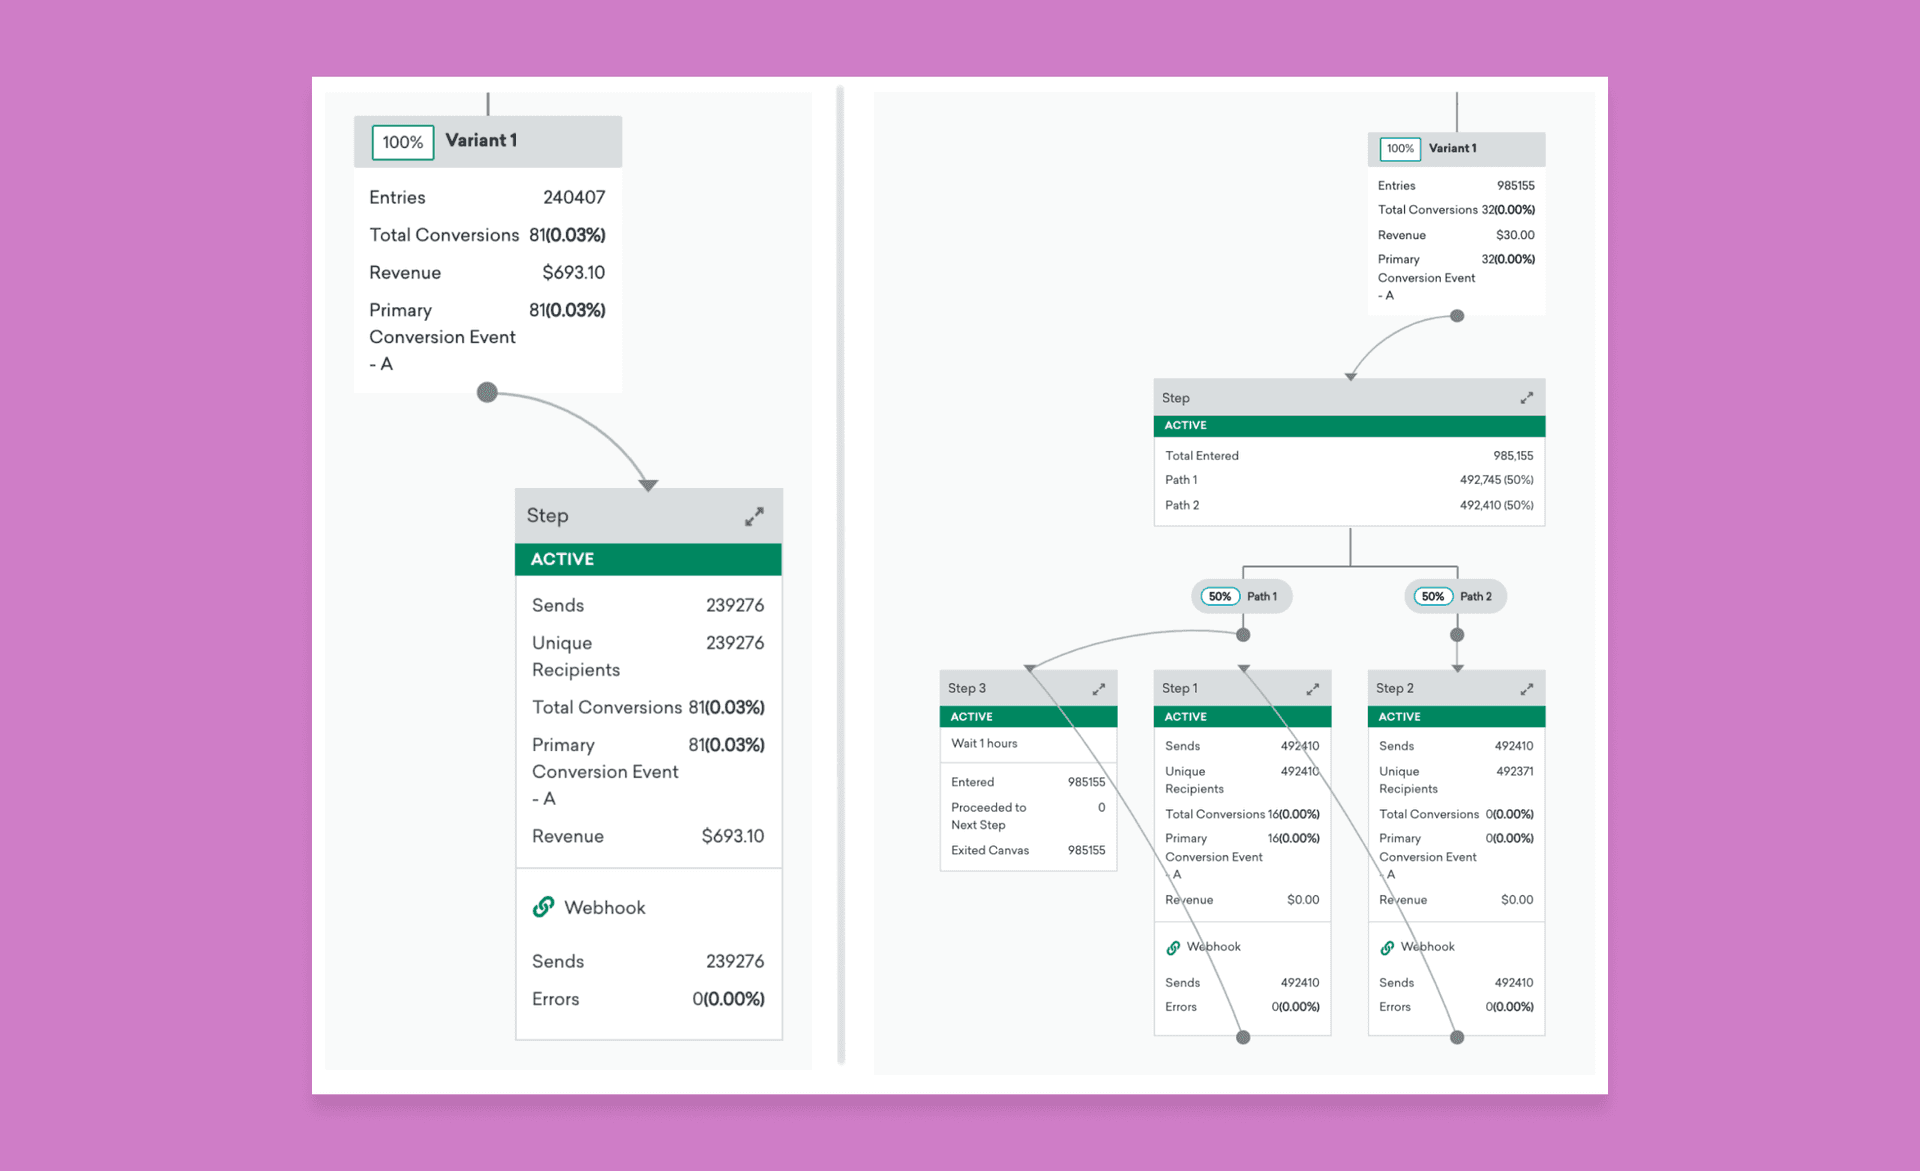
Looking to dig a little deeper into how different stages of the customer journey are playing out? Canvas provides brands with performance metrics for each individual message or step included in a given flow—including sends, unique recipients, conversion count, and revenue generated—as well as information on channel-specific performance (e.g. how did your push notification perform here?). That makes it possible to identify individual subsections of your Canvas that may not be seeing the results you expected and to optimize them going forward to see strong outcomes.
4. Braze Retention Reports
To build a sustainable business model, most companies today need to go beyond just acquiring more customers and work harder to retain those new users over the long haul. Marketers need to understand their current retention rates and take action on those findings to see the strongest possible results for their business.
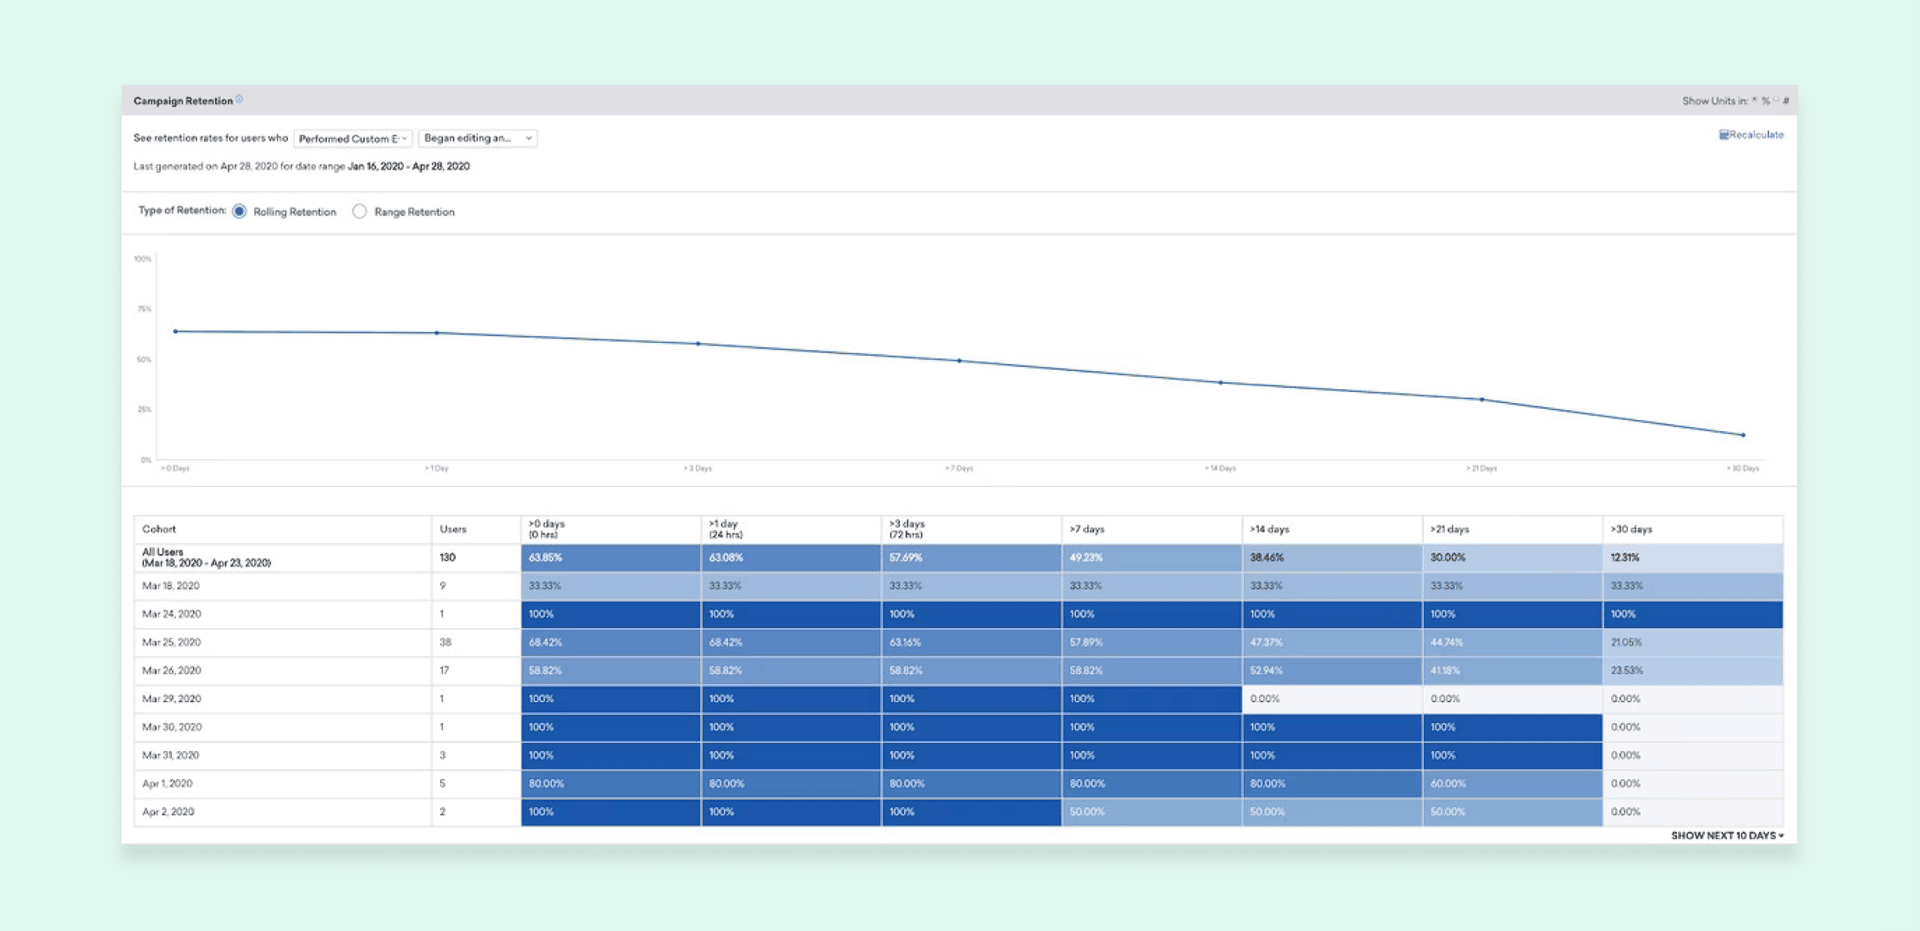
Analyzing the retention impact of each and every campaign can be time-consuming. Braze Retention Reports help brands easily understand user engagement over time for each and every campaign they create right within Braze. The tools allows marketers to see color-coded short- and long-term retention impacts on their brand’s audience on a campaign-by-campaign basis. Retention Reports can help marketers pinpoint day-of-week trends for recurring campaigns, determine where a given campaign’s impact has started to decline, and even help diagnose campaign fatigue. That in turn, can allow them to take effective action on these findings to reduce churn and build stronger customer relationships.
5. Braze Funnel Reports
Sometimes the issues with your marketing program can be hiding in plain sight. When there’s a single broken—or unappealing—touchpoint undermining your customer engagement efforts, you need to ensure that you have a way to identify that issue and turn things around. One powerful way to do that is by visualizing the marketing funnel. A visual representation of each user’s touchpoints throughout a given marketing campaign or customer lifecycle allow marketers to identify the precise moment where users fall away or stop engaging as actively, potentially allowing for targeted messaging that can boost retention and conversion rates.
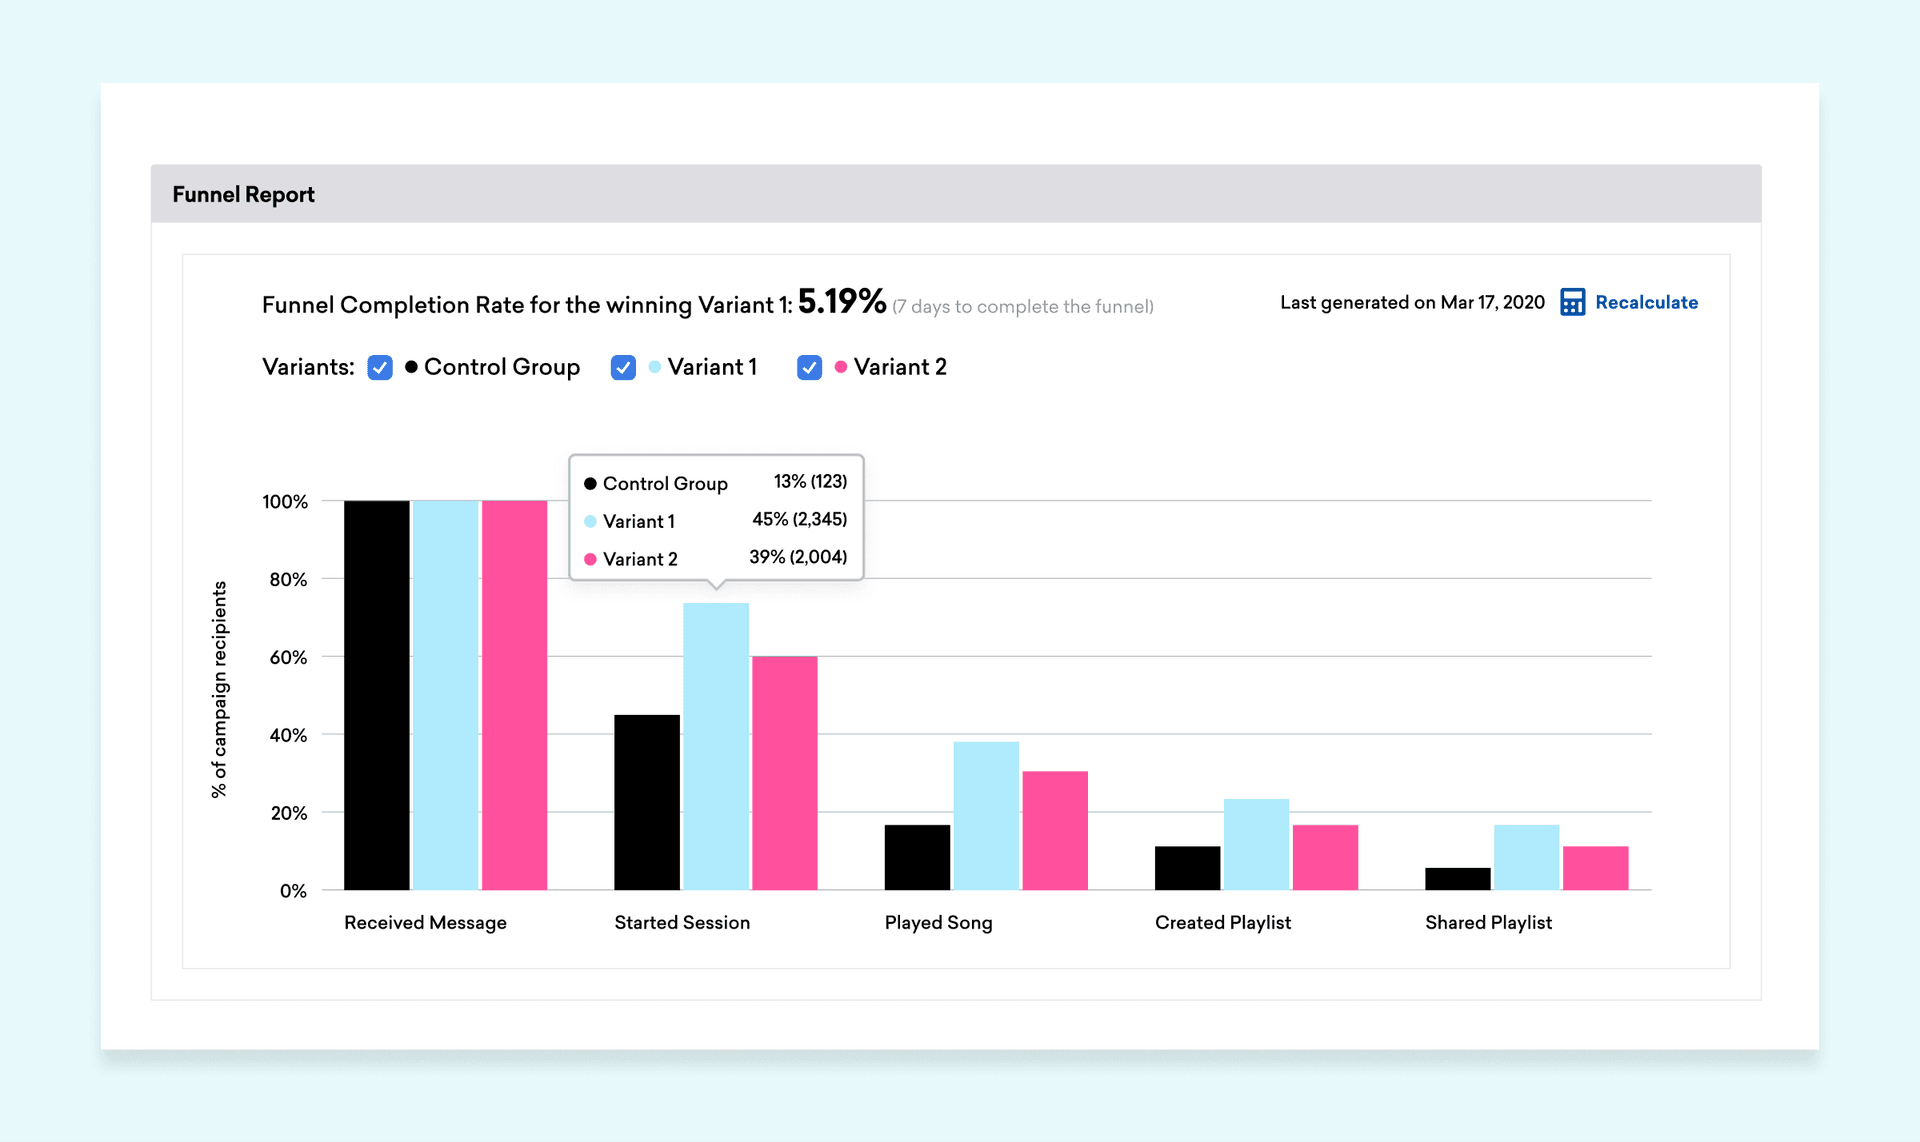
Braze Funnel Reports support this approach by allowing marketers to view post-campaign conversion paths, as well as relevant user actions and drop-off points, creating a visual report that makes it possible to to analyze the journeys customers take after receiving a campaign or entering a Canvas customer journey. Funnel Reports showcases the series of events that a campaign recipient progresses through in the month after they receive a campaign or enter a Canvas, making it possible to identify touchpoints where users are disengaging and optimize the overall experience of their journey.
Final Thoughts
Gathering data is important, but knowing what to do with it is even more important. The Braze platform’s visualization capabilities are designed to give marketers a better picture of their customer engagement efforts—where it’s working, where it isn’t—and to allow them to take effective action to optimize their customer relationships and business outcomes.
Interested in taking your customer engagement measurement strategy to the next level? Check out our exclusive customer engagement measurement guide for best practices, strategic guidance, and more!
Related Tags
Be Absolutely Engaging.™
Sign up for regular updates from Braze.
Related Content
 Article8 min read
Closing deals, driving growth for customers, and the team behind it: Life as an Account Executive at Braze
July 17, 2026 Article12 min read
BrazeAI™ marketing tools: The complete guide to AI-powered customer engagement
July 17, 2026 Article12 min read
AI email marketing: How to use AI to run smarter email programs
July 16, 2026