Mobile Year in Review: 14 Eye-Opening Mobile Stats from 2015 [Infographic]
Published on December 17, 2015/Last edited on December 17, 2015/2 min read
![Mobile Year in Review: 14 Eye-Opening Mobile Stats from 2015 [Infographic]](https://cdn.sanity.io/images/b7pblshe/marketing-prod/a59438b434adc0842fa996a14d33a8f09f398016-595x375.jpg?auto=format&fit=max&w=3840&q=75)

Team Braze
Time flies, doesn’t it?
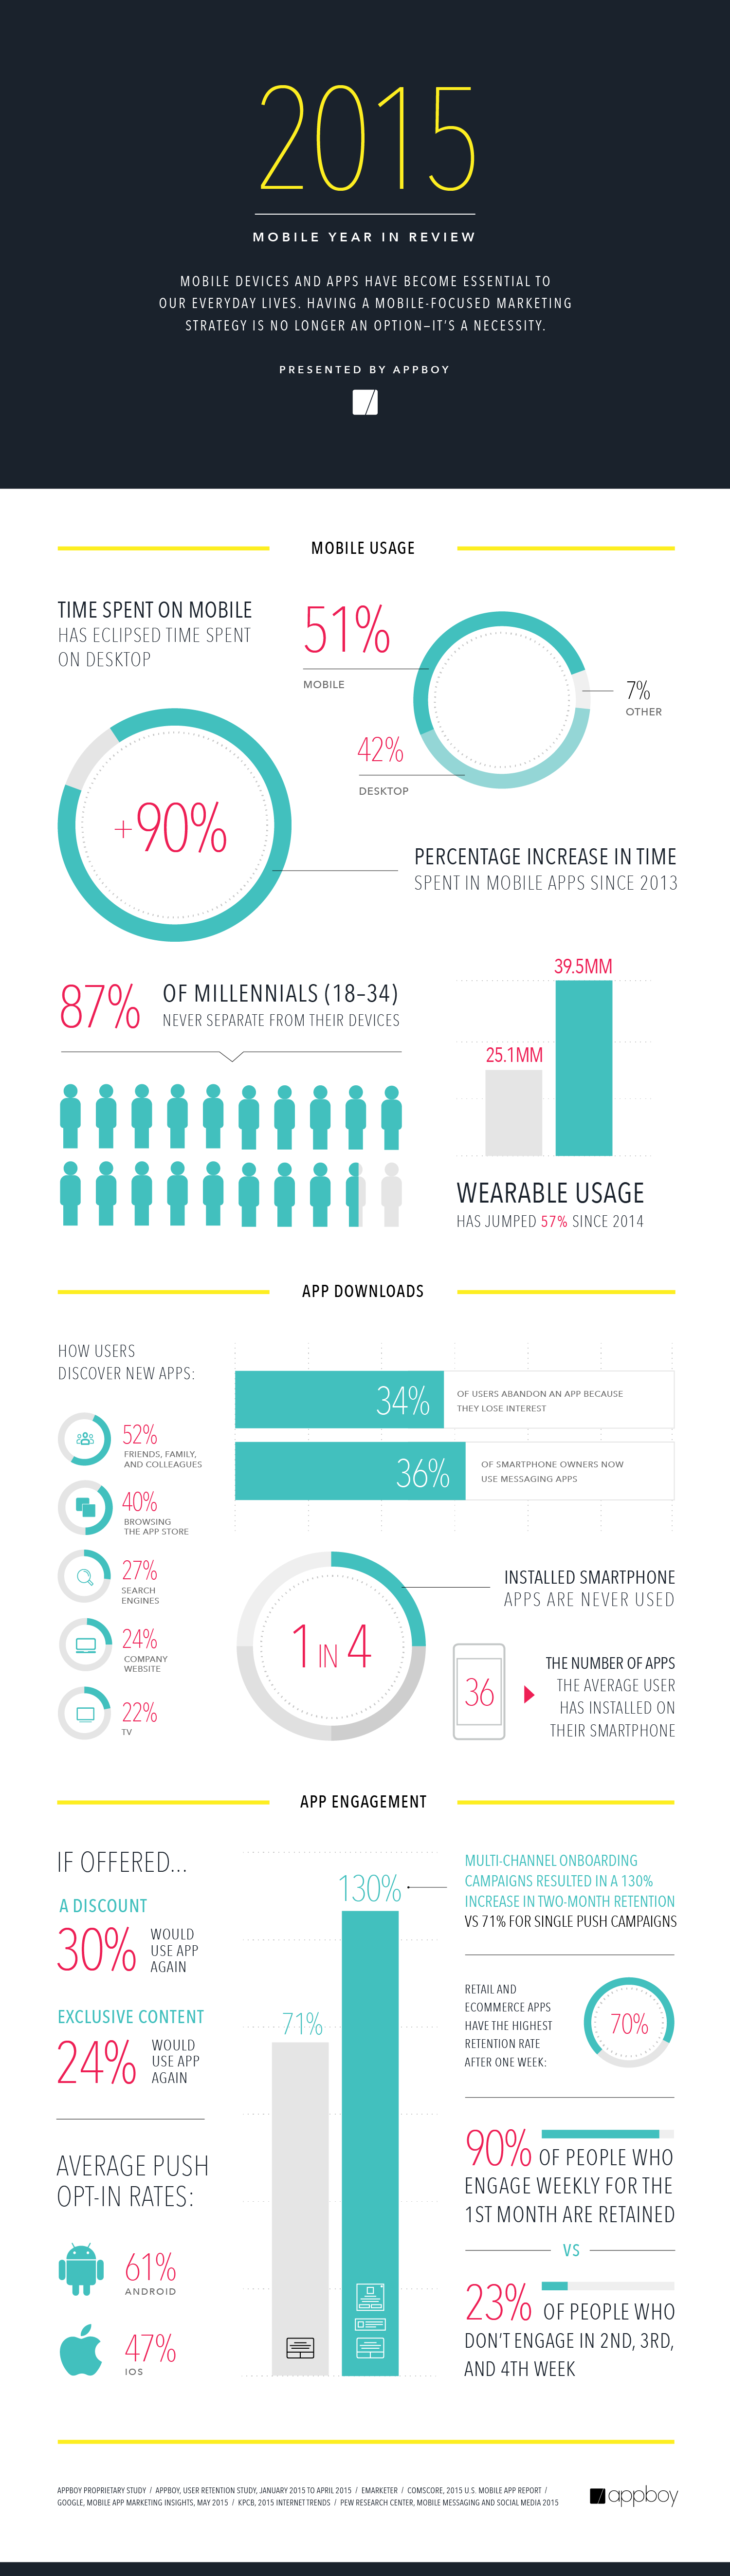
The end of the year is time for reflection, and alongside our new brand redesign at Appboy, we’re excited by the marked shift in consumer behavior from web to mobile in the past year. The way in which consumers are interacting with their mobile devices is changing rapidly, and marketers should use the data in the infographic below to keep ahead of the curve. Here’s how drastically mobile usage has changed:
- Time spent on mobile (51%) is now significantly higher than time spent on desktop (42%) – KPCB, 2015 Internet Trends
- Time spent in mobile apps has grown 90% since 2013 (total minutes: 409,847 in 2013 to 778,954 in 2015) – comScore, 2015 U.S. Mobile App Report
- 87% of millennials (18-34) report never separating from their mobile devices – KPCB, 2015 Internet Trends
- Wearable usage has jumped 57% from 2014 (25.1 million to 39.5 million) – eMarketer
Mobile Year in Review: 14 Eye-Opening Mobile Stats from 2015 [Infographic] #Mobile
Mobile devices have clearly become essential to our everyday lives, and the stats become even more interesting when we dive into how we’re using them: trends in app downloads and app engagement.
Check out the most interesting mobile stats from 2015 in the infographic and keep this data in mind as you plan your mobile marketing efforts for 2016.
Share this Image On Your Site
<p><strong>Please include attribution to Appboy with this graphic.</strong></p><p><a href=’https://blog.appboy.com/mobile-year-in-review-2015-infographic/’><img src=https://i0.wp.com/blog.appboy.com/wp-content/uploads/2015/12/2015-Mobile-Year-In-Review-By-Appboy.png?ssl=1′ alt=’2015 Mobile Year In Review By Appboy’ width=’1200′ border=’0′ /></a></p><p>
Be Absolutely Engaging.™
Sign up for regular updates from Braze.