Measuring Prediction Accuracy in the Braze Predictive Suite
Published on February 04, 2022/Last edited on February 04, 2022/8 min read


Boris Revechkis
Product Manager at BrazeNot long ago, artificial intelligence (AI) and machine learning (ML) appeared on the scene with great and sometimes exaggerated fanfare. Society is still debating whether AI ultimately leads to humanoid robots bent on destroying us all. Luckily, in the case of marketing, it’s just complicated algorithms helping marketers do their jobs better.
And some progress has been made on that front. As the hype and paranoia dies down, we’re left with a technology that can provide a lot of value—but only if you approach it thoughtfully. In that spirit, let’s take a look at the Braze Predictive Suite, which helps brands better identify and create customer segments based on propensity to carry out certain future actions, and the work that goes into ensuring that the outputs from these tools are accurate and actionable.
Our Intelligence team at Braze built the Predictive Suite to help marketers leverage AI/ML to better understand their customers and better execute their communication strategies. But as with any mathematical tools in a marketing context, these tools can only add value if they deliver real results. Marketers shouldn’t have to settle for pretend AI or bad AI. We want our customers to maximize their own success and keep us honest.
Accordingly, we found during the process of developing the Predictive Suite that the only workable way to accomplish both these goals is by:
- Providing custom-built predictive models on demand for our customers
- Making sure that these models are accurate before customers make use of them
Prioritizing Transparency
The first goal proved to be tricky. We were able to solve some complexities by checking the accuracy of each model’s Predictions twice—a process called “validation”—in order to detect any unexpected disruptions or problems in the data. (We’ll touch on what it means to check accuracy for Predictions later). Thankfully, achieving this goal helped make it clear how we could achieve the second one: That is, we could share the validation result for a given Prediction with the customer in question, allowing them to see an unfiltered measurement of the model’s predictive accuracy.
Here’s what that looks like in practice:
- The customer starts by building a Preview Prediction on the Braze dashboard using their custom definition of churn (e.g. hasn’t engaged in 14 days vs. hasn’t made a purchase in 7 days) or custom definition of purchasing.
- Braze will automatically create that Prediction, measure its expected accuracy immediately with historical data, wait one customer-defined Prediction window, and then check accuracy again against the actual outcomes.
- Next, both the expected and real-world accuracy will be shared with you via the Prediction Quality indicator on the dashboard.
Here’s the exciting part—all of the above can be done before your brand even purchases the Predictive Suite or leverages it to send a single message. Plus, we continuously revalidate these Predictions, so if there’s any drop in Prediction performance, we’ll let you know.
How We Measure Accuracy
Given that, the obvious question that arises is: How, exactly, does one measure Prediction accuracy?
Let’s say that we have a predictor (like the one in the Braze Predictive Suite) that’s trying to determine whether or not a given user will make a purchase in the future. The predictor will take data about that user, pass it through the relevant algorithm, and spit out a propensity score. Then, you can assess which scores should be seen as reaching the level of a “will purchase” score and which scores you will consider “won’t purchase.” These scores make it possible to, for instance, send a special promotion only to users who have a purchase likelihood score above the threshold you chose. (See below for more on how the Braze dashboard helps you determine what threshold is best.)
In this scenario, that’s the Prediction—whether a particular user will make a purchase in the future or not. And if we use historical data when we initially create the predictor, we’ll also know the real outcomes; that is, we can predict if a given user will make a purchase, then look at what they actually did to see if the Prediction came true.
The possible Predictions and possible actual outcomes can be used together to make a so-called “confusion matrix,” where the rows indicate what Braze predicted and the columns reflect what the user actually did:
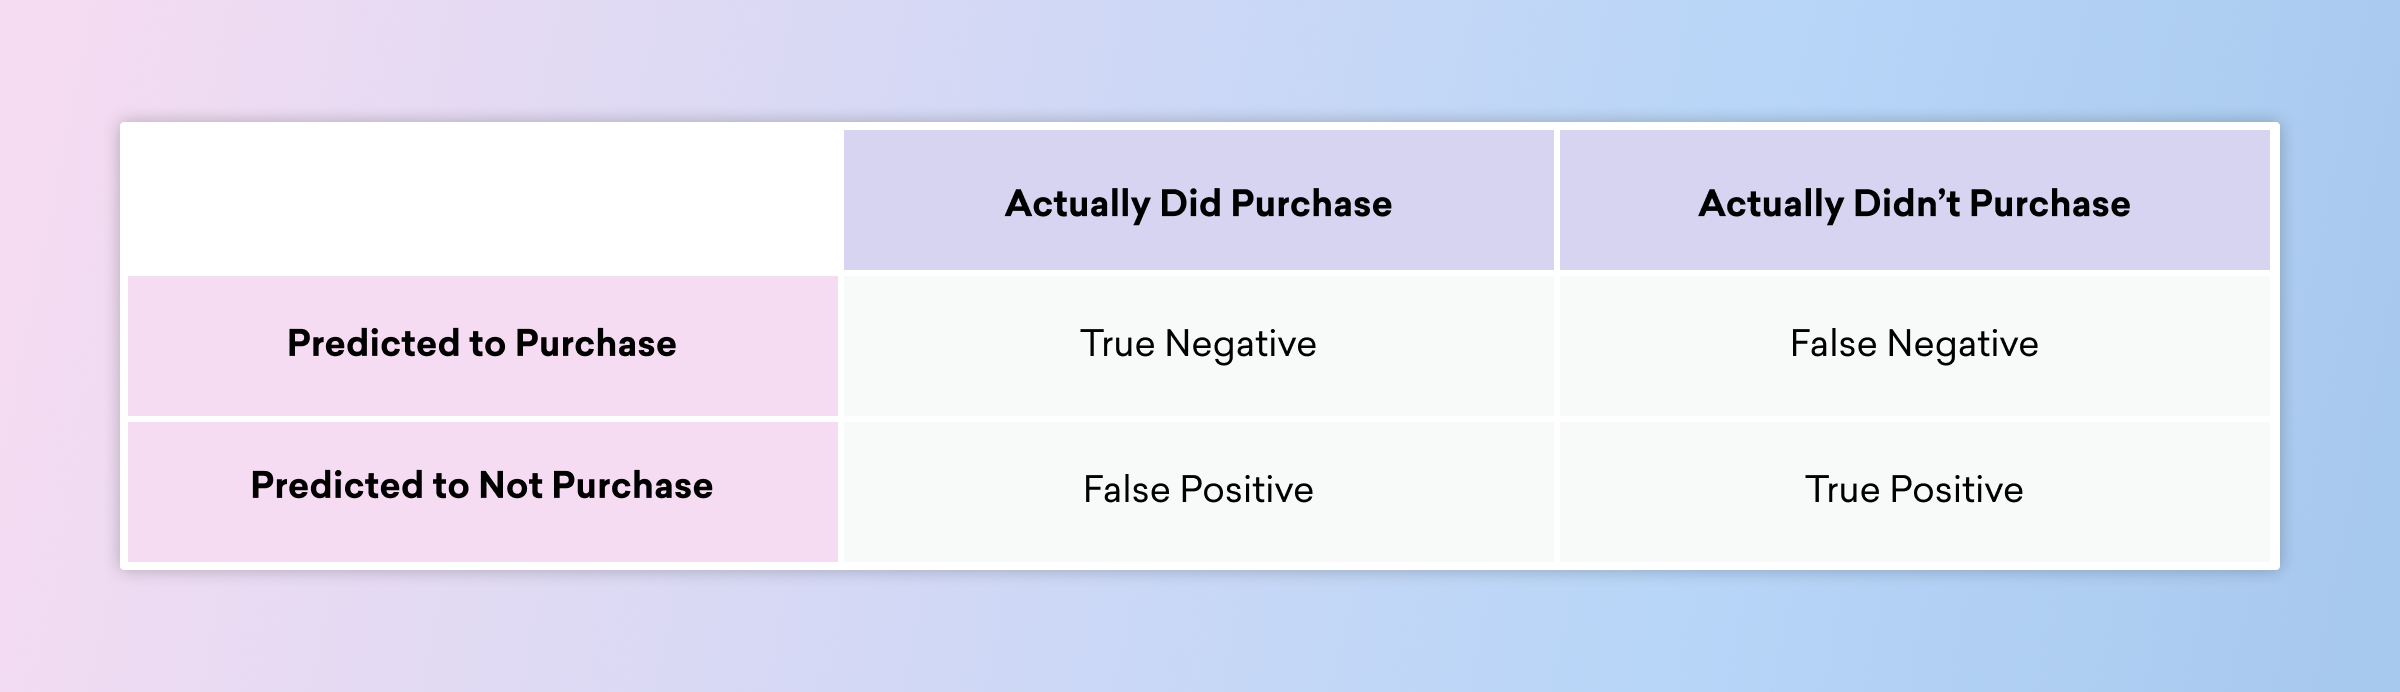
There are many ways to quantify these different outcomes (and, in doing so, quantify the accuracy of the predictor itself): Sensitivity, specificity, precision, recall, positive predictive value, false discovery rate, and much, much more. Each one generally corresponds to different ratios of the various outcomes described in the table above, with the different measures emphasizing (or de-emphasizing) the importance of different kinds of outcomes.
Knowing which metrics you want to maximize (and which you want to minimize), as well as the cost/benefit of each possible outcome is critical if you want to determine whether leveraging a given prediction will ultimately help boost your bottom line. In that sense, it’s comparable to p-values for A/B testing experiments—that is, it provides a single number that can tell you whether you have some truly beneficial or not when it comes to a given Prediction.
Measure Prediction Accuracy in Practice
For each Prediction made using the Braze Predictive Suite, we provide a metric called Prediction Quality, which describes how good the Prediction is at detecting true positives across all possible messaging audiences you could choose in the simulator. This provides a single summary number on a simple 0-100 scale, providing an overall picture of how much lift this Prediction provides, as compared to guessing. This metric is calculated once on historical data when your Prediction is created and then again against actual user outcomes so you can keep track of accuracy. (For more details on how the Prediction Quality metric is calculated, visit our documentation.)
That being said, a concrete example will help demonstrate what this all means in practice. In particular, we need to consider true and false positives here to be able to thoughtfully decide how to use a Prediction in your strategy.
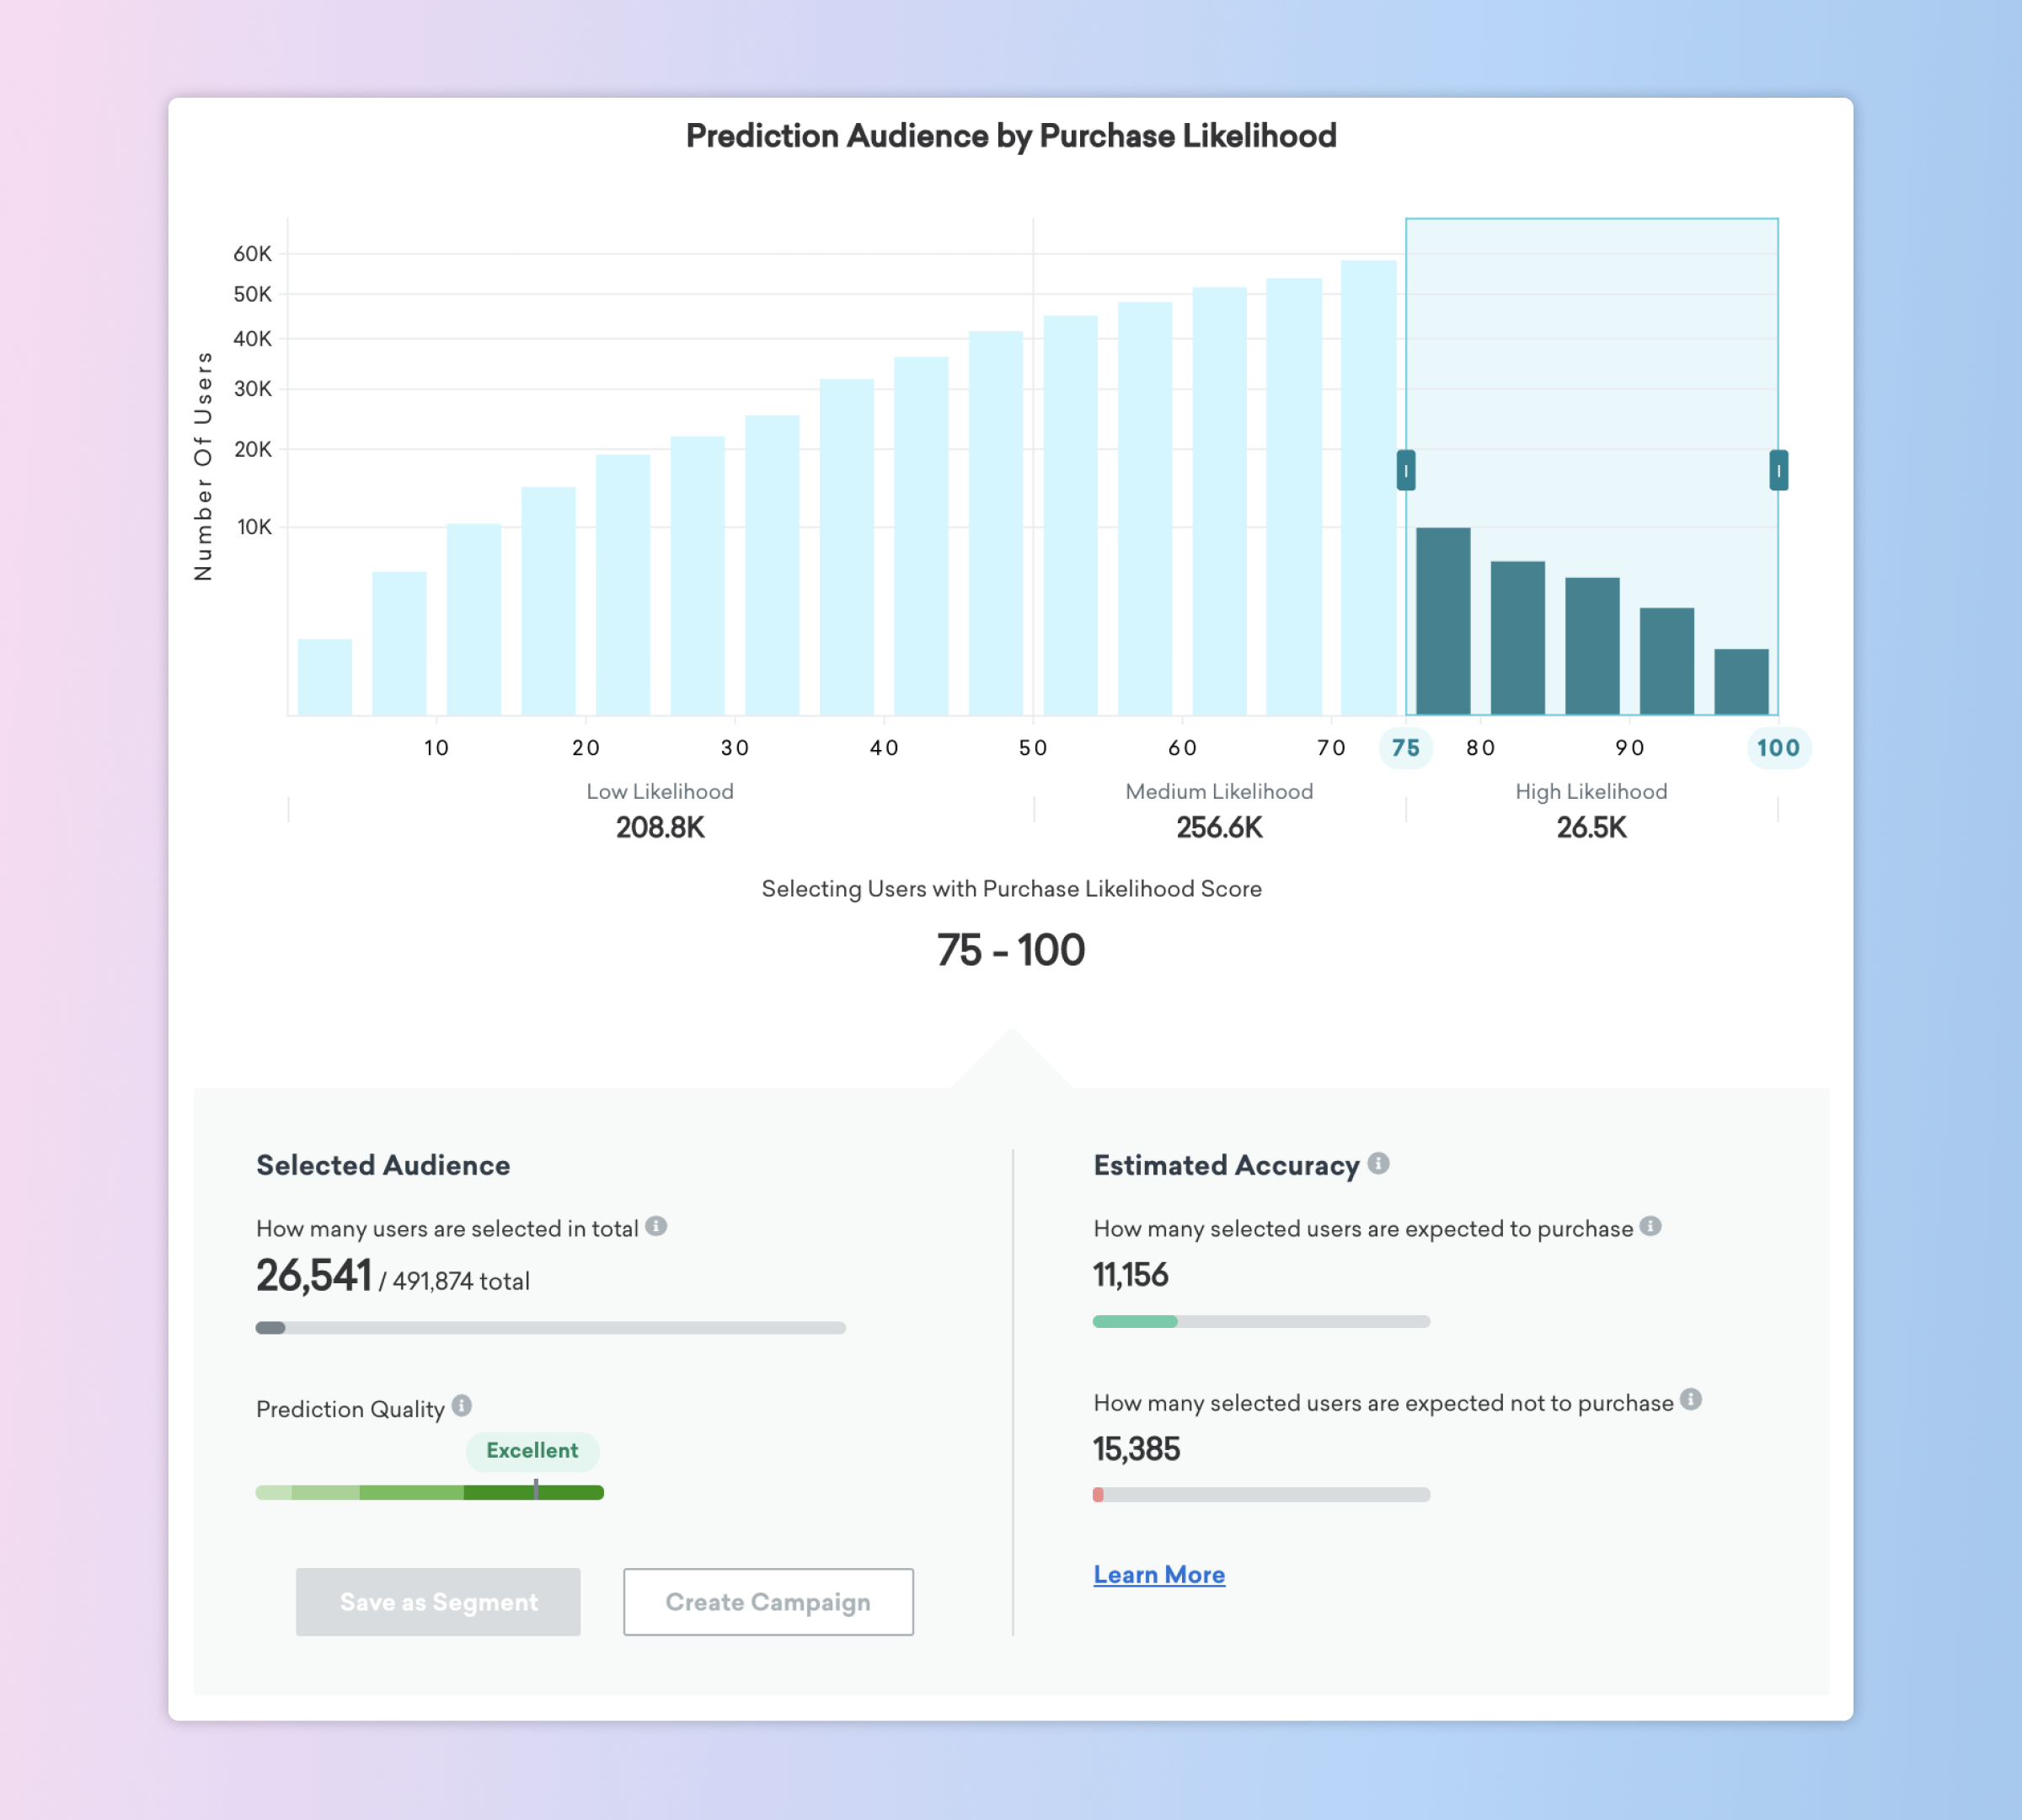
In the example above, we’re working with a population of about 500,000 users who could potentially make a purchase. If we message only users with a Purchase Likelihood score of 75 or more, we’d reach 26,541 users. Based on the historical purchase behavior of this audience and the accuracy of the Prediction, we estimate that roughly 11,000 of those users will become purchasers—which, as the green progress bar shows, is only about 25% of all purchasers. Accordingly, that percentage is the true positive rate.
The red progress bar gives us an additional piece of key information—namely, that this setting will also target 15,385 users who won’t make a purchase, despite the fact that we’re targeting the individuals in this population with the highest purchase likelihood. These users are false positives: That is, individuals who the Prediction tells us will make a purchase, but who actually won’t. In this case, only about 15,000 of the 447,000 users who won’t make a purchase would be messaged, which is about 3.3%. While that’s low as a percentage, your specific audience and business model will inform whether that’s an acceptable level of error for your business.
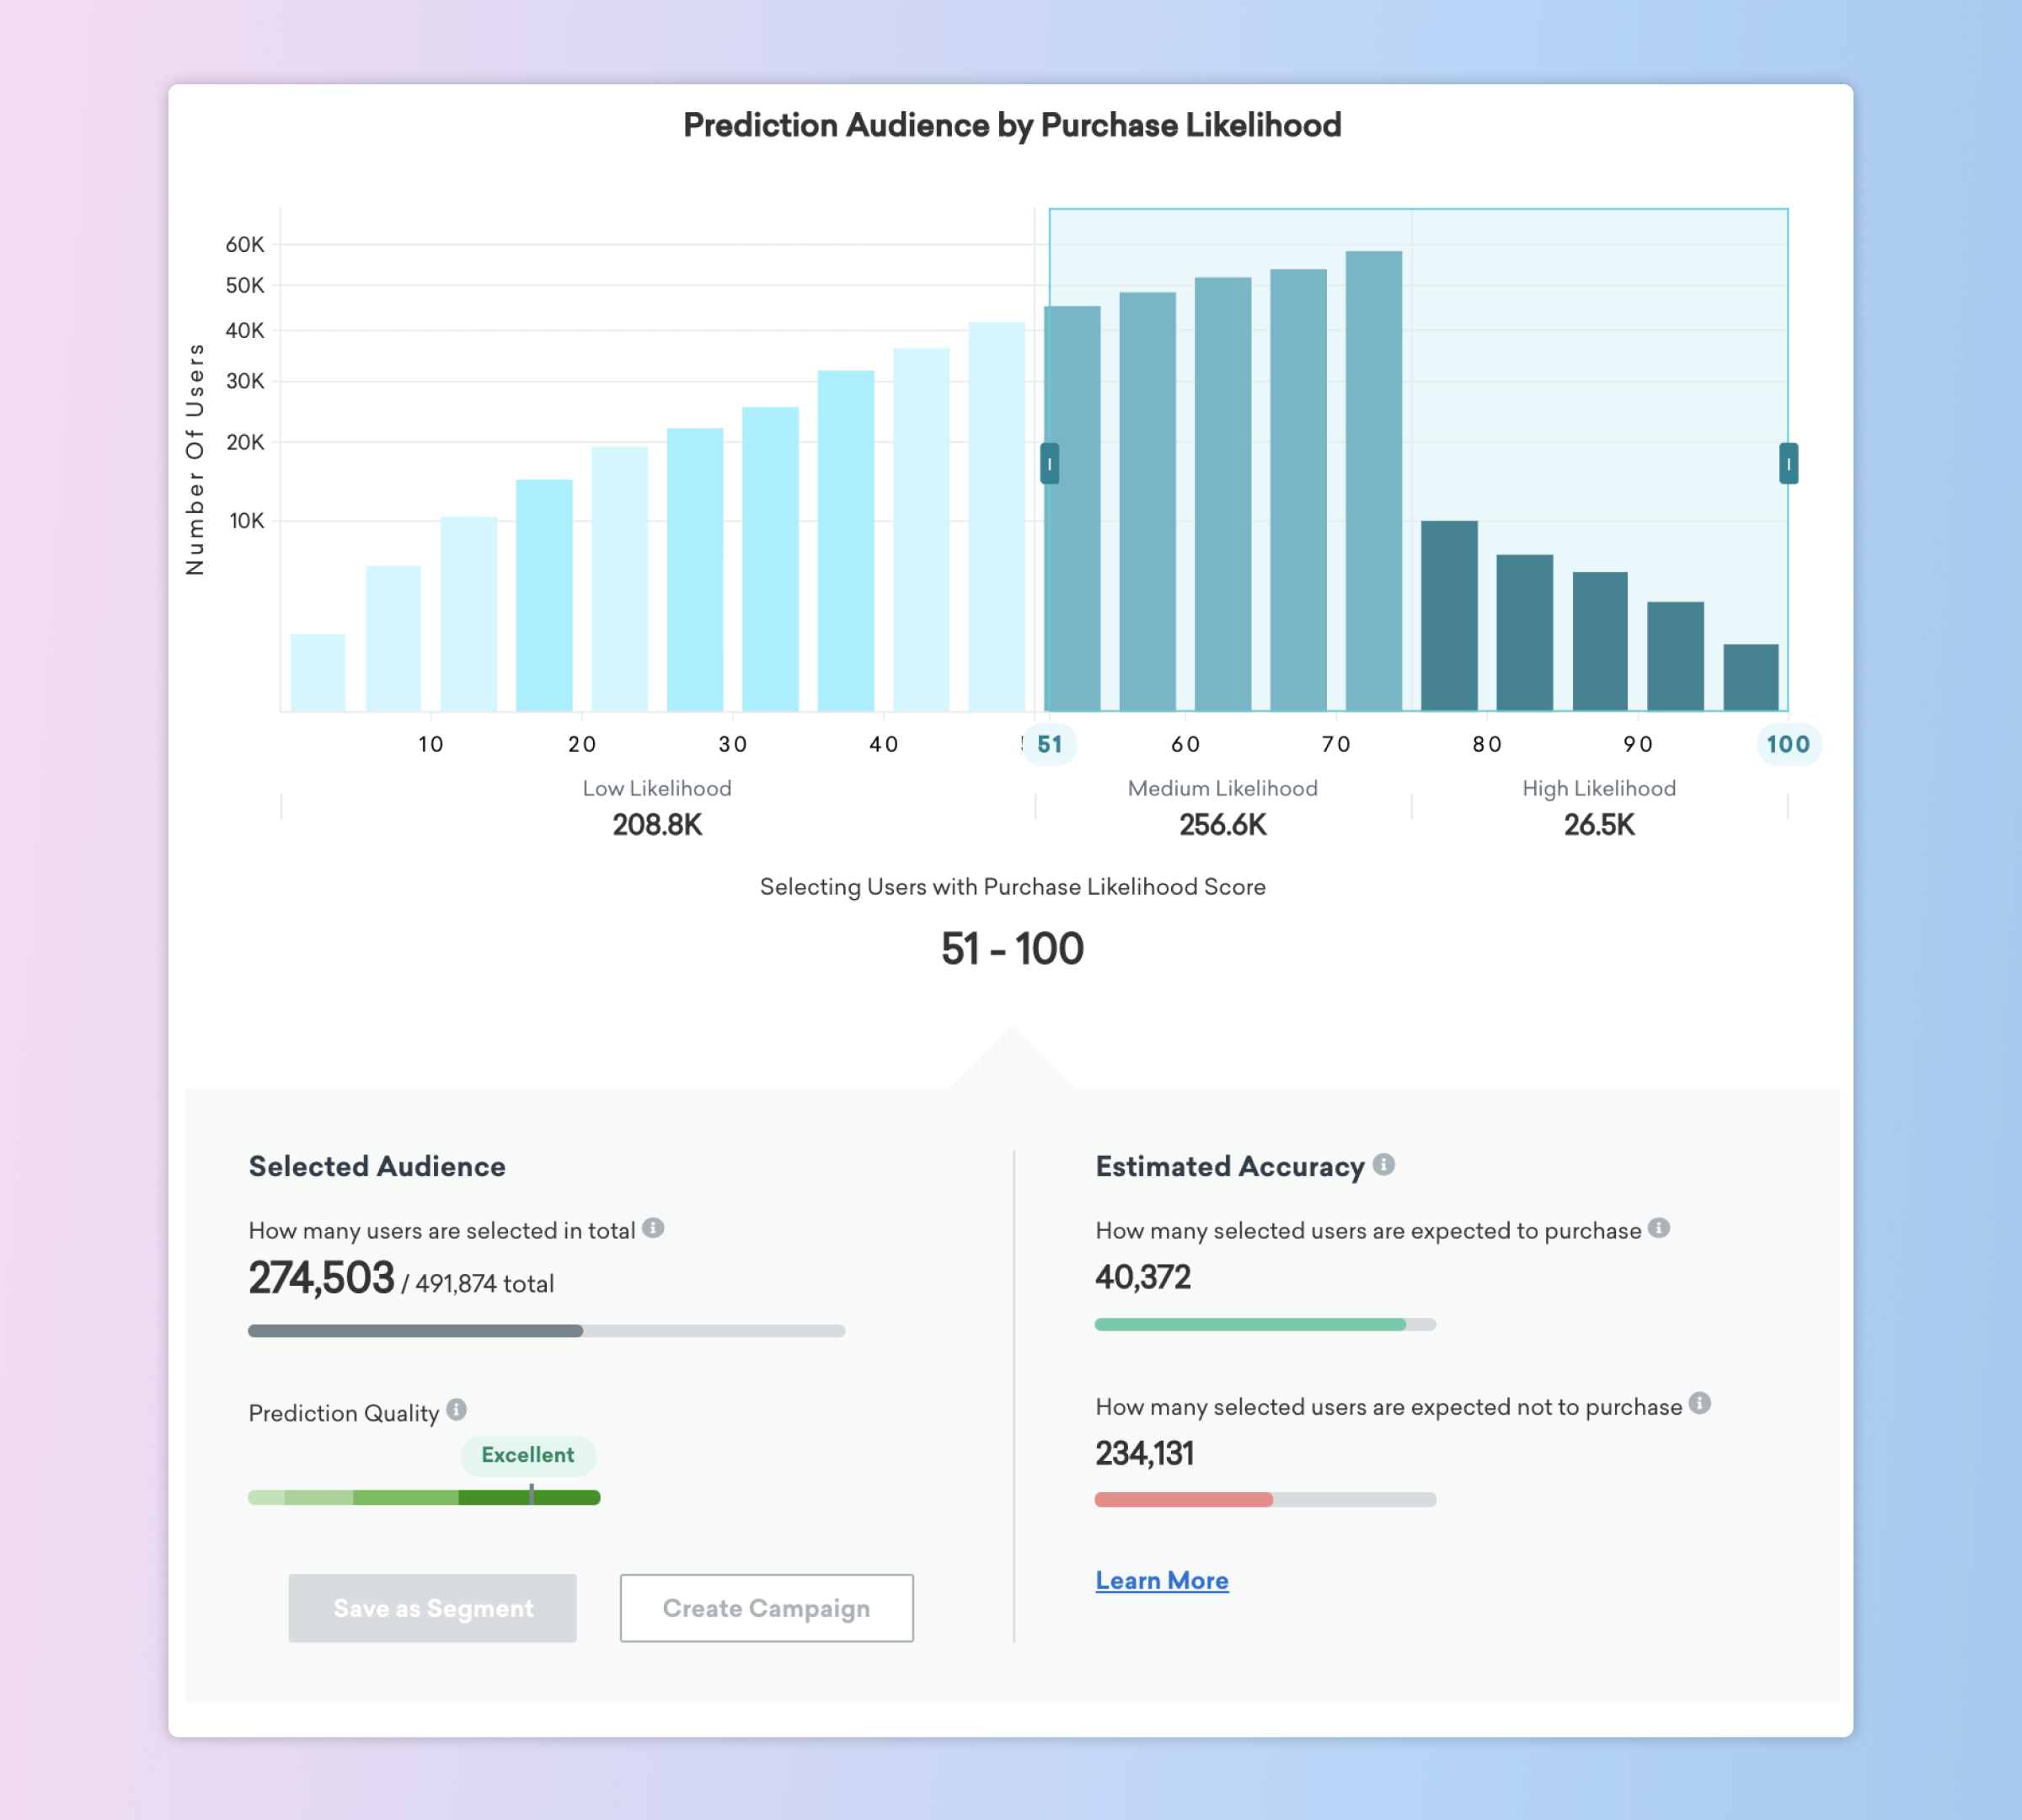
That’s just one potential approach here. Alternatively, you could choose to message all users who have a Purchase Likelihood score of 50 or more. That would ensure that you’ll reach about 90% of the actual purchasers in your total audience (as indicated by the green progress bar)—that’s about 40,000 users. However, you’ll also be messaging more than 230,000 users shown in the red bar; that’s over half of the non-purchasers in your audience.
Is this approach worth it? That depends on your users, your messaging strategy, the cost of any promotions or incentives you include with these messages, the benefits associated with an additional purchase, how likely this promotion is to change user behavior, and all the other variables that might be relevant to your business. At the core, it’s a cost vs. benefit trade off, and the selector in the dashboard allows you to simulate different scenarios and plan for different outcomes to choose the approach best suited for your brand.
In the long term, it’s necessary to do this kind of analysis on any Prediction you might leverage, no matter how accurate it might be, simply because AI doesn’t have access to all the context and business logic that you know about.
Final Thoughts
Some of these concepts—such as true and false positives—might be new to you. But as AI/ML become more central to modern customer engagement, we expect that they’ll eventually become as ubiquitous as concepts like the p-value. Accordingly, those of us here at Braze are striving to make these tools and concepts as easy to put into practice as possible.
Curious how the Predictive Suite has worked for other brands in practice? Check out this look at how leading brands Delivery Hero and 8fit are using Predictive Churn and Predictive Purchases, respectively, to help reach their business goals.
Be Absolutely Engaging.™
Sign up for regular updates from Braze.