The Road to Reliability Starts with Better Observability
Published on January 24, 2020/Last edited on January 24, 2020/9 min read

Mark Paradiso
Site Reliability Engineer, BrazeHaving just passed $100 million in annual recurring revenue, Braze has been preparing in various ways for the future as a large, independent company. As part of that effort, my team, the Site Reliability Engineering (SRE) organization at Braze, has focused on ensuring that the company’s observability tools meet the needs of a rapidly growing organization. During December 2019, Braze processed an average of more than seven billion incoming API requests every single day from our two billion monthly active users. This resulted in more than 70 terabytes of incoming data on average each day—and as you can imagine, that is a TON of data to digest and understand!
Naturally, this was a focus area when it came to increasing observability. Because the data set is so large, we’d never previously logged every single API call made to Braze for diagnostic purposes. This led to some challenges that will be discussed below. A big SRE project for us was to empower more employees to be able to debug request data, provide easier-to-use tools, and have more information available to help our customers.
Historically, Braze has had various systems in place such as Papertrail and Sentry which we use to centralize a record of all our application and system logs as well as any unexpected errors. However, these systems are meant for tailing logs, searching using boolean logic, and triaging issues for the engineering teams. Because of all this, they tend to have an entry point that requires a pretty technical background. Sentry, for example, is very helpful for errors. It can show you the stack trace of errors and warnings, but it isn’t meant as a diagnostic logging tool. Meanwhile, Papertrail is a centralized log-aggregation service. It supports tailing logs, grouping them by system or file, creating alerts, and narrowing in on specific timestamps. However, we have tens of thousands of servers in Papertrail. Centralized log management is helpful, but it doesn’t provide any visualizations. On top of that, log management systems typically charge by the gigabyte, and with all of our request data reaching terabytes per day, a new in-house solution seemed optimal and offered the added bonus of helping us understand our data from a high level.
We also noticed we were in a routine where our Support and Success teams would have to ask Engineering teams for help when troubleshooting specific API calls amid the sea of those seven billion calls each day. This worked when we were a small startup with only a few customers—however, we knew this model would never scale. As part of our growth plan, the team set out on a journey to improve our own observability, and address these various pain points.
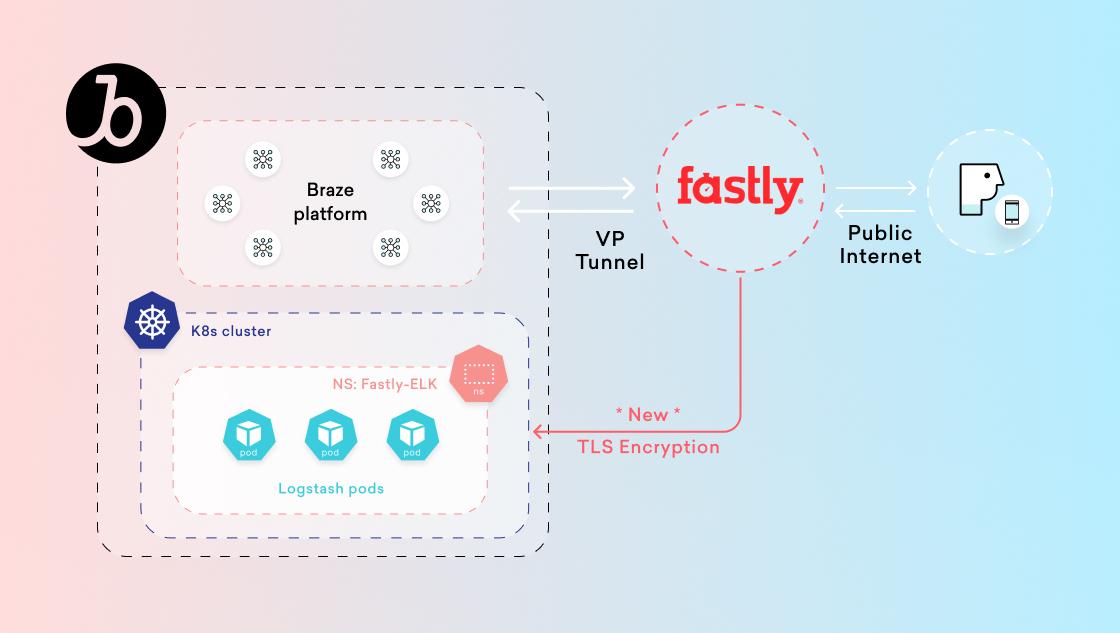
Braze uses a Content Delivery Network called Fastly. Fastly is the outermost layer of our network, routing traffic to our API endpoints, and providing analytics and logic, at the edge. Fastly directs our customers’ traffic to where it needs to go.
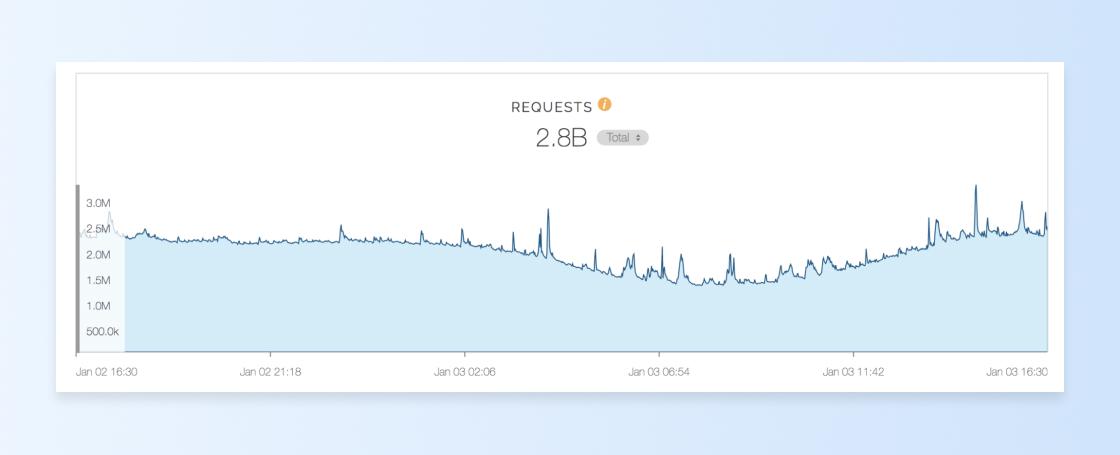
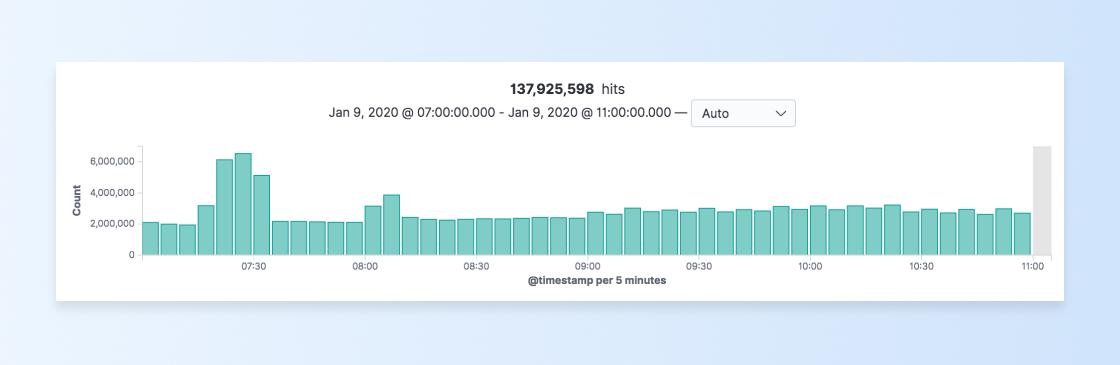
Fastly has an intuitive and performant layer of logging and analytics inherently built in. We can see things like total requests:
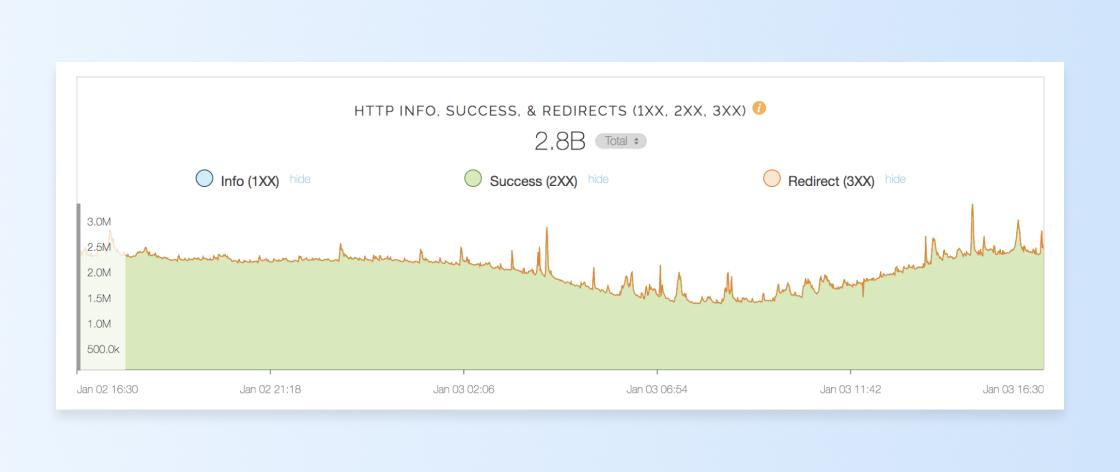
They also allow you to see the breakdown of various response codes you are returning:
This is a pretty useful way to visualize and understand the data. However, we wondered if we could replicate this model in other useful ways. For example, if we want to see how this trends for one single customer, Fastly doesn’t allow us to drill in that way. But as it turns out, Fastly offers a logging service directly from the Braze network’s edge. This was even more useful than logging from our application code, for one reason in particular. When proactively planning for outage scenarios, we knew there were some cases where our API servers would be at capacity and could not accept any more data. Unfortunately in this scenario, we’d have to turn some requests away, and if we logged from our application code, we would miss logging those requests entirely! However, if the logging happens from Fastly, we can still capture the requests. This is super important because if we ever drop a request, that is one of the most valuable times to have logs!
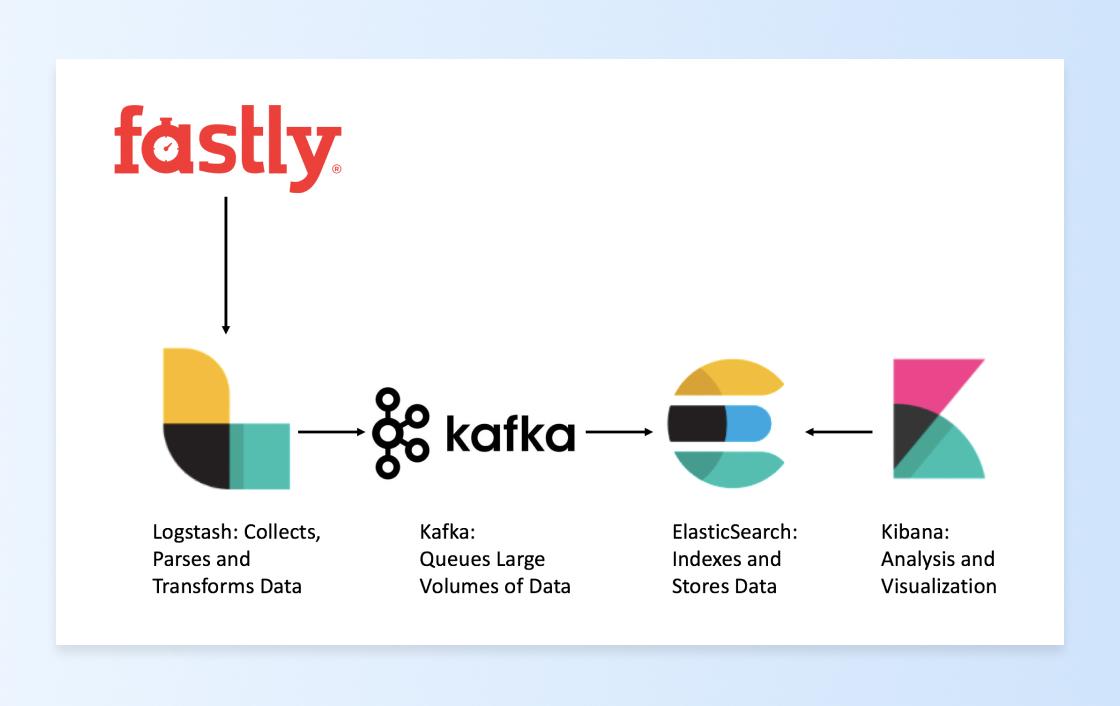
So we set out to integrate Fastly logging with our ELK stack. ELK is an acronym that stands for three separate services: Elasticsearch, Logstash, and Kibana.
- Elasticsearch is a datastore great for indexing and storing large volumes of data.
- Logstash collects, interprets, and transforms data.
- Kibana is a web dashboard that allows you to visualize your data.
That stack also includes one additional element: Kafka. Because of the huge volume of requests and volumes of data we’re processing (more than two petabytes per month), we decided to leverage Kafka to consume the data from Logstash and publish the data to Elasticsearch, providing us with an elegant buffer in the process. Kafka gives us the ability to pause and replay data, while also giving us a much more graceful error-handling toolkit than Elasticsearch has. Elasticsearch does not always handle this volume of data very well, so being able to pause and replay data when things error out can help to ensure that no data is lost. Lastly, having Kafka sets us up to be future-proof, as we can always scale up brokers and add more consumers if we decide we want to publish the data elsewhere later on.
This wasn't a trivial task, as there were many challenges we faced along the way. For starters, we had to integrate the ELK stack with Fastly and set up Kafka to handle the immense volume of traffic.
Our team had to ensure encryption to keep our data safe and secure, as well as set up routing rules to direct all the traffic. We also had to scale the number of Logstash servers, in addition to determining the most efficient way to allocate CPU and memory. These servers need to be able to take in all the data Fastly sends, then parse and transform the data to format it the way Kafka expects it.
At peak, we're processing 200 megabytes per second from Fastly! In order to write that much data to Kafka, we had to perform proper capacity planning to ensure the Kafka brokers could meet the load. This meant tweaking things like the number of "partitions." Partitions allow you to parallelize a topic by splitting the data in a particular topic across multiple brokers. Each partition can be placed on a separate machine to allow for multiple consumers to read from a topic in parallel, and each partition can be written to separately.
To make it all happen, I worked on this project with our DevOps team. After months of hard work, we were able to set up all this architecture, and were ready to go back to Fastly and log all these different pieces of information that we might want to look at. And with the Kibana web UI, aided by the very robust and elegant Elasticsearch engine, we are now able to look at our data in some very powerful and easy-to-use ways.
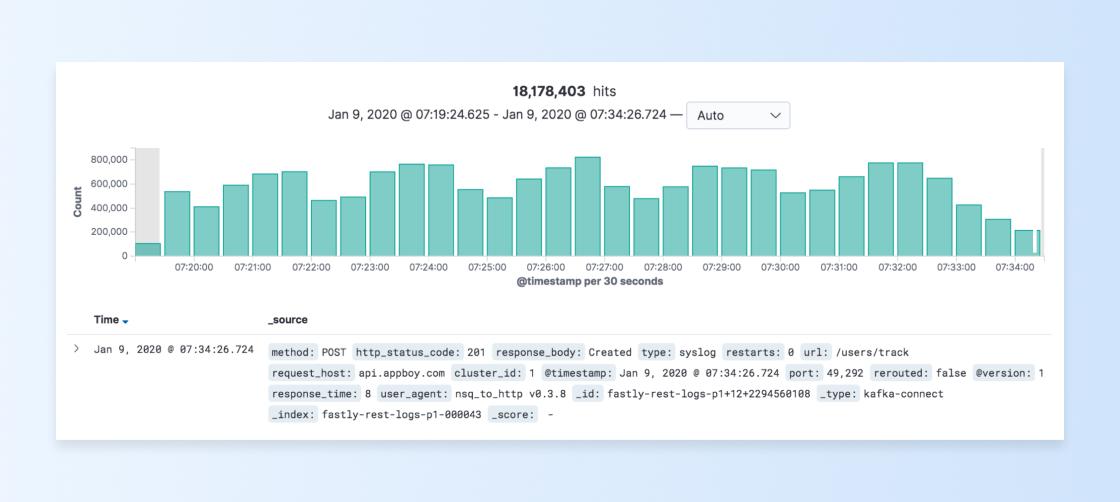
Let’s say we want to get more insight into how our REST API is being used. One problem we’d faced previously in terms of reliability is that we’d have massive, sudden spikes in traffic. Usually they’d only last a few minutes, and tracking down which customers made the requests and the bodies of the requests was a challenge. Not anymore:
This has been immensely useful for finding very specific requests and gathering more data. Using Kibana, we can easily zoom in, look at this spike of API requests, and gather much more information on the surge, such as response codes, response times, the user agents that sent the request, the endpoints that were hit, and even more:
We also wanted to see trends over time, which was yet another reason why we chose Kibana, because Kibana has a feature to build dashboards to visualize these types of trends. Now we can easily see the breakdown of how our various URL endpoints are being used. The graph below shows a breakdown of API traffic by endpoint, with intermittent spikes around 07:15 and 08:00am. Notice how all the lesser-used endpoint traffic stayed pretty consistent, but one endpoint—our ingestion endpoint—spiked pretty high around 07:15am:
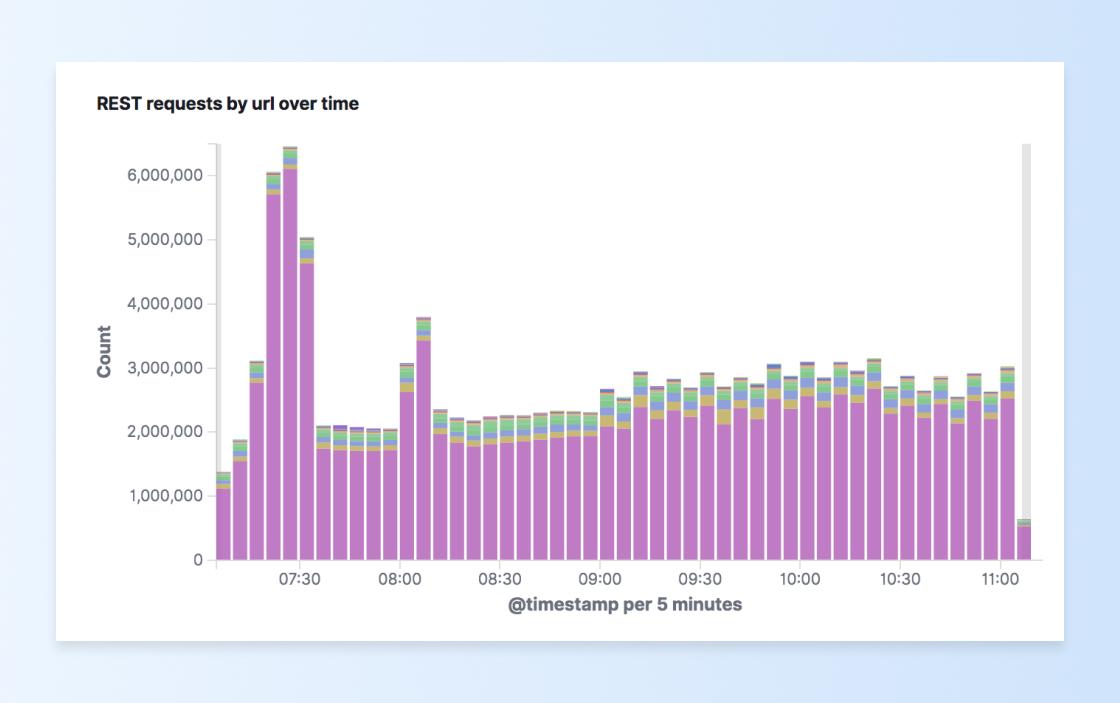
Noticing this trend, we can also see how different companies are using our endpoints over time. Grouping that same graph by customer, we can quickly see a pale yellow surge in requests that happened around 07:15am and easily identify the customer:
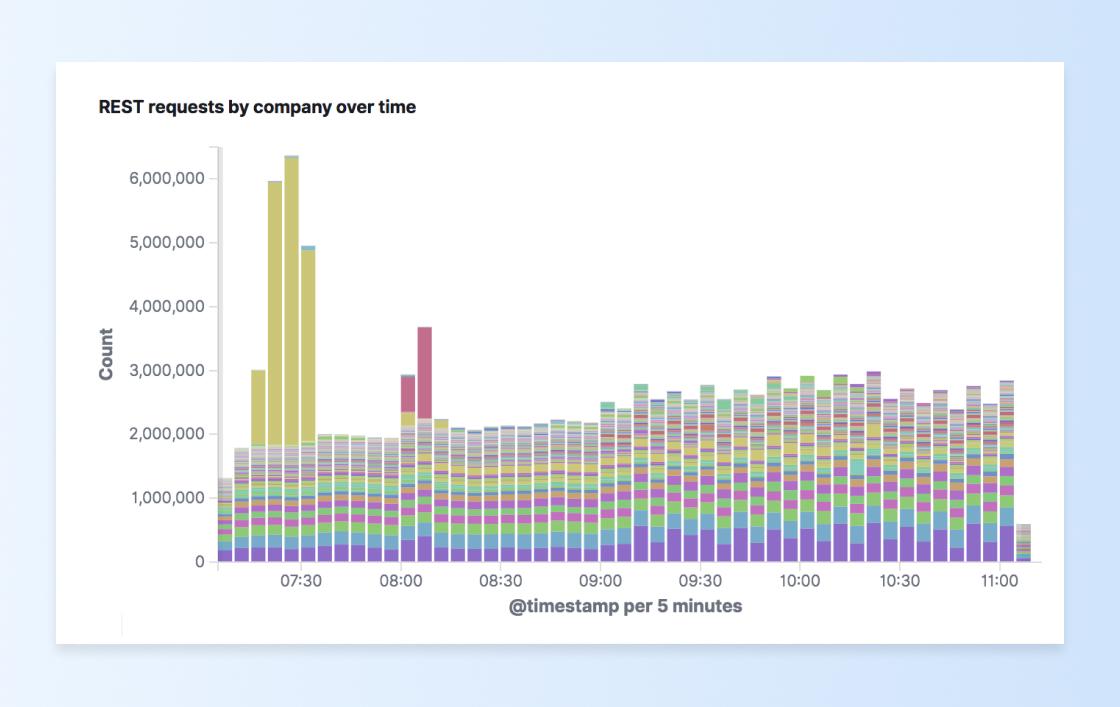
REST API traffic more than tripled for about 20 minutes because of one customer! It can be hard to scale something that sporadic. That’s why having all this information can help us make better decisions.
All of these details combined into a few different dashboards enable us to understand our immense volume of API data faster than ever in all-new ways. We can also throw any number of filters on this data to zoom into a specific company, status code, URL, or many other ways to see how the trends change over those dimensions.
Final Thoughts
Since building this tool on top of our API data, it has given us new ways to interpret it in aggregated ways. It’s also let less technically savvy employees in on the fun, since this approach is pretty intuitive and doesn’t force them to learn a bunch of formulas or use the command line to get the data they want. This is hugely important as it frees up engineers to spend more time building new features, as well as letting our application support teams get the correct information quickly with fewer people involved to respond to our customers faster.
Interested in working on projects like these? We’re hiring!
Related Tags
Be Absolutely Engaging.™
Sign up for regular updates from Braze.