Revenue Report
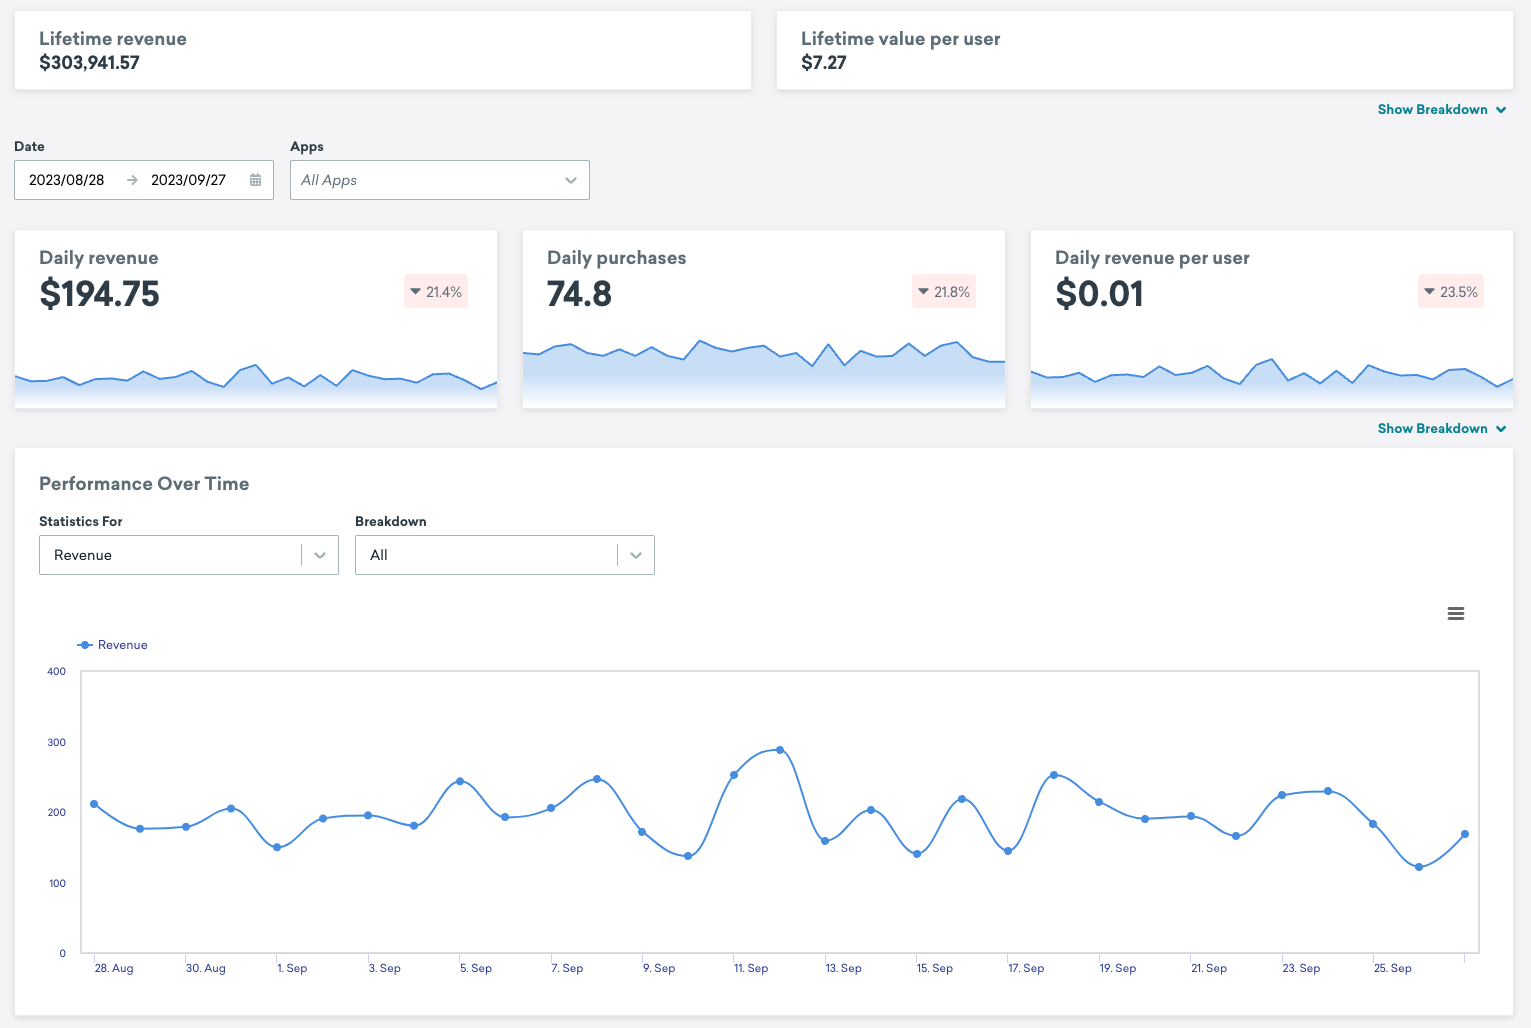
The Revenue Report page allows you to view data on revenue over specific periods of time, a specific product revenue, and your app’s total revenue.
To view a report for your revenue from the dashboard, go to Analytics > Revenue Report.
If you are using the older navigation, this page can be found under Data.
Customizing your revenue report
You can customize your revenue report by selecting a date range, the apps to report on, and parameters.
Filtering by date and apps
Select the date range for your revenue report and, if you like, a specific app or selection of apps.
Filtering by parameters
The Performance Over Time graph shows the data for different parameters, which can be selected in the Statistics for dropdown. You can optionally breakdown the data of certain parameters in the Breakdown dropdown.
You can view the following data in the Performance Over Time Graph:
- KPI Formulas
- Purchases
- (Optional) Purchases By Product
- Revenue
- (Optional) Revenue By Segment
- (Optional) Revenue By Product
- Revenue per Hour
- (Optional) Revenue per Hour By Segment
- Revenue per User
Viewing the product breakdown
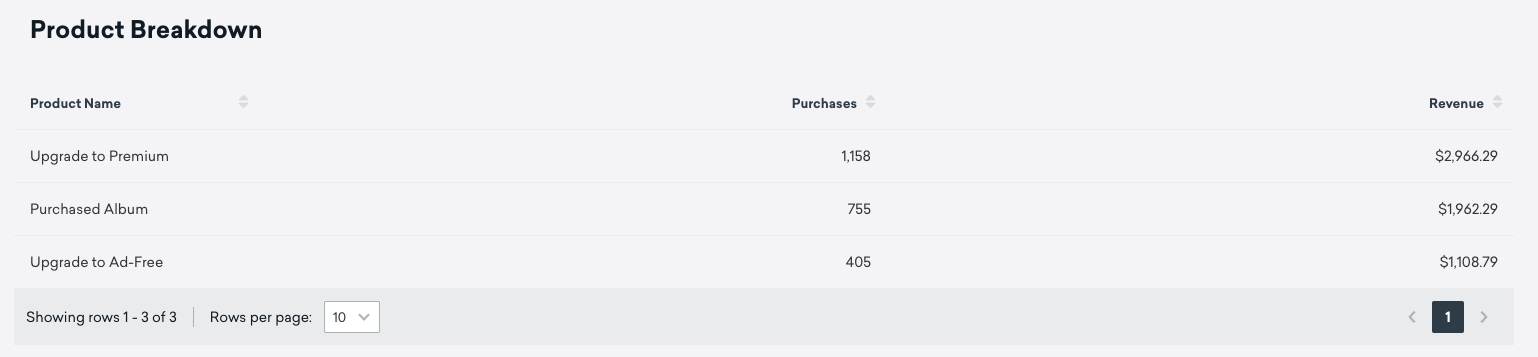
Refer to the Product Breakdown table for a list of the products purchased during your selected date range, how many of each product were purchased, and how much revenue each product generated.
 Edit this page on GitHub